| Param | Original file | Final file |
|---|---|---|
| Filename | modeM0/AS1A10_103T02_9000004514_31199cztM0_level2.evt | modeM0/AS1A10_103T02_9000004514_31199cztM0_level2_quad_clean.evt |
| Size (bytes) | 721,022,400 | 119,787,840 |
| Size | 687.6 MB | 114.2 MB |
| Events in quadrant A | 3,634,675 | 801,317 |
| Events in quadrant B | 6,632,145 | 777,786 |
| Events in quadrant C | 3,866,815 | 773,732 |
| Events in quadrant D | 7,172,157 | 728,860 |
| Mode M9 | |||
|---|---|---|---|
| Quadrant | BADHDUFLAG | Total packets | Discarded packets |
| A | 0 | 6 | 0 |
| B | 0 | 6 | 0 |
| C | 0 | 6 | 0 |
| D | 0 | 6 | 0 |
| Mode SS | |||
|---|---|---|---|
| Quadrant | BADHDUFLAG | Total packets | Discarded packets |
| A | 0 | 164 | 0 |
| B | 0 | 164 | 0 |
| C | 0 | 164 | 0 |
| D | 0 | 164 | 0 |
| Mode M0 | |||
|---|---|---|---|
| Quadrant | BADHDUFLAG | Total packets | Discarded packets |
| A | 0 | 16079 | 2 |
| B | 0 | 25411 | 2 |
| C | 0 | 16611 | 2 |
| D | 0 | 26863 | 2 |
| Quadrant | Total seconds | Saturated seconds | Saturation percentage |
|---|---|---|---|
| A | 7841 | 27 | 0.344344% |
| B | 7842 | 338 | 4.310125% |
| C | 7842 | 119 | 1.517470% |
| D | 7842 | 547 | 6.975261% |
Noise dominated data is calculated using 1-second bins in cleaned event files. If a bin has >2000 counts, and if more than 50% of those come from <1% of pixels, then it is considered to be noise-dominated and hence unusable.
| Quadrant | # 1 sec bins | Bins with >0 counts | Bins with >2000 counts | High rate bins dominated by noise | Noise dominated (total time) | Noise dominated (detector-on time) | Marked lightcurve |
|---|---|---|---|---|---|---|---|
| A | 8541 | 7843 | 0 | 0 | 0.00% | 0.00% | 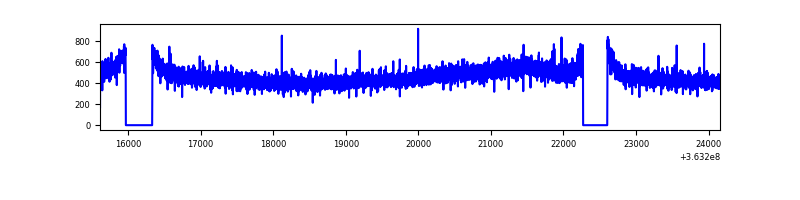 |
| B | 8542 | 7844 | 117 | 117 | 1.37% | 1.49% | 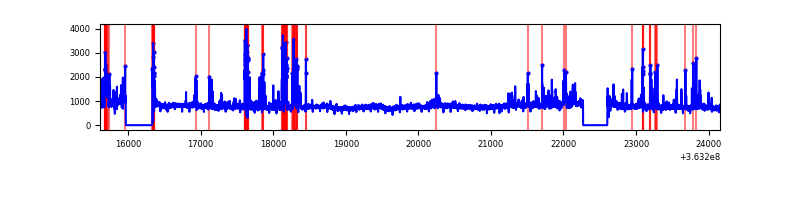 |
| C | 8542 | 7844 | 11 | 11 | 0.13% | 0.14% | 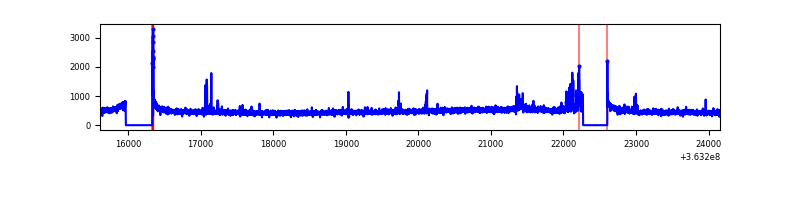 |
| D | 8542 | 7844 | 320 | 320 | 3.75% | 4.08% | 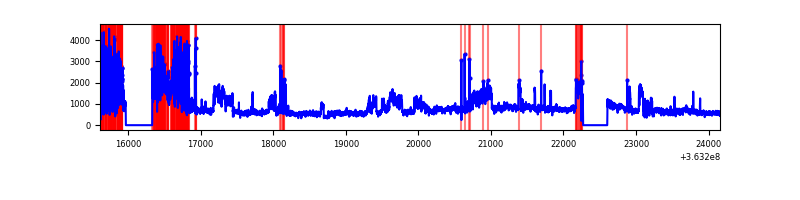 |
Top three noisy pixels from each quadrant. If the there are fewer than three noisy pixels in the level2.evt file, extra rows are filled as -1
| Pixel properties | Quadrant properties | ||||||
|---|---|---|---|---|---|---|---|
| Quadrant | DetID | PixID | Counts | Sigma | Mean | Median | Sigma |
| A | 13 | 254 | 13294 | 65.36 | 941 | 922 | 189.3 |
| A | 3 | 137 | 9735 | 46.56 | 941 | 922 | 189.3 |
| A | 0 | 226 | 8056 | 37.69 | 941 | 922 | 189.3 |
| B | 6 | 159 | 2226136 | 12514.46 | 923 | 897 | 177.8 |
| B | 4 | 80 | 601484 | 3377.62 | 923 | 897 | 177.8 |
| B | 0 | 190 | 63541 | 352.3 | 923 | 897 | 177.8 |
| C | 14 | 238 | 145994 | 686.15 | 899 | 901 | 211.5 |
| C | 10 | 22 | 132434 | 622.02 | 899 | 901 | 211.5 |
| C | 0 | 10 | 34089 | 156.95 | 899 | 901 | 211.5 |
| D | 8 | 195 | 2869453 | 12666.05 | 876 | 856 | 226.5 |
| D | 12 | 79 | 811297 | 3578.44 | 876 | 856 | 226.5 |
| D | 2 | 250 | 65561 | 285.7 | 876 | 856 | 226.5 |
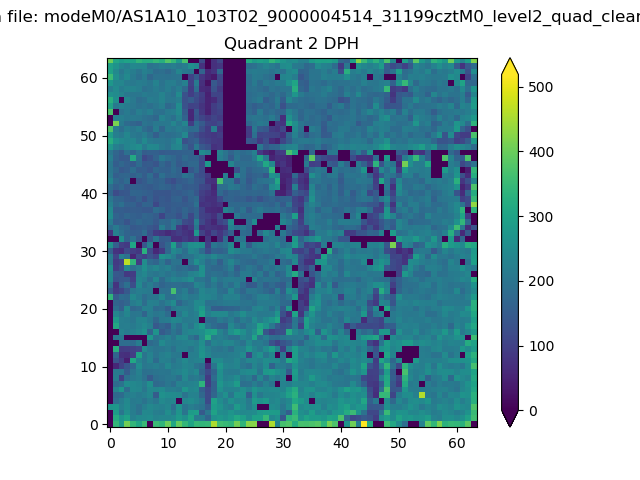
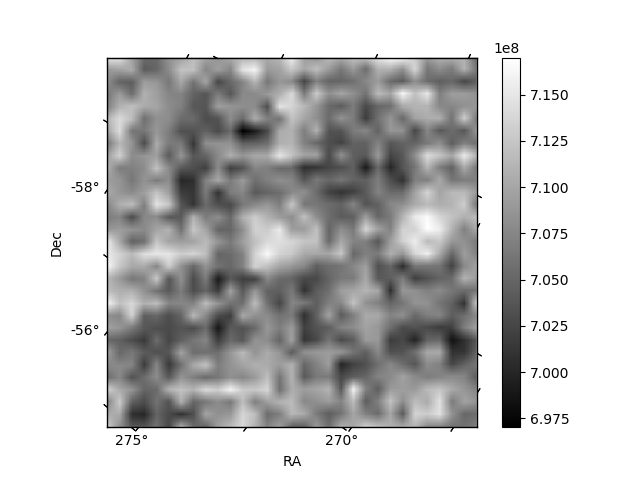
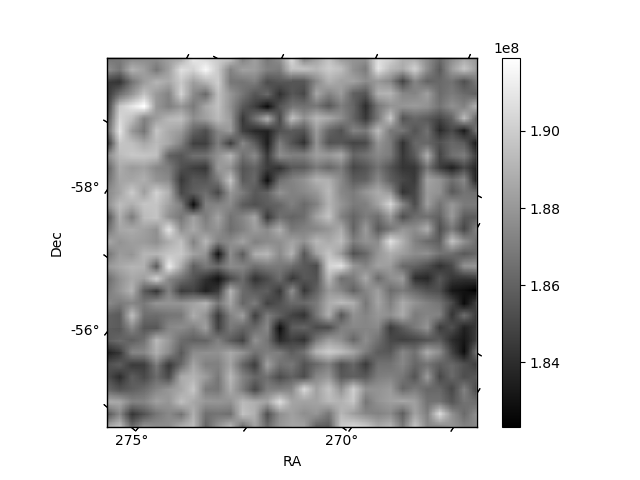
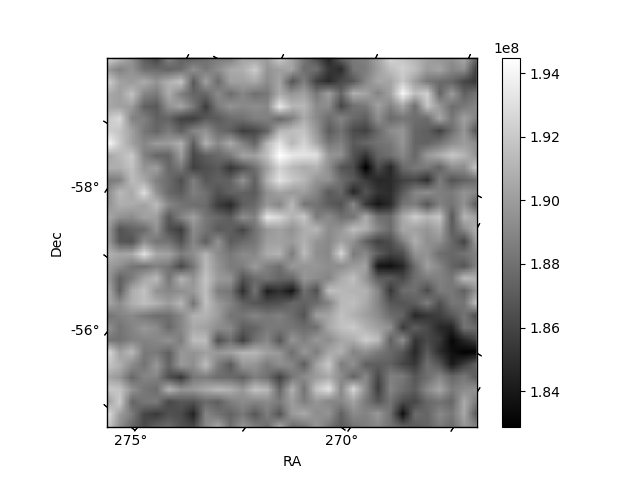
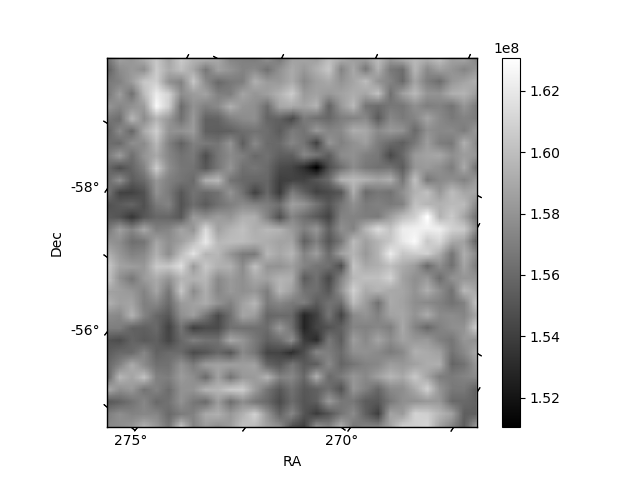
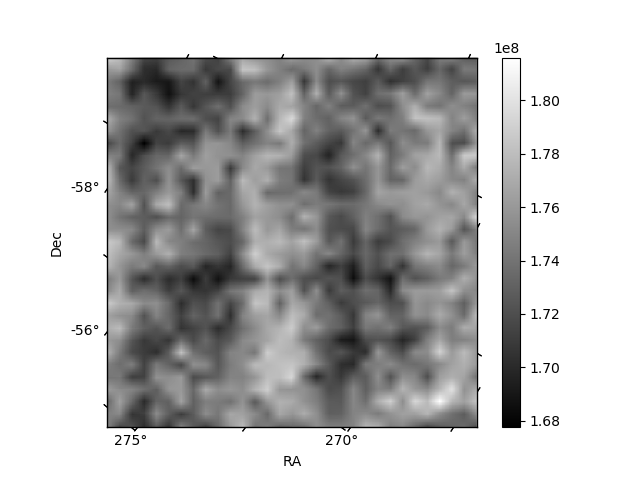
Histogram calculated using DETX and DETY for each event in the final _common_clean file
| Quadrant A | 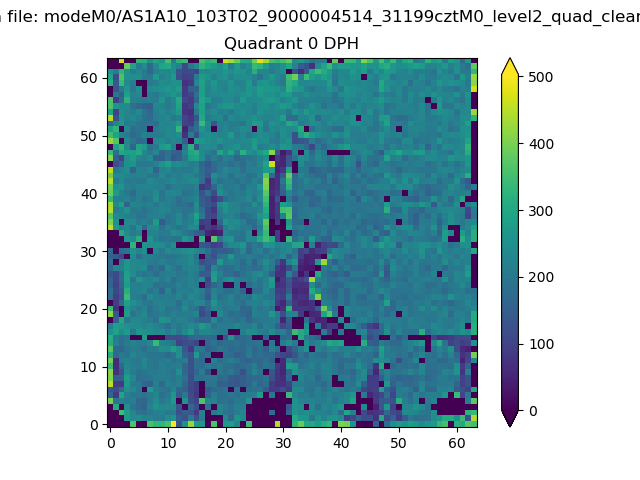 |
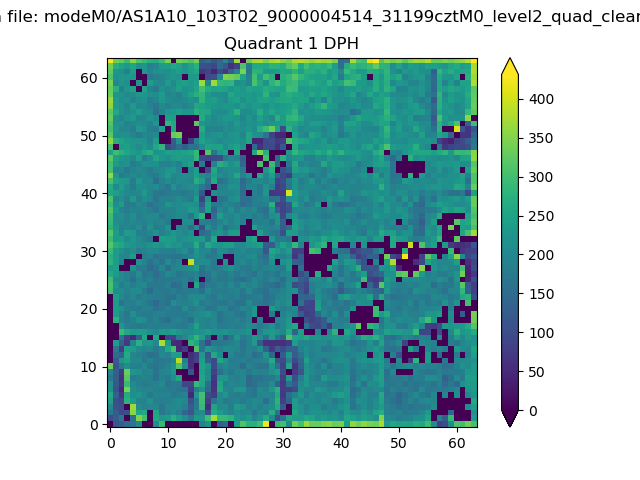 |
Quadrant B |
|---|---|---|---|
| Quadrant D | 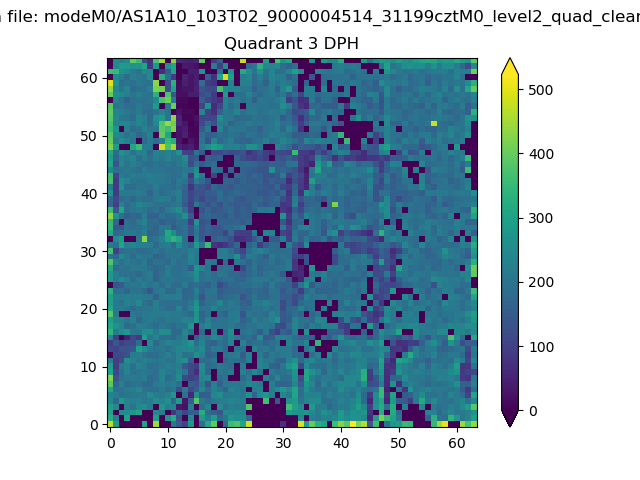 |
 |
Quadrant C |
| Plot type | Count rate plots | Images |
|---|---|---|
| Comparison with Poisson distribution Blue bars denote a histogram of data divided into 1 sec bins. Red curve is a Poisson curve with rate = median count rate of data. |
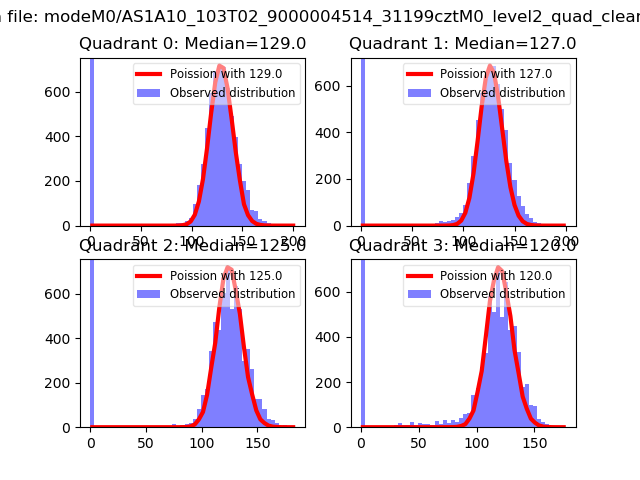 |
 |
| Quadrant-wise count rates Data is divided into 100 sec bins |
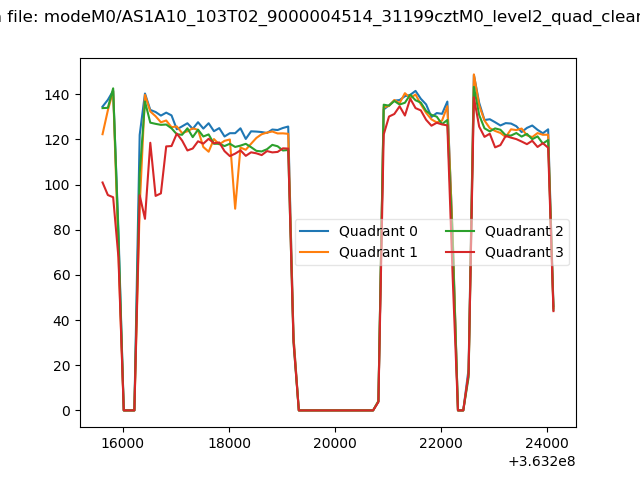 |
|
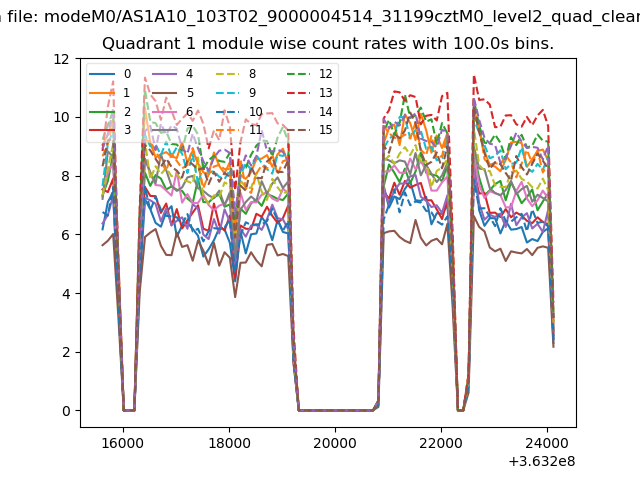
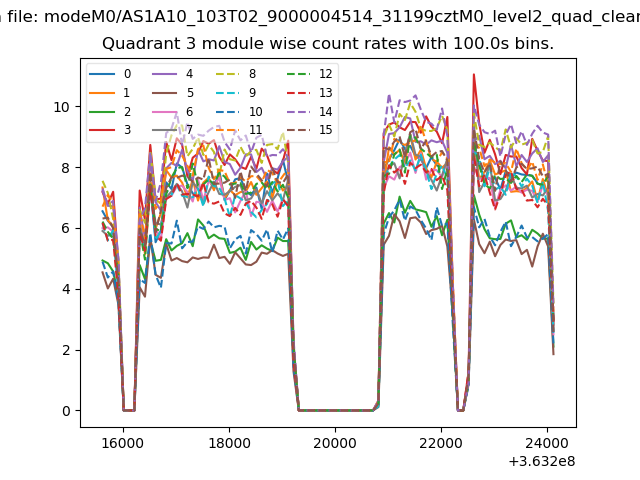
| Module-wise count rates for Quadrant A Data is divided into 100 sec bins |
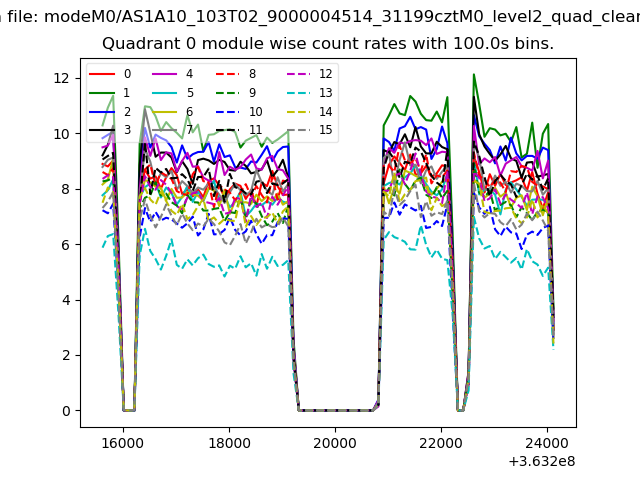 |
 |
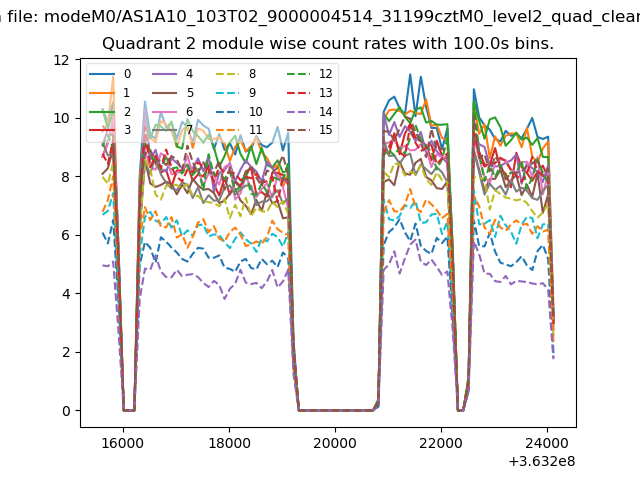
| Module-wise count rates for Quadrant B Data is divided into 100 sec bins |
 |
 |
| Module-wise count rates for Quadrant C Data is divided into 100 sec bins |
 |
 |
| Module-wise count rates for Quadrant D Data is divided into 100 sec bins |
 |
 |
| Parameter | Plot |
|---|---|
| CZT HV Monitor | 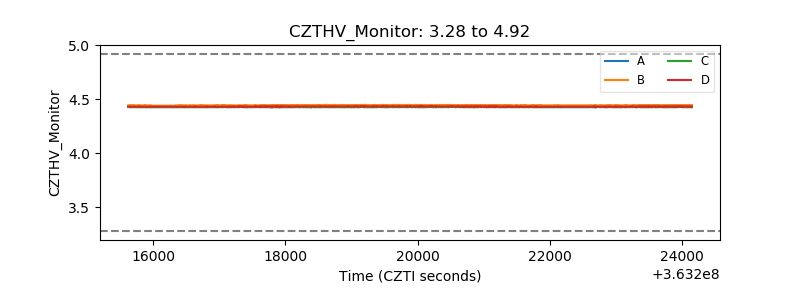 |
| D_VDD | 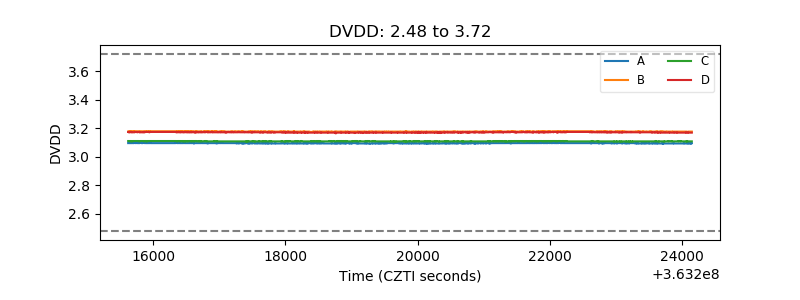 |
| Temperature 1 | 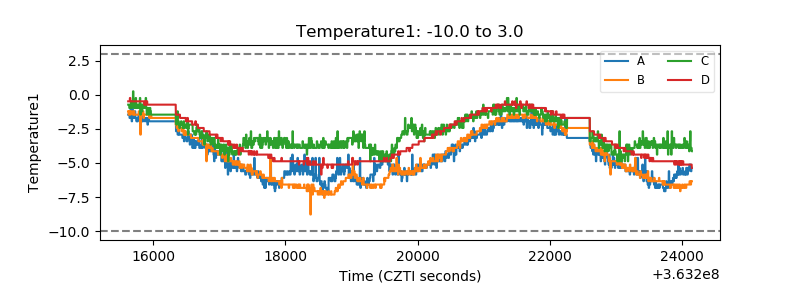 |
| Veto HV Monitor | 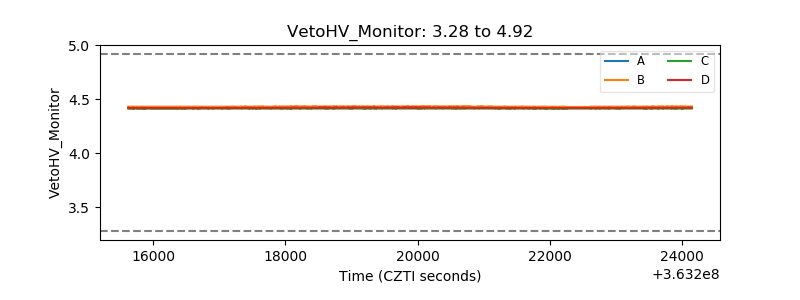 |
| Veto LLD | 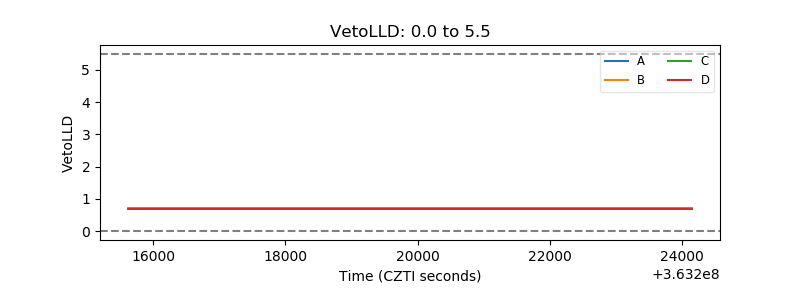 |
| Alpha Counter | 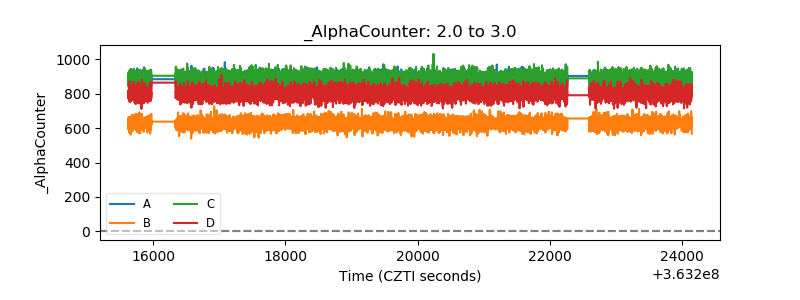 |
| _CPM_Rate | 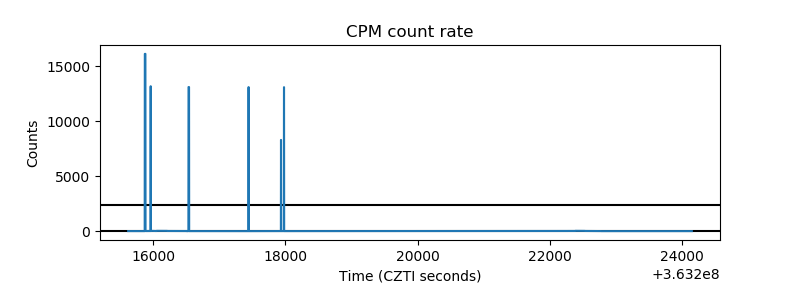 |
| CZT Counter | 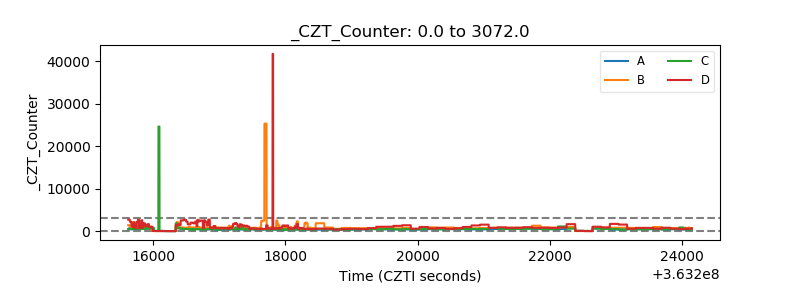 |
| +2.5 Volts monitor |  |
| +5 Volts monitor |  |
| _ROLL_ROT | 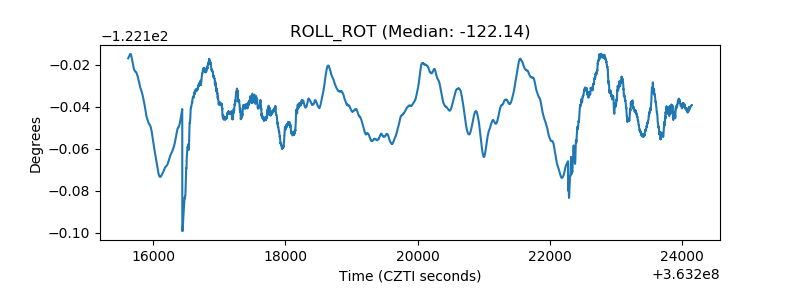 |
| _Roll_DEC | 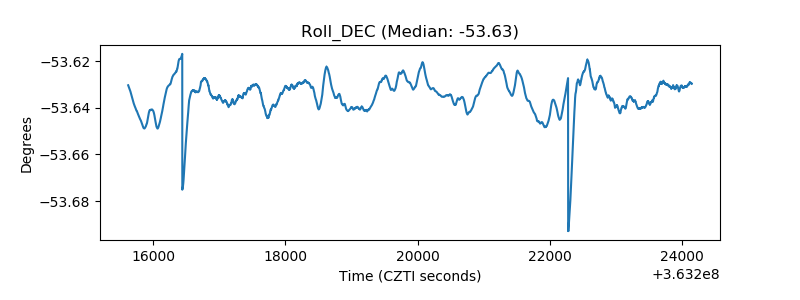 |
| _Roll_RA | 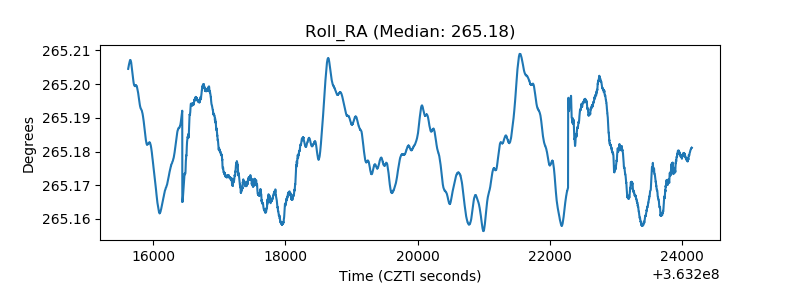 |
| Veto Counter | 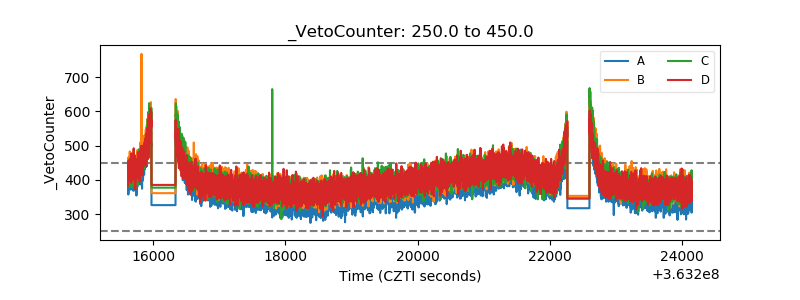 |