| Param | Original file | Final file |
|---|---|---|
| Filename | modeM0/AS1A10_103T02_9000004514_31202cztM0_level2.evt | modeM0/AS1A10_103T02_9000004514_31202cztM0_level2_quad_clean.evt |
| Size (bytes) | 1,656,953,280 | 253,958,400 |
| Size | 1.5 GB | 242.2 MB |
| Events in quadrant A | 8,428,718 | 1,678,959 |
| Events in quadrant B | 16,921,875 | 1,549,357 |
| Events in quadrant C | 8,875,523 | 1,616,668 |
| Events in quadrant D | 14,714,305 | 1,576,232 |
| Mode M9 | |||
|---|---|---|---|
| Quadrant | BADHDUFLAG | Total packets | Discarded packets |
| A | 0 | 20 | 0 |
| B | 0 | 20 | 0 |
| C | 0 | 20 | 0 |
| D | 0 | 20 | 0 |
| Mode SS | |||
|---|---|---|---|
| Quadrant | BADHDUFLAG | Total packets | Discarded packets |
| A | 0 | 374 | 0 |
| B | 0 | 374 | 0 |
| C | 0 | 374 | 0 |
| D | 0 | 374 | 0 |
| Mode M0 | |||
|---|---|---|---|
| Quadrant | BADHDUFLAG | Total packets | Discarded packets |
| A | 0 | 37235 | 3 |
| B | 0 | 64283 | 3 |
| C | 0 | 37848 | 3 |
| D | 0 | 56933 | 3 |
| Quadrant | Total seconds | Saturated seconds | Saturation percentage |
|---|---|---|---|
| A | 18429 | 71 | 0.385262% |
| B | 18429 | 1856 | 10.071084% |
| C | 18429 | 269 | 1.459656% |
| D | 18429 | 302 | 1.638722% |
Noise dominated data is calculated using 1-second bins in cleaned event files. If a bin has >2000 counts, and if more than 50% of those come from <1% of pixels, then it is considered to be noise-dominated and hence unusable.
| Quadrant | # 1 sec bins | Bins with >0 counts | Bins with >2000 counts | High rate bins dominated by noise | Noise dominated (total time) | Noise dominated (detector-on time) | Marked lightcurve |
|---|---|---|---|---|---|---|---|
| A | 20394 | 18432 | 0 | 0 | 0.00% | 0.00% | 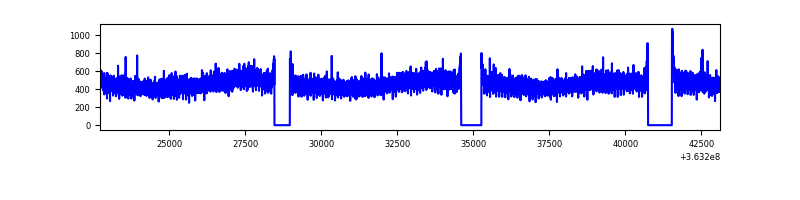 |
| B | 20394 | 18432 | 1040 | 1040 | 5.10% | 5.64% | 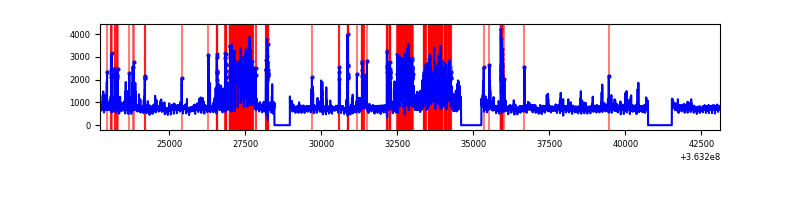 |
| C | 20394 | 18432 | 1 | 1 | 0.00% | 0.01% | 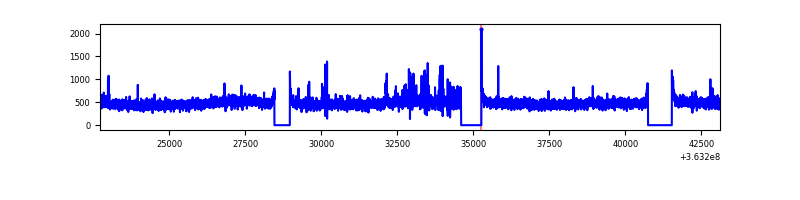 |
| D | 20394 | 18432 | 104 | 104 | 0.51% | 0.56% | 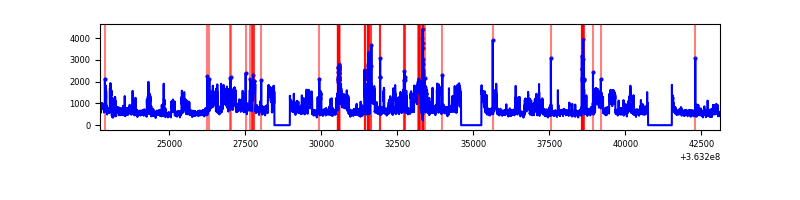 |
Top three noisy pixels from each quadrant. If the there are fewer than three noisy pixels in the level2.evt file, extra rows are filled as -1
| Pixel properties | Quadrant properties | ||||||
|---|---|---|---|---|---|---|---|
| Quadrant | DetID | PixID | Counts | Sigma | Mean | Median | Sigma |
| A | 13 | 254 | 32136 | 68.92 | 2184 | 2131 | 435.4 |
| A | 3 | 137 | 22752 | 47.36 | 2184 | 2131 | 435.4 |
| A | 0 | 226 | 18182 | 36.87 | 2184 | 2131 | 435.4 |
| B | 6 | 159 | 4908299 | 12408.47 | 2068 | 2014 | 395.4 |
| B | 4 | 80 | 3679382 | 9300.42 | 2068 | 2014 | 395.4 |
| B | 0 | 190 | 98594 | 244.26 | 2068 | 2014 | 395.4 |
| C | 14 | 238 | 386034 | 777.74 | 2104 | 2113 | 493.6 |
| C | 4 | 175 | 96058 | 190.31 | 2104 | 2113 | 493.6 |
| C | 10 | 22 | 76636 | 150.97 | 2104 | 2113 | 493.6 |
| D | 8 | 195 | 6157507 | 11820.56 | 2095 | 2047 | 520.7 |
| D | 2 | 250 | 243371 | 463.42 | 2095 | 2047 | 520.7 |
| D | 12 | 79 | 191302 | 363.43 | 2095 | 2047 | 520.7 |
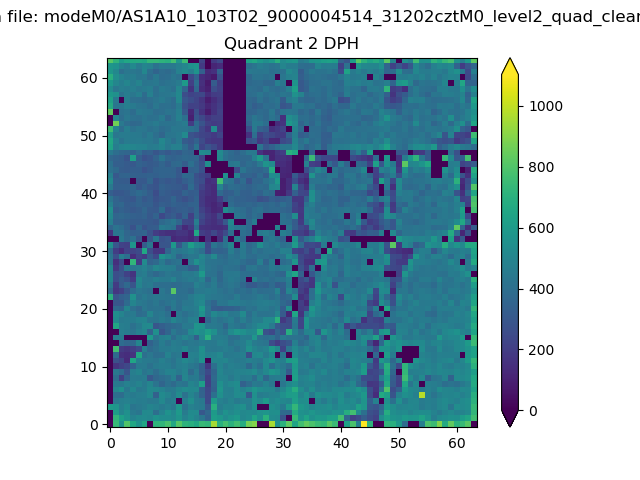
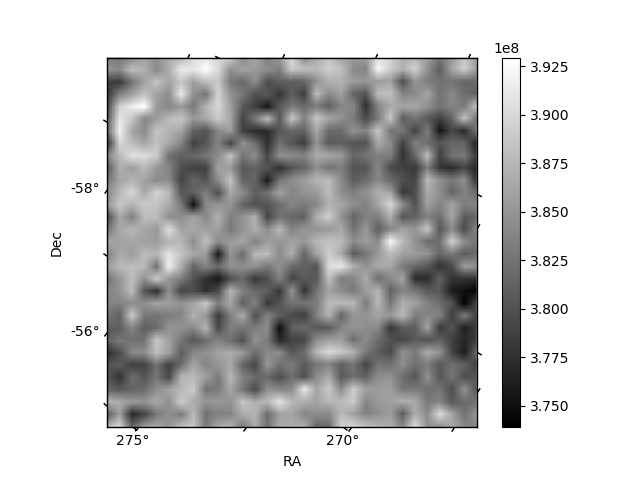
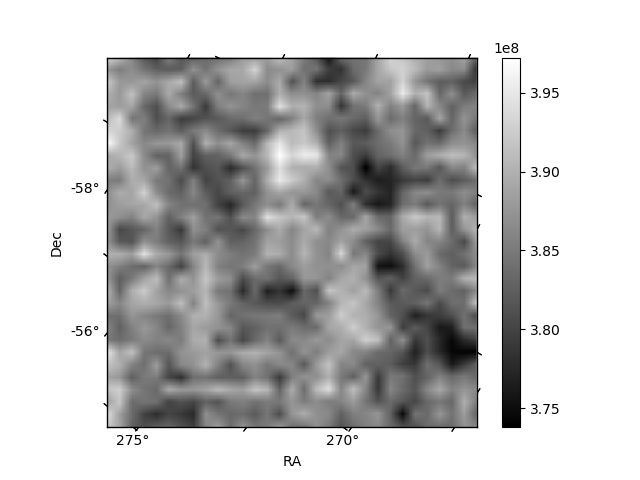
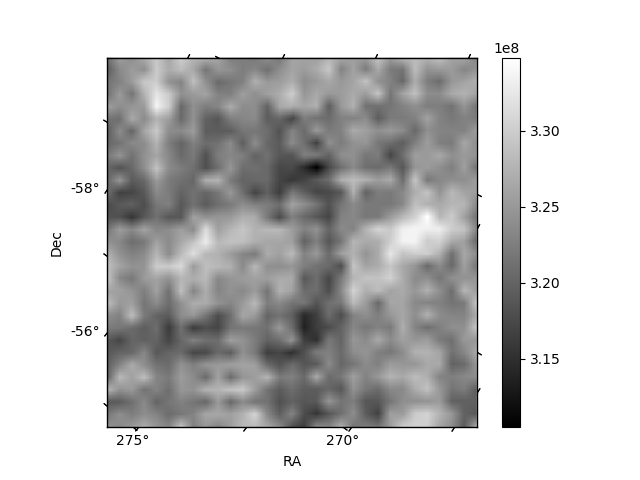
Histogram calculated using DETX and DETY for each event in the final _common_clean file
| Quadrant A | 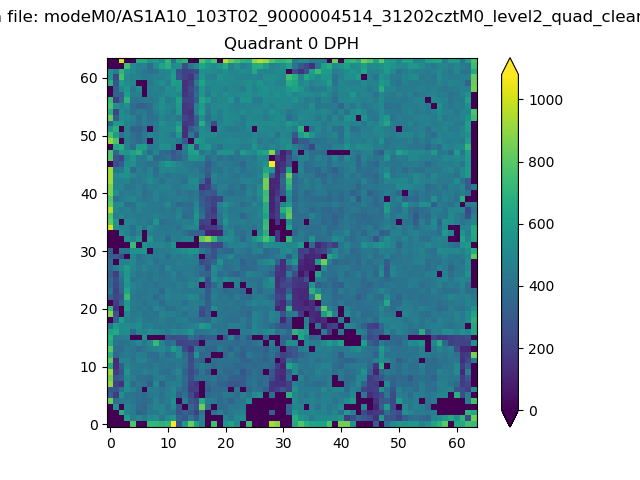 |
 |
Quadrant B |
|---|---|---|---|
| Quadrant D |  |
 |
Quadrant C |
| Plot type | Count rate plots | Images |
|---|---|---|
| Comparison with Poisson distribution Blue bars denote a histogram of data divided into 1 sec bins. Red curve is a Poisson curve with rate = median count rate of data. |
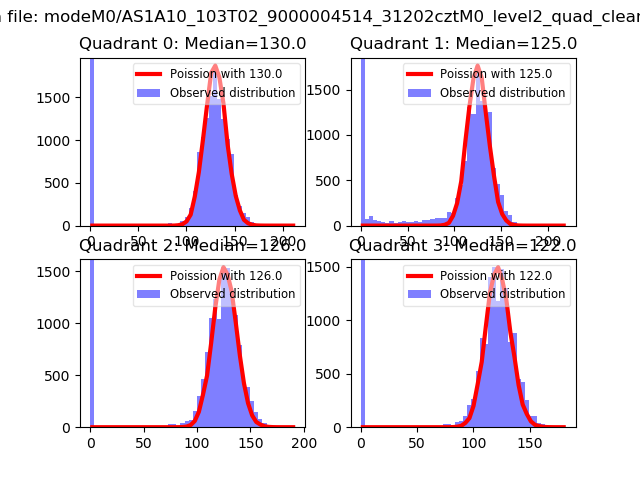 |
 |
| Quadrant-wise count rates Data is divided into 100 sec bins |
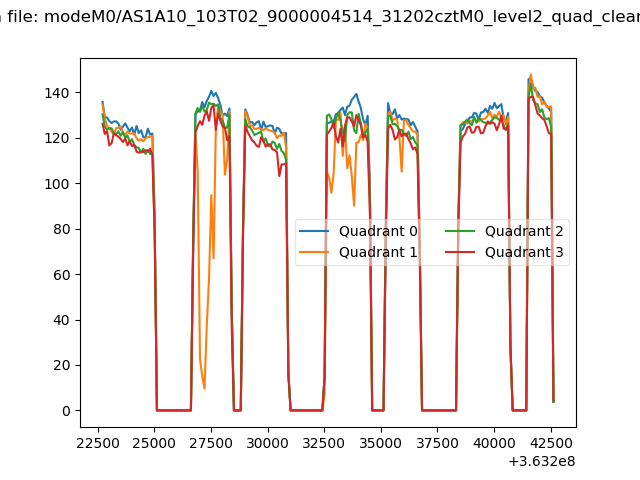 |
|
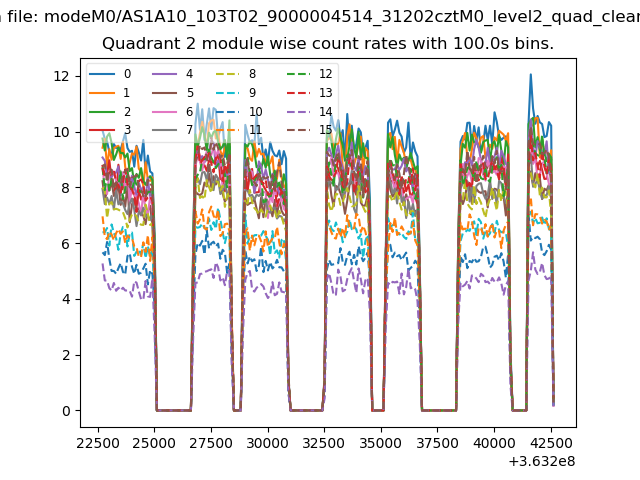
| Module-wise count rates for Quadrant A Data is divided into 100 sec bins |
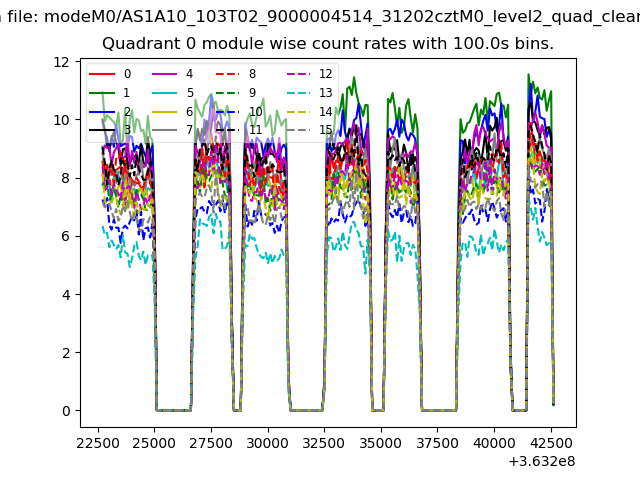 |
 |
| Module-wise count rates for Quadrant B Data is divided into 100 sec bins |
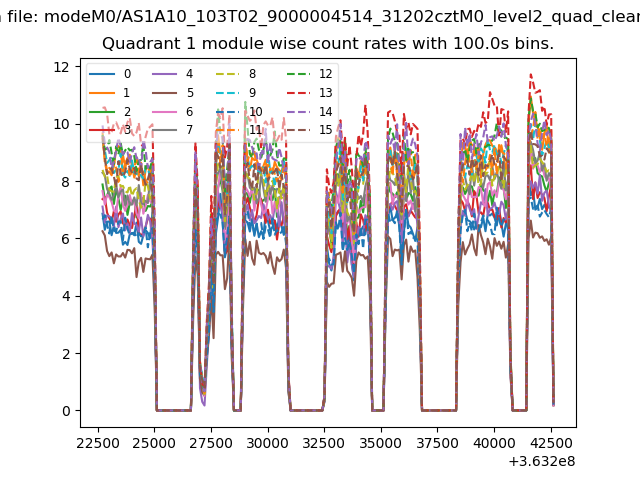 |
 |
| Module-wise count rates for Quadrant C Data is divided into 100 sec bins |
 |
 |
| Module-wise count rates for Quadrant D Data is divided into 100 sec bins |
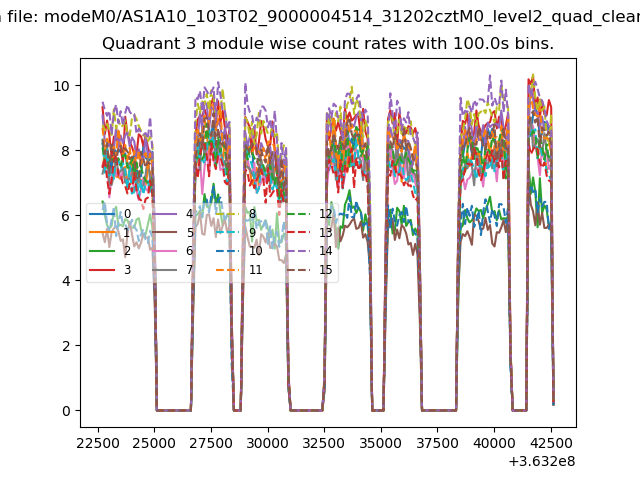 |
 |
| Parameter | Plot |
|---|---|
| CZT HV Monitor |  |
| D_VDD | 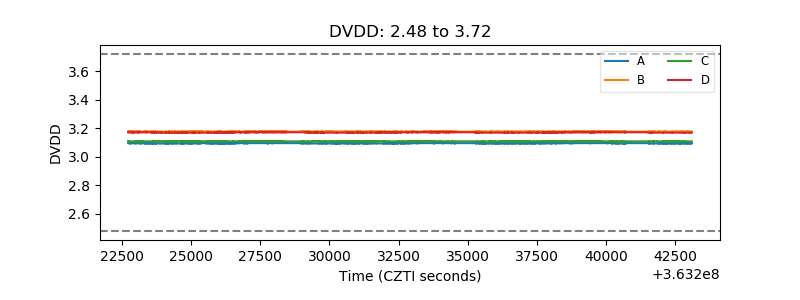 |
| Temperature 1 | 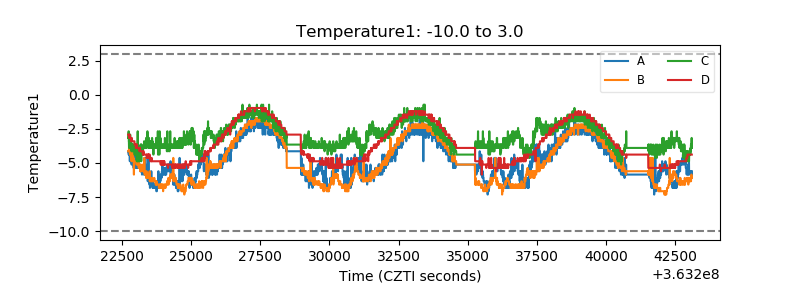 |
| Veto HV Monitor | 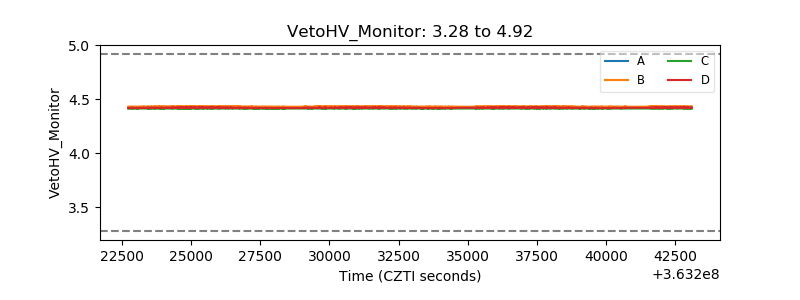 |
| Veto LLD | 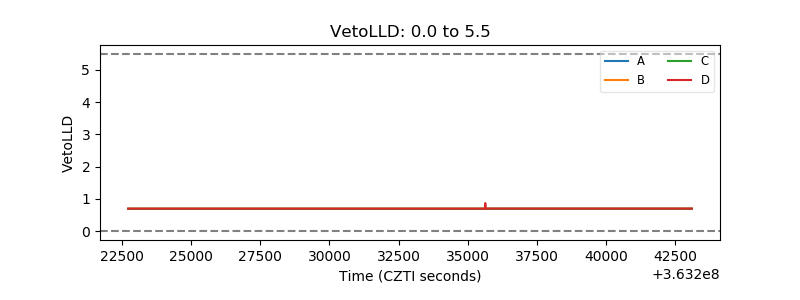 |
| Alpha Counter | 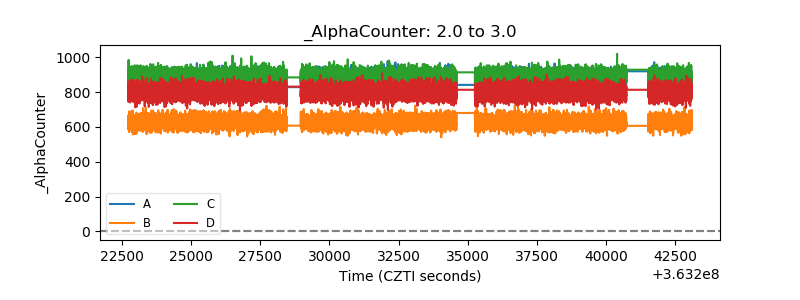 |
| _CPM_Rate | 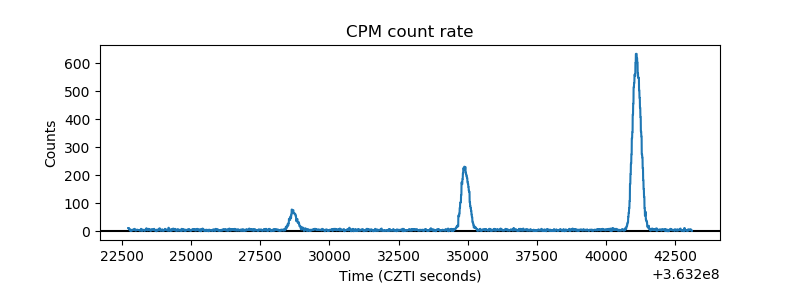 |
| CZT Counter | 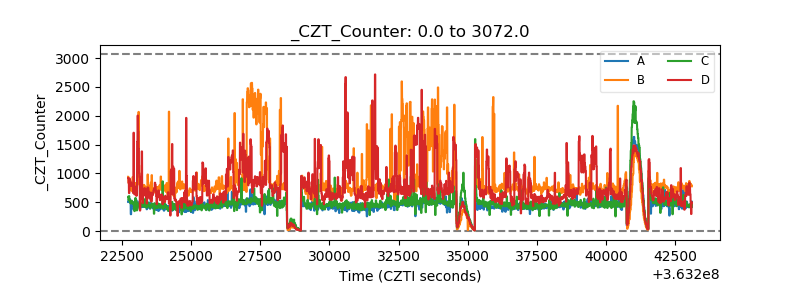 |
| +2.5 Volts monitor |  |
| +5 Volts monitor |  |
| _ROLL_ROT | 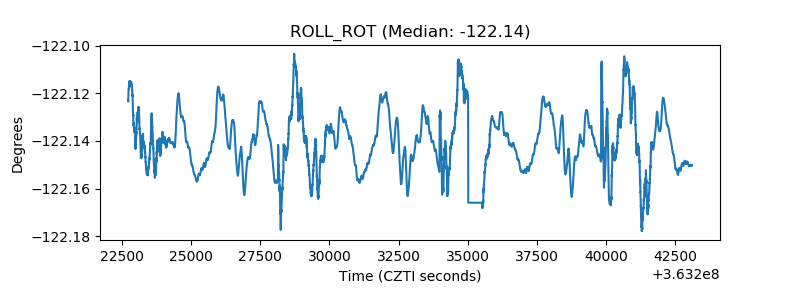 |
| _Roll_DEC | 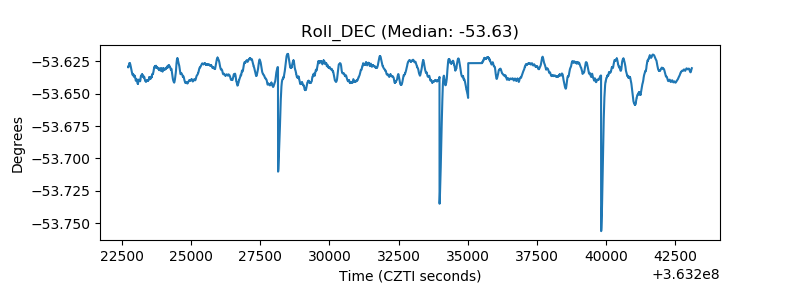 |
| _Roll_RA | 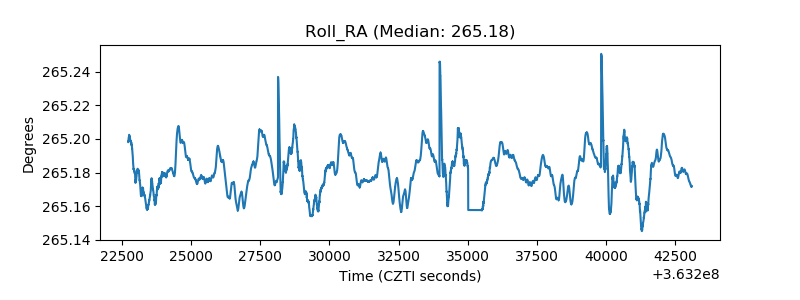 |
| Veto Counter | 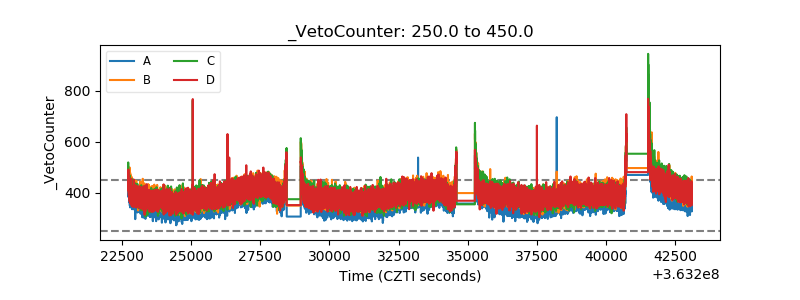 |