| Param | Original file | Final file |
|---|---|---|
| Filename | modeM0/AS1A10_103T02_9000004514_31203cztM0_level2.evt | modeM0/AS1A10_103T02_9000004514_31203cztM0_level2_quad_clean.evt |
| Size (bytes) | 3,152,747,520 | 471,663,360 |
| Size | 2.9 GB | 449.8 MB |
| Events in quadrant A | 15,963,003 | 3,105,902 |
| Events in quadrant B | 30,521,376 | 2,925,424 |
| Events in quadrant C | 16,887,152 | 2,994,266 |
| Events in quadrant D | 29,781,292 | 2,879,597 |
| Mode M9 | |||
|---|---|---|---|
| Quadrant | BADHDUFLAG | Total packets | Discarded packets |
| A | 0 | 35 | 0 |
| B | 0 | 35 | 0 |
| C | 0 | 35 | 0 |
| D | 0 | 35 | 0 |
| Mode SS | |||
|---|---|---|---|
| Quadrant | BADHDUFLAG | Total packets | Discarded packets |
| A | 0 | 708 | 0 |
| B | 0 | 708 | 0 |
| C | 0 | 708 | 0 |
| D | 0 | 708 | 0 |
| Mode M0 | |||
|---|---|---|---|
| Quadrant | BADHDUFLAG | Total packets | Discarded packets |
| A | 0 | 70311 | 6 |
| B | 0 | 116790 | 6 |
| C | 0 | 72092 | 6 |
| D | 0 | 113011 | 12 |
| Quadrant | Total seconds | Saturated seconds | Saturation percentage |
|---|---|---|---|
| A | 34632 | 135 | 0.389813% |
| B | 34633 | 2553 | 7.371582% |
| C | 34633 | 518 | 1.495683% |
| D | 34632 | 1786 | 5.157080% |
Noise dominated data is calculated using 1-second bins in cleaned event files. If a bin has >2000 counts, and if more than 50% of those come from <1% of pixels, then it is considered to be noise-dominated and hence unusable.
| Quadrant | # 1 sec bins | Bins with >0 counts | Bins with >2000 counts | High rate bins dominated by noise | Noise dominated (total time) | Noise dominated (detector-on time) | Marked lightcurve |
|---|---|---|---|---|---|---|---|
| A | 38252 | 34638 | 0 | 0 | 0.00% | 0.00% | 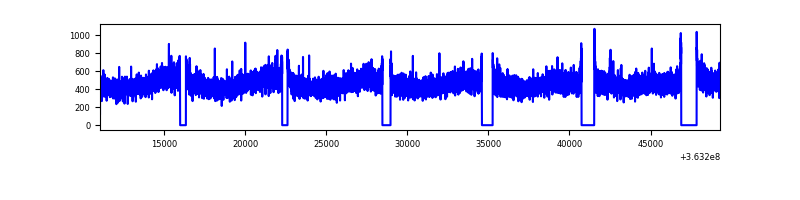 |
| B | 38253 | 34639 | 1350 | 1350 | 3.53% | 3.90% | 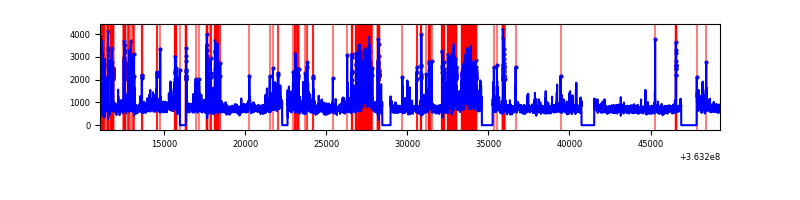 |
| C | 38253 | 34639 | 13 | 13 | 0.03% | 0.04% | 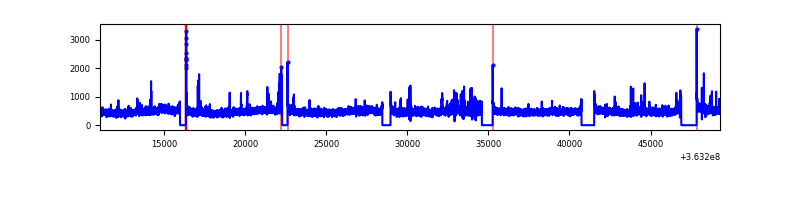 |
| D | 38252 | 34638 | 1154 | 1154 | 3.02% | 3.33% | 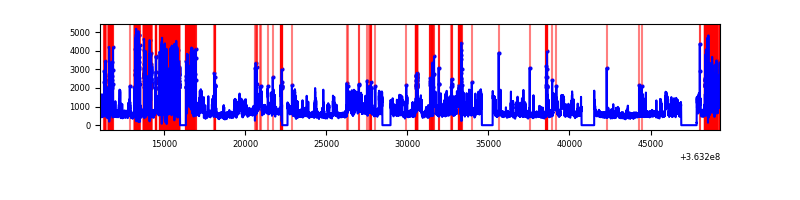 |
Top three noisy pixels from each quadrant. If the there are fewer than three noisy pixels in the level2.evt file, extra rows are filled as -1
| Pixel properties | Quadrant properties | ||||||
|---|---|---|---|---|---|---|---|
| Quadrant | DetID | PixID | Counts | Sigma | Mean | Median | Sigma |
| A | 13 | 254 | 61063 | 69.43 | 4137 | 4042 | 821.3 |
| A | 3 | 137 | 42568 | 46.91 | 4137 | 4042 | 821.3 |
| A | 0 | 226 | 34596 | 37.2 | 4137 | 4042 | 821.3 |
| B | 6 | 159 | 9351834 | 12398.47 | 3977 | 3868 | 754.0 |
| B | 4 | 80 | 5048443 | 6690.76 | 3977 | 3868 | 754.0 |
| B | 0 | 190 | 228391 | 297.79 | 3977 | 3868 | 754.0 |
| C | 14 | 238 | 708554 | 759.27 | 3982 | 4002 | 927.9 |
| C | 10 | 22 | 291081 | 309.37 | 3982 | 4002 | 927.9 |
| C | 4 | 175 | 132087 | 138.03 | 3982 | 4002 | 927.9 |
| D | 8 | 195 | 10991135 | 11280.98 | 3904 | 3817 | 974.0 |
| D | 12 | 79 | 3274610 | 3358.21 | 3904 | 3817 | 974.0 |
| D | 2 | 250 | 368389 | 374.32 | 3904 | 3817 | 974.0 |
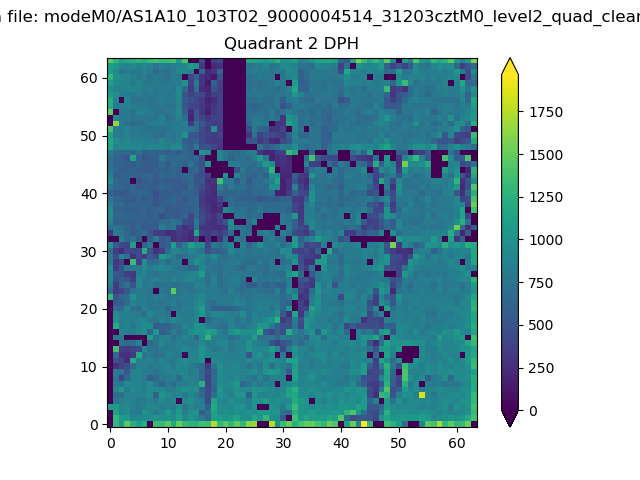
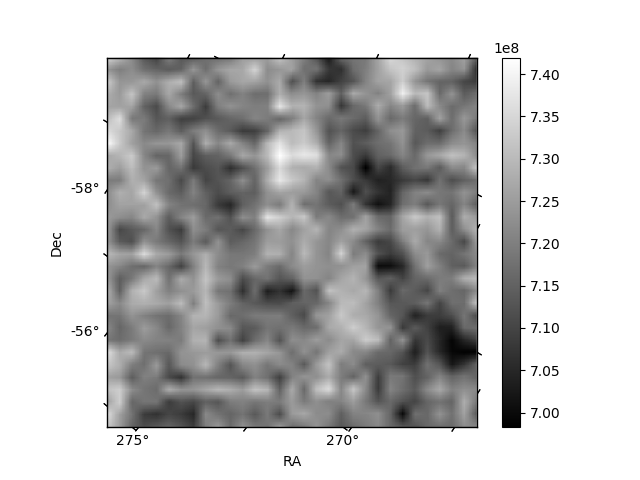
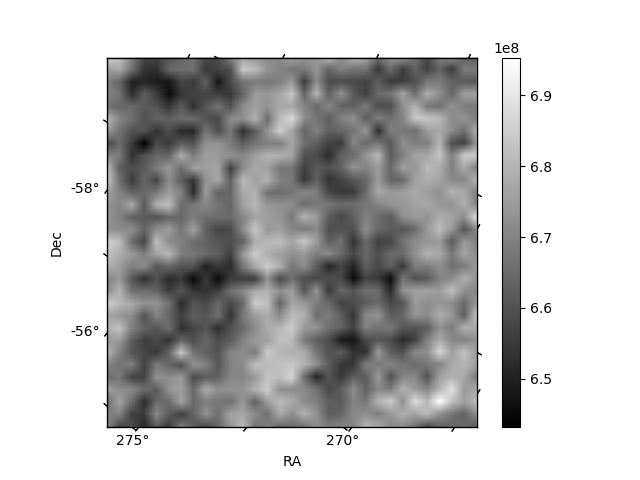
Histogram calculated using DETX and DETY for each event in the final _common_clean file
| Quadrant A | 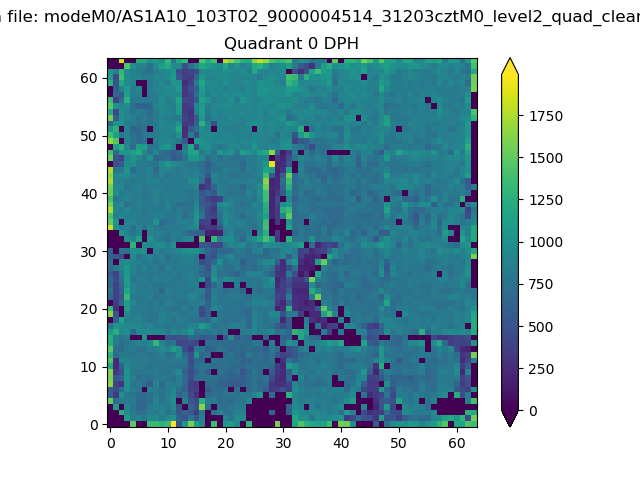 |
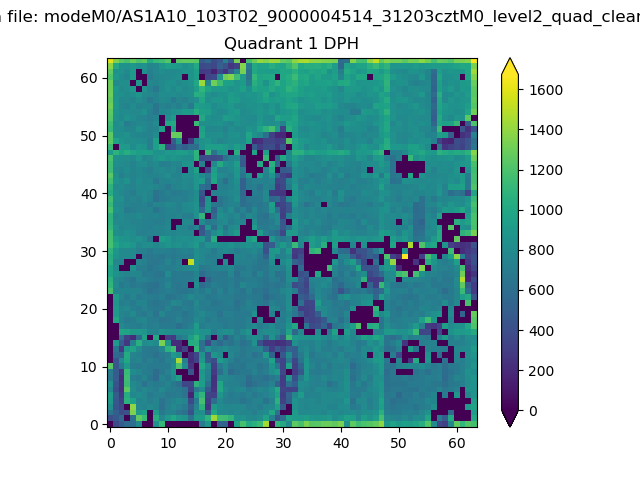 |
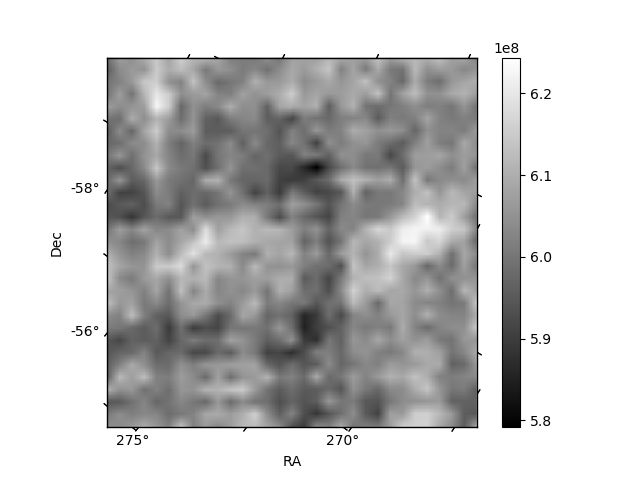
Quadrant B |
|---|---|---|---|
| Quadrant D | 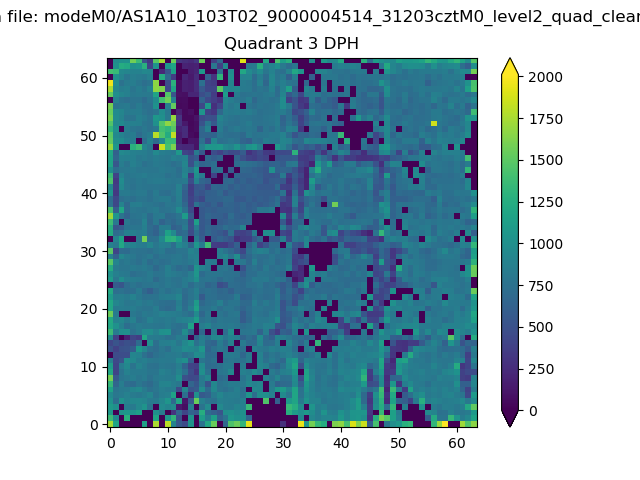 |
 |
Quadrant C |
| Plot type | Count rate plots | Images |
|---|---|---|
| Comparison with Poisson distribution Blue bars denote a histogram of data divided into 1 sec bins. Red curve is a Poisson curve with rate = median count rate of data. |
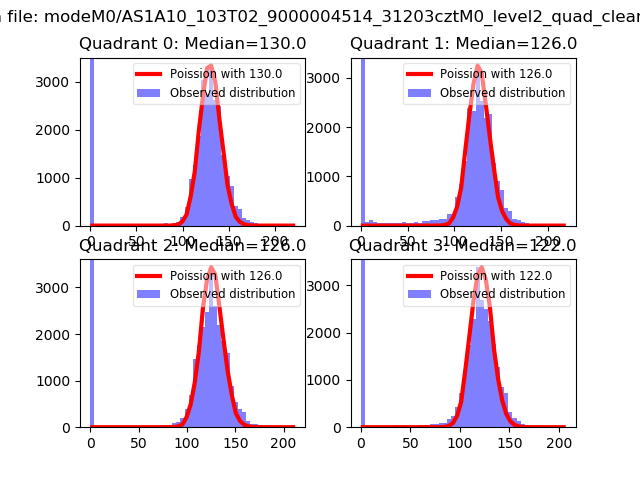 |
 |
| Quadrant-wise count rates Data is divided into 100 sec bins |
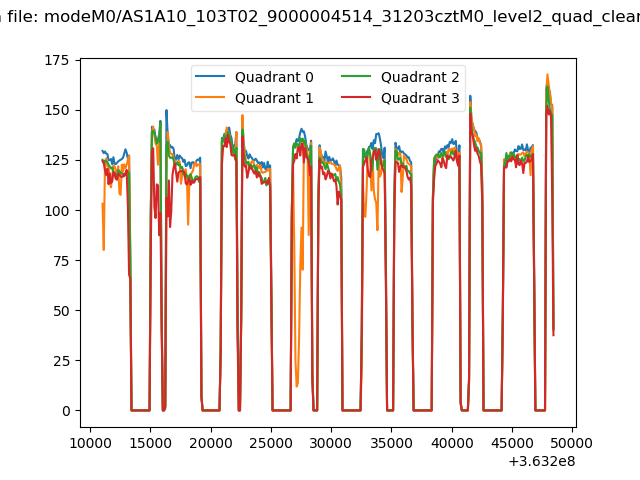 |
|
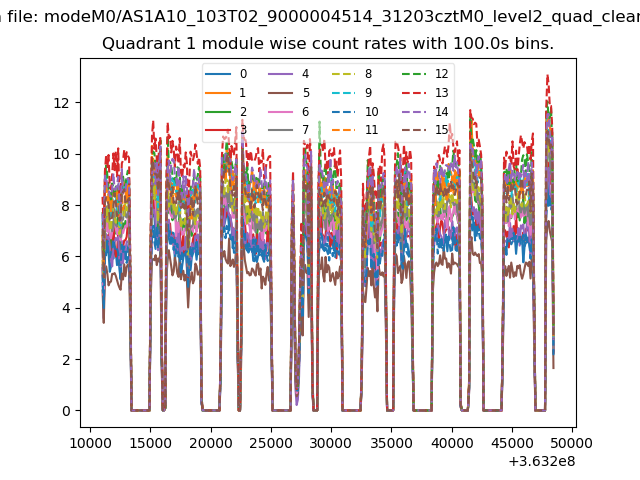
| Module-wise count rates for Quadrant A Data is divided into 100 sec bins |
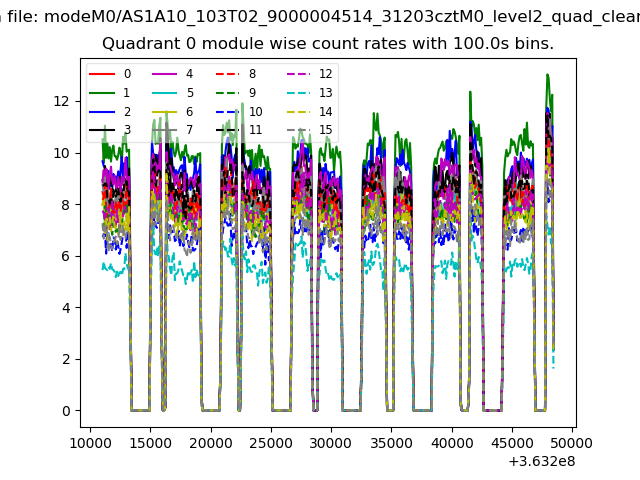 |
 |
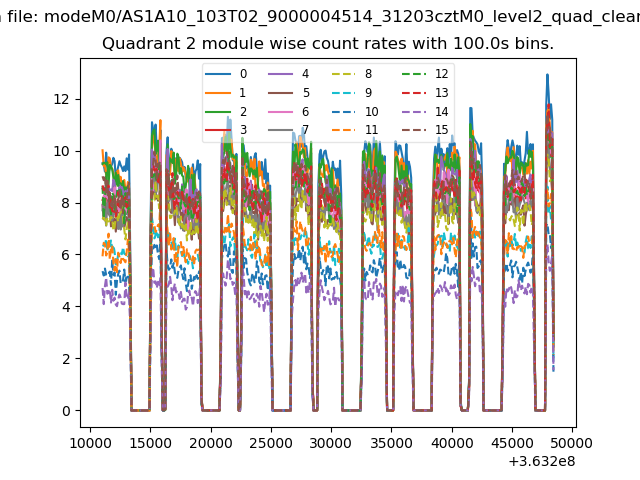
| Module-wise count rates for Quadrant B Data is divided into 100 sec bins |
 |
 |
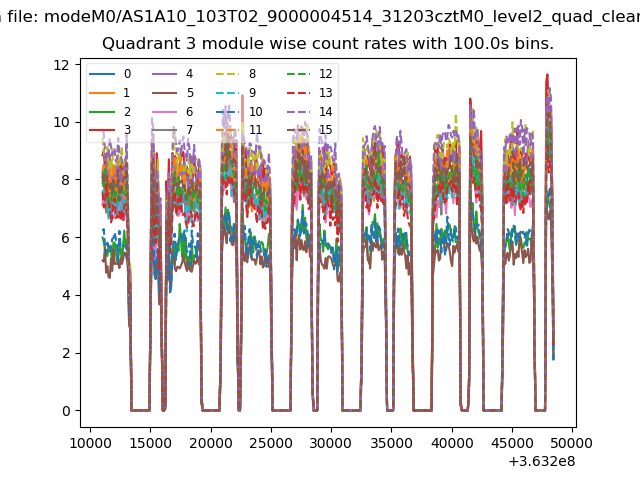
| Module-wise count rates for Quadrant C Data is divided into 100 sec bins |
 |
 |
| Module-wise count rates for Quadrant D Data is divided into 100 sec bins |
 |
 |
| Parameter | Plot |
|---|---|
| CZT HV Monitor | 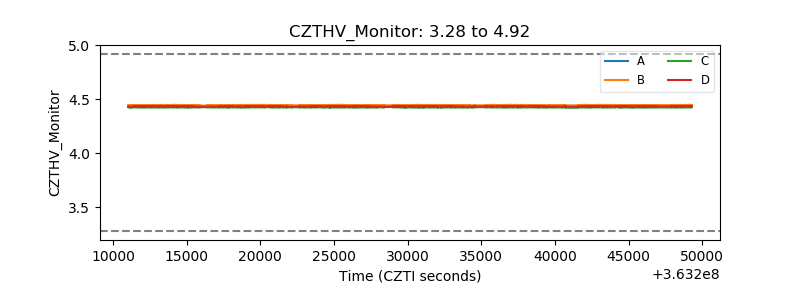 |
| D_VDD | 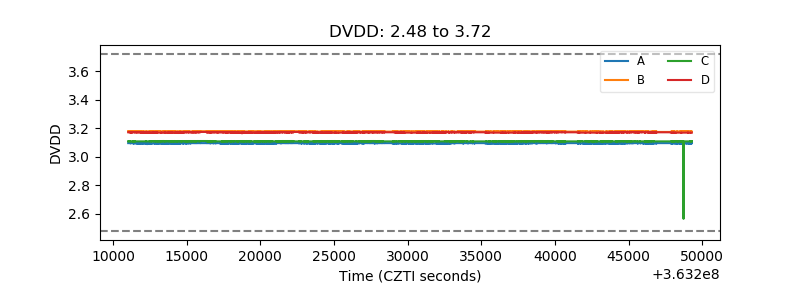 |
| Temperature 1 | 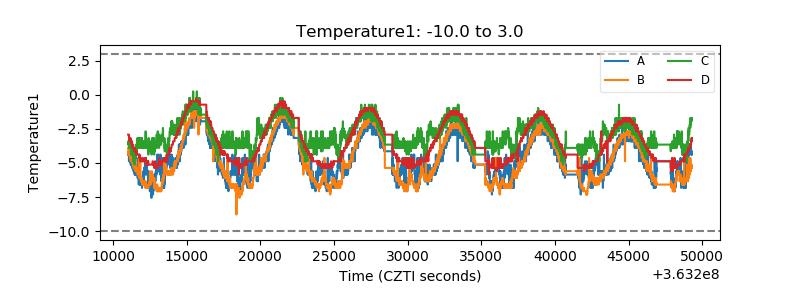 |
| Veto HV Monitor | 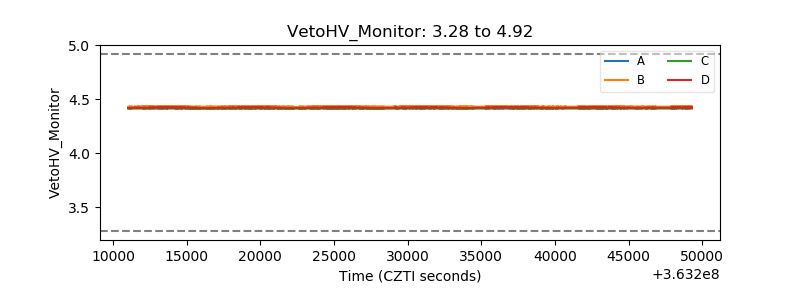 |
| Veto LLD | 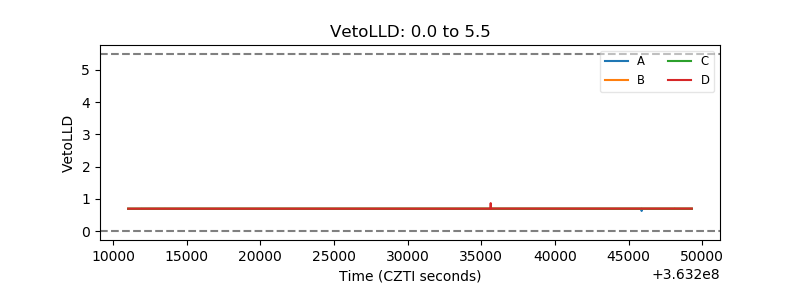 |
| Alpha Counter | 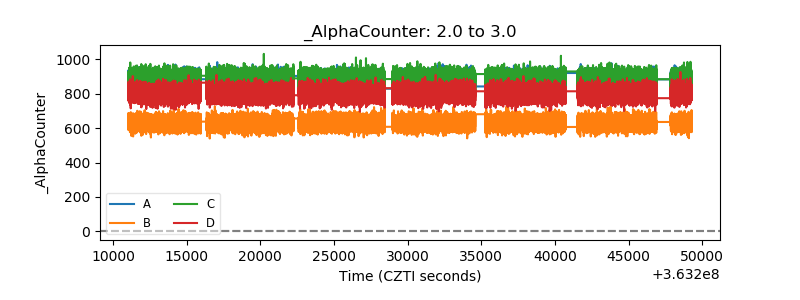 |
| _CPM_Rate | 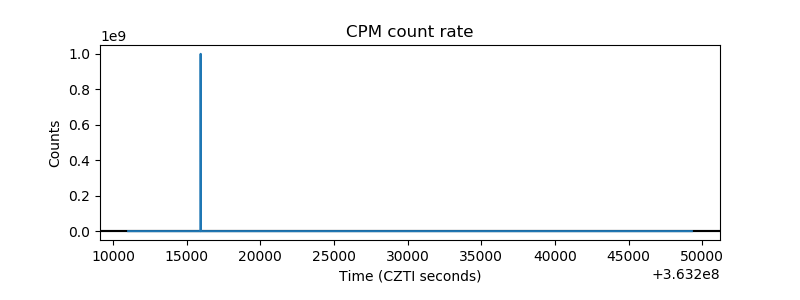 |
| CZT Counter | 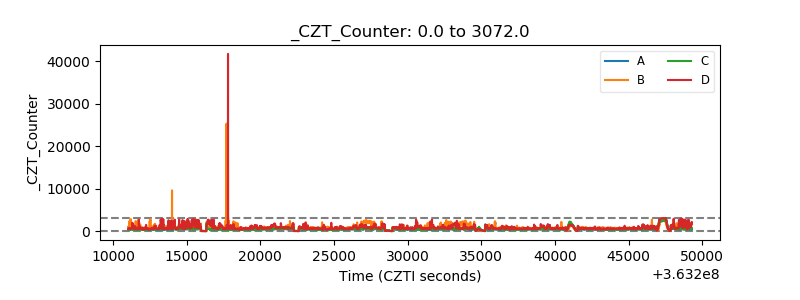 |
| +2.5 Volts monitor |  |
| +5 Volts monitor |  |
| _ROLL_ROT | 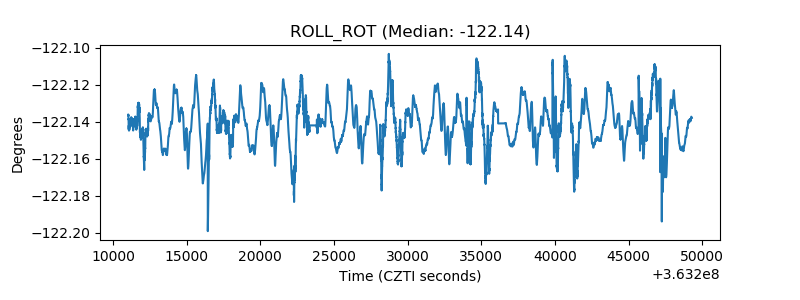 |
| _Roll_DEC | 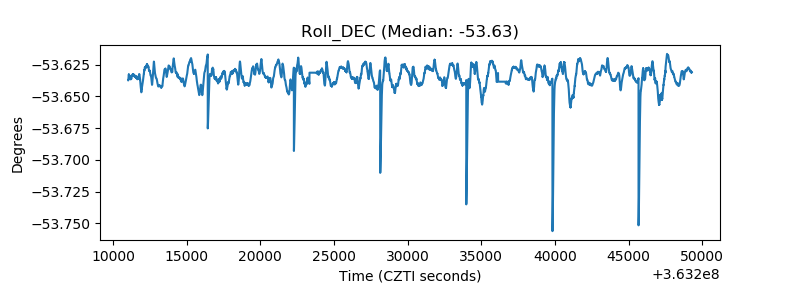 |
| _Roll_RA | 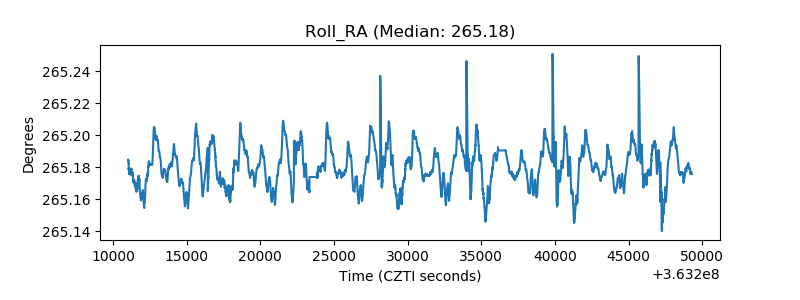 |
| Veto Counter | 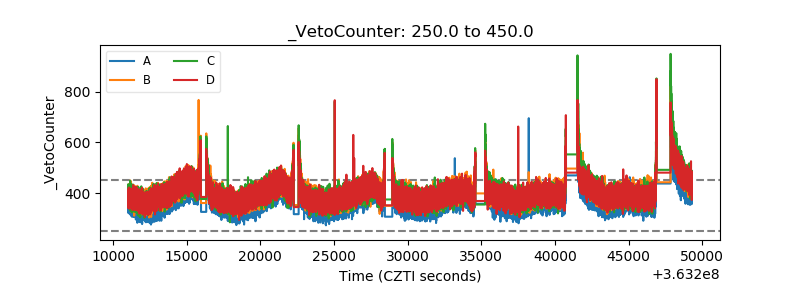 |