| Param | Original file | Final file |
|---|---|---|
| Filename | modeM0/AS1A10_103T02_9000004514_31209cztM0_level2.evt | modeM0/AS1A10_103T02_9000004514_31209cztM0_level2_quad_clean.evt |
| Size (bytes) | 396,181,440 | 66,317,760 |
| Size | 377.8 MB | 63.2 MB |
| Events in quadrant A | 1,738,890 | 471,210 |
| Events in quadrant B | 3,335,363 | 446,907 |
| Events in quadrant C | 1,977,358 | 439,488 |
| Events in quadrant D | 4,717,286 | 410,441 |
| Mode SS | |||
|---|---|---|---|
| Quadrant | BADHDUFLAG | Total packets | Discarded packets |
| A | 0 | 68 | 0 |
| B | 0 | 68 | 0 |
| C | 0 | 68 | 0 |
| D | 0 | 68 | 0 |
| Mode M0 | |||
|---|---|---|---|
| Quadrant | BADHDUFLAG | Total packets | Discarded packets |
| A | 0 | 7338 | 0 |
| B | 0 | 12239 | 0 |
| C | 0 | 8095 | 0 |
| D | 0 | 16440 | 0 |
| Quadrant | Total seconds | Saturated seconds | Saturation percentage |
|---|---|---|---|
| A | 3382 | 8 | 0.236546% |
| B | 3382 | 314 | 9.284447% |
| C | 3382 | 81 | 2.395033% |
| D | 3383 | 508 | 15.016258% |
Noise dominated data is calculated using 1-second bins in cleaned event files. If a bin has >2000 counts, and if more than 50% of those come from <1% of pixels, then it is considered to be noise-dominated and hence unusable.
| Quadrant | # 1 sec bins | Bins with >0 counts | Bins with >2000 counts | High rate bins dominated by noise | Noise dominated (total time) | Noise dominated (detector-on time) | Marked lightcurve |
|---|---|---|---|---|---|---|---|
| A | 3382 | 3382 | 0 | 0 | 0.00% | 0.00% | 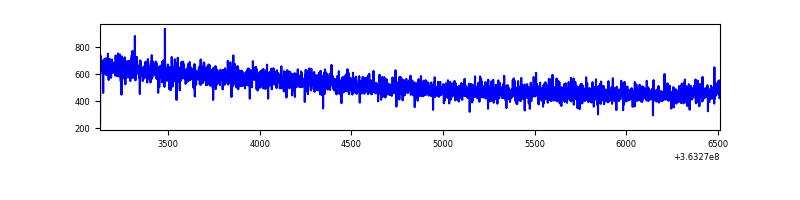 |
| B | 3382 | 3382 | 269 | 269 | 7.95% | 7.95% | 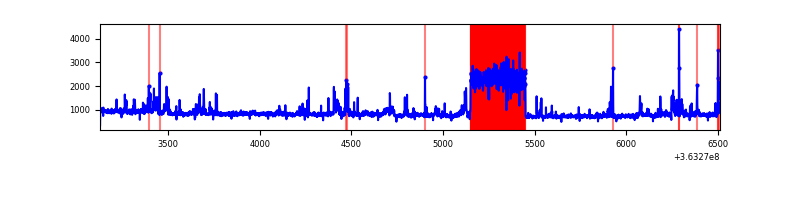 |
| C | 3382 | 3382 | 56 | 56 | 1.66% | 1.66% | 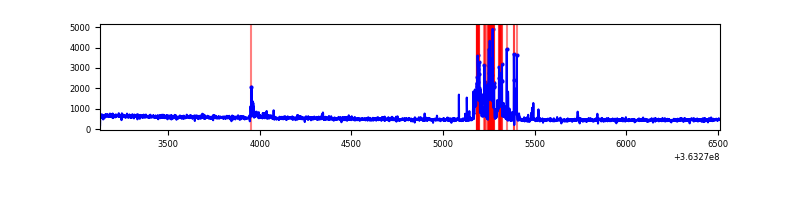 |
| D | 3383 | 3383 | 623 | 623 | 18.42% | 18.42% | 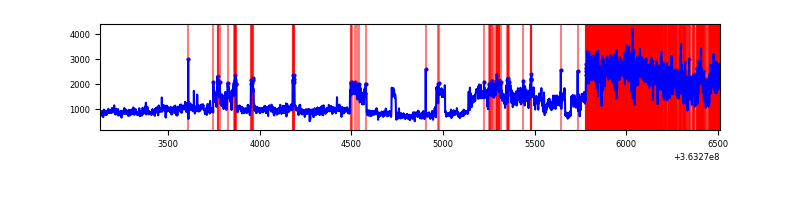 |
Top three noisy pixels from each quadrant. If the there are fewer than three noisy pixels in the level2.evt file, extra rows are filled as -1
| Pixel properties | Quadrant properties | ||||||
|---|---|---|---|---|---|---|---|
| Quadrant | DetID | PixID | Counts | Sigma | Mean | Median | Sigma |
| A | 13 | 254 | 6010 | 62.1 | 451 | 444 | 89.6 |
| A | 3 | 137 | 3923 | 38.82 | 451 | 444 | 89.6 |
| A | 0 | 226 | 3763 | 37.03 | 451 | 444 | 89.6 |
| B | 6 | 159 | 857155 | 10592.14 | 431 | 424 | 80.9 |
| B | 4 | 80 | 685721 | 8472.62 | 431 | 424 | 80.9 |
| B | 0 | 190 | 60256 | 739.73 | 431 | 424 | 80.9 |
| C | 10 | 22 | 263035 | 2728.96 | 416 | 419 | 96.2 |
| C | 14 | 238 | 71673 | 740.43 | 416 | 419 | 96.2 |
| C | 3 | 233 | 8474 | 83.7 | 416 | 419 | 96.2 |
| D | 8 | 195 | 3080686 | 29093.86 | 413 | 406 | 105.9 |
| D | 2 | 120 | 27454 | 255.47 | 413 | 406 | 105.9 |
| D | 2 | 234 | 15250 | 140.2 | 413 | 406 | 105.9 |
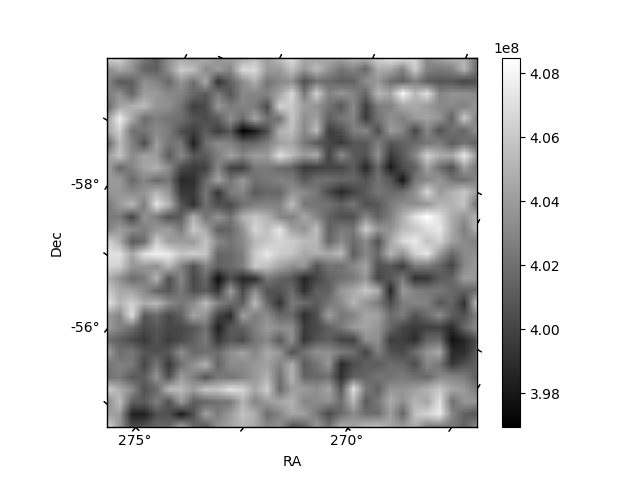
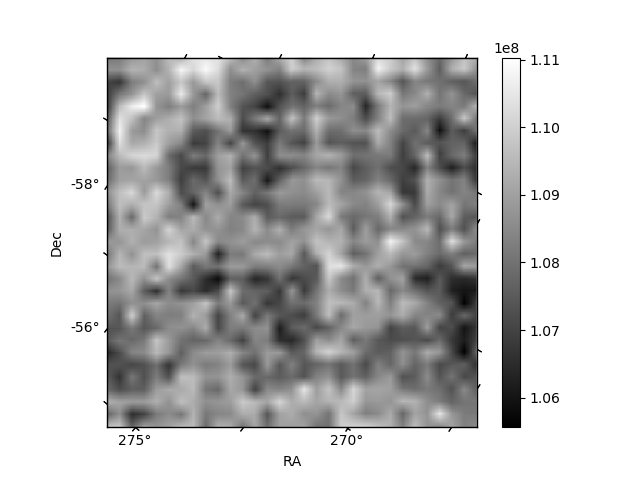
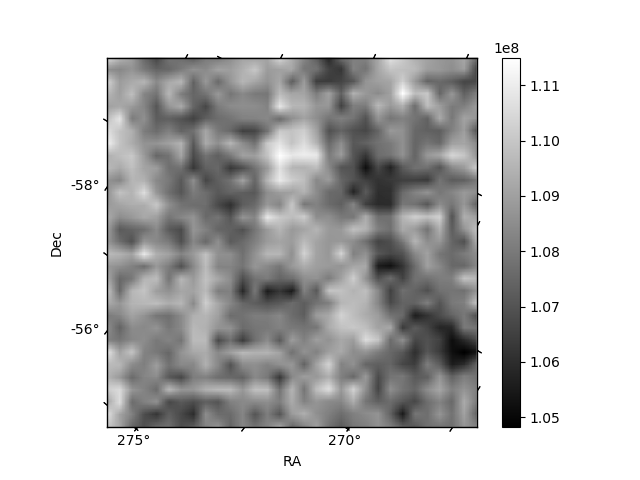
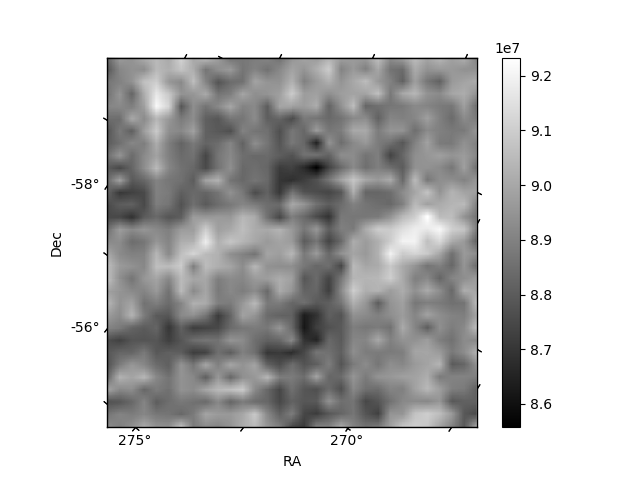
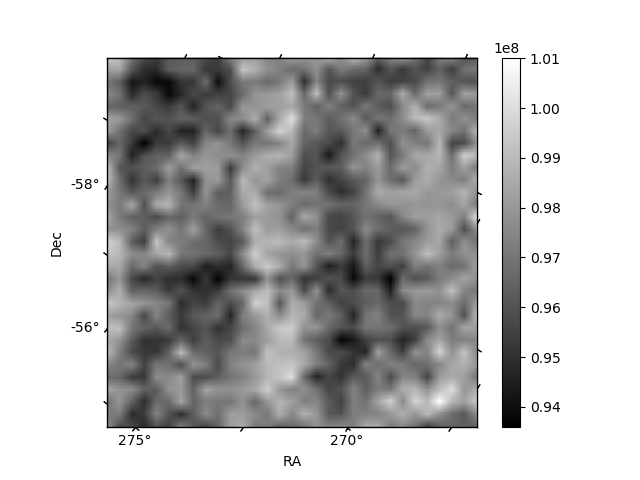
Histogram calculated using DETX and DETY for each event in the final _common_clean file
| Quadrant A | 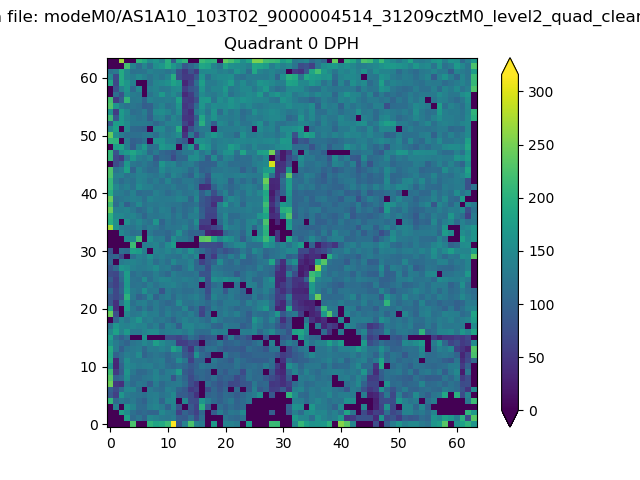 |
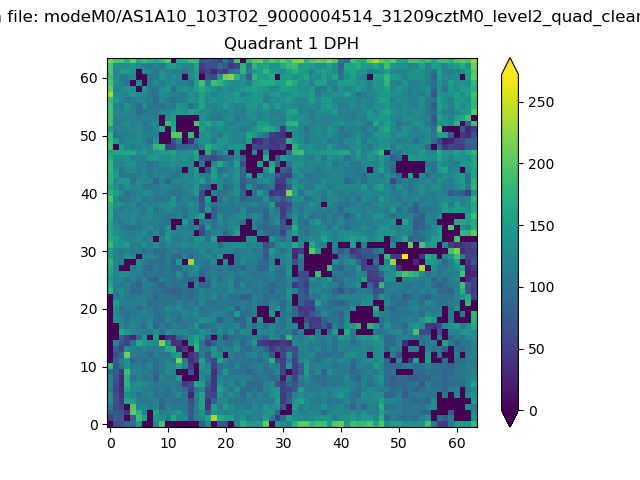 |
Quadrant B |
|---|---|---|---|
| Quadrant D | 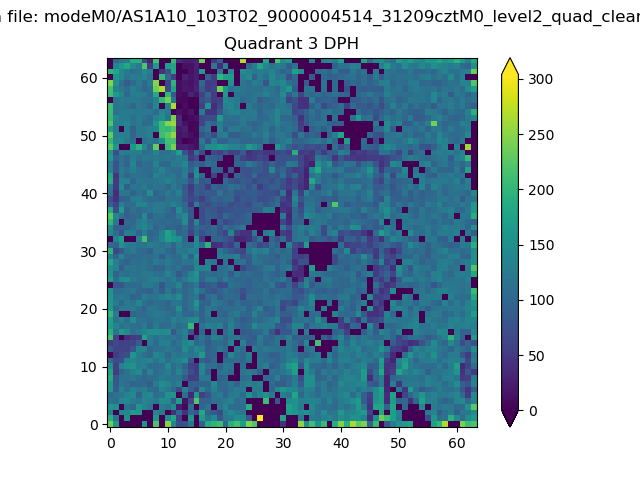 |
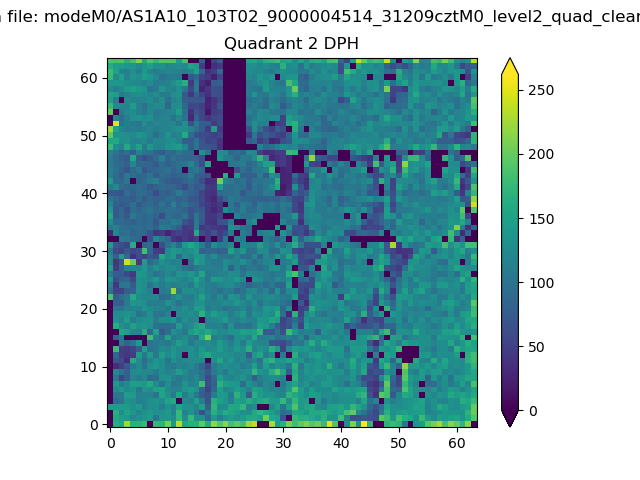 |
Quadrant C |
| Plot type | Count rate plots | Images |
|---|---|---|
| Comparison with Poisson distribution Blue bars denote a histogram of data divided into 1 sec bins. Red curve is a Poisson curve with rate = median count rate of data. |
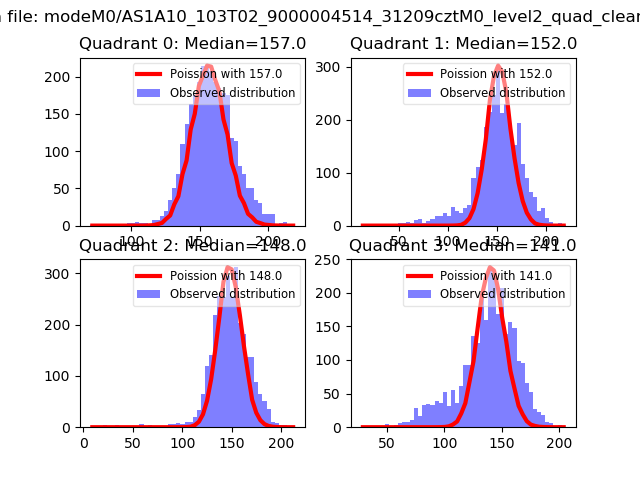 |
 |
| Quadrant-wise count rates Data is divided into 100 sec bins |
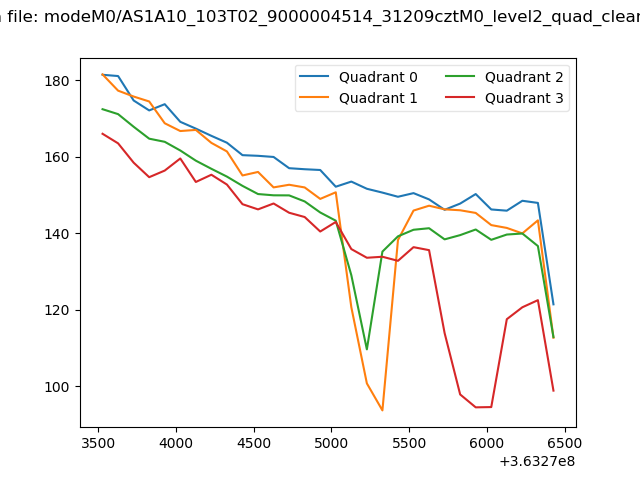 |
|
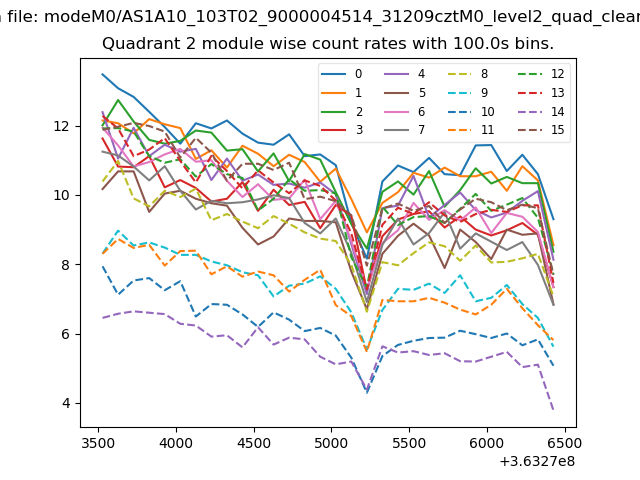
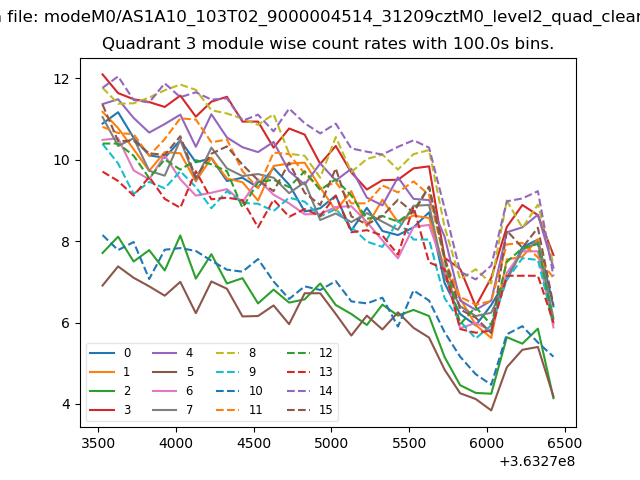
| Module-wise count rates for Quadrant A Data is divided into 100 sec bins |
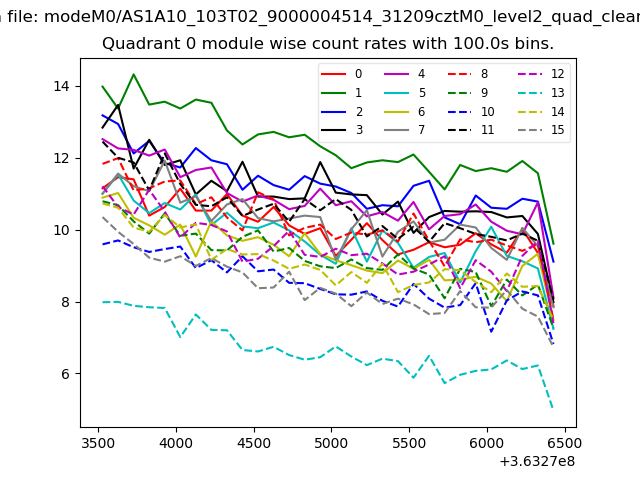 |
 |
| Module-wise count rates for Quadrant B Data is divided into 100 sec bins |
 |
 |
| Module-wise count rates for Quadrant C Data is divided into 100 sec bins |
 |
 |
| Module-wise count rates for Quadrant D Data is divided into 100 sec bins |
 |
 |
| Parameter | Plot |
|---|---|
| CZT HV Monitor | 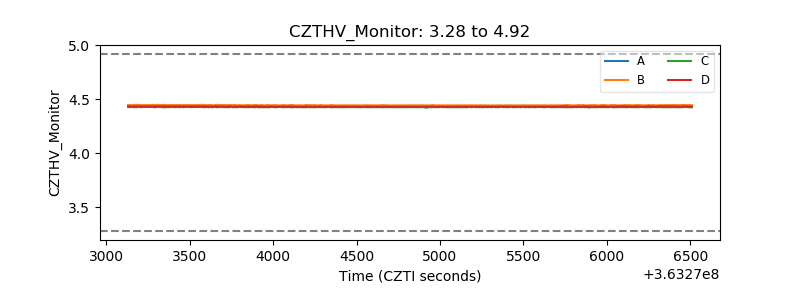 |
| D_VDD | 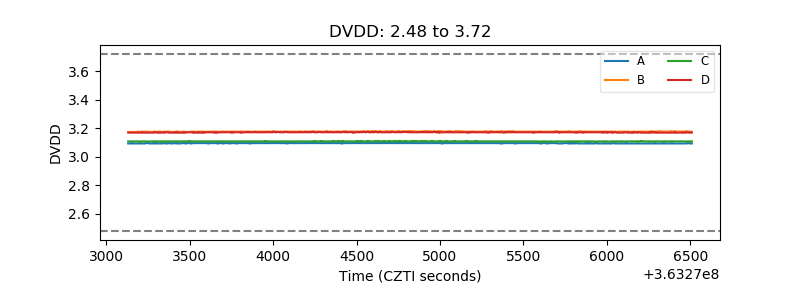 |
| Temperature 1 | 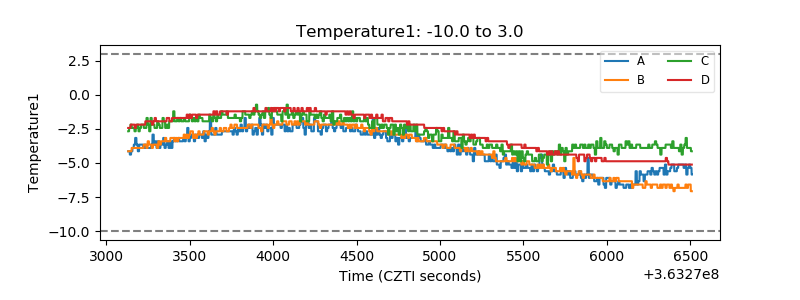 |
| Veto HV Monitor | 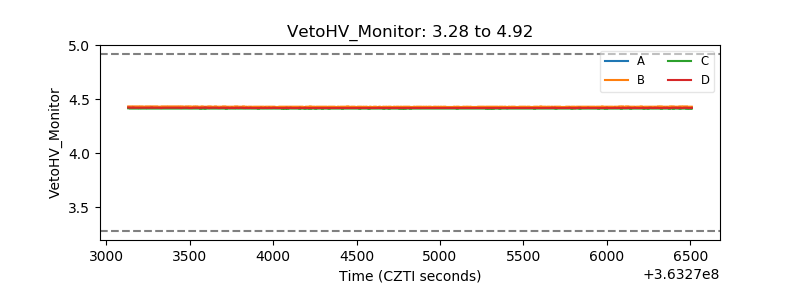 |
| Veto LLD | 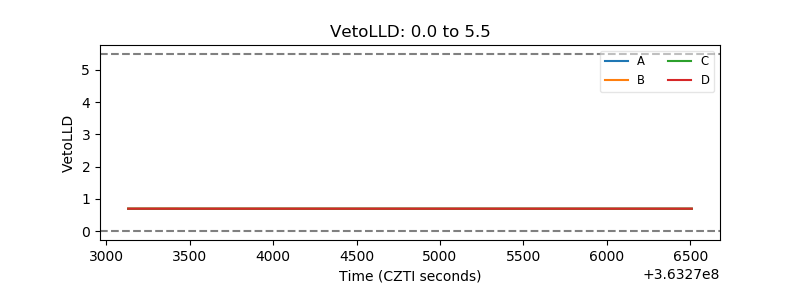 |
| Alpha Counter | 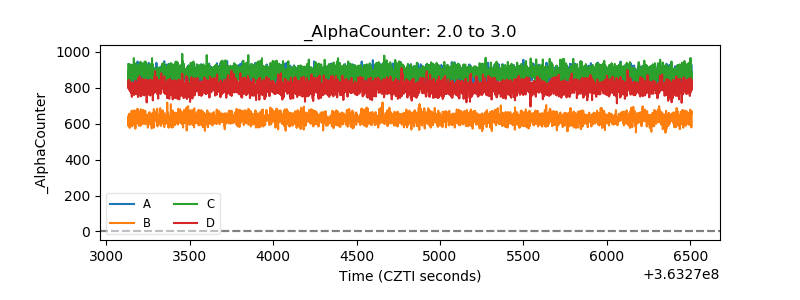 |
| _CPM_Rate | 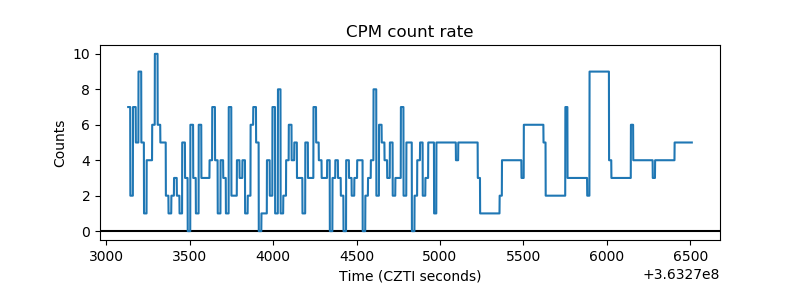 |
| CZT Counter | 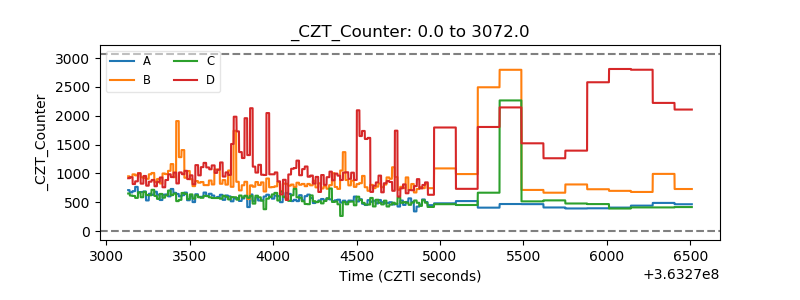 |
| +2.5 Volts monitor | 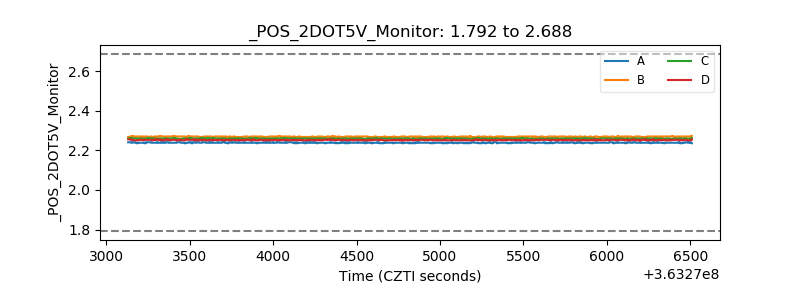 |
| +5 Volts monitor |  |
| _ROLL_ROT | 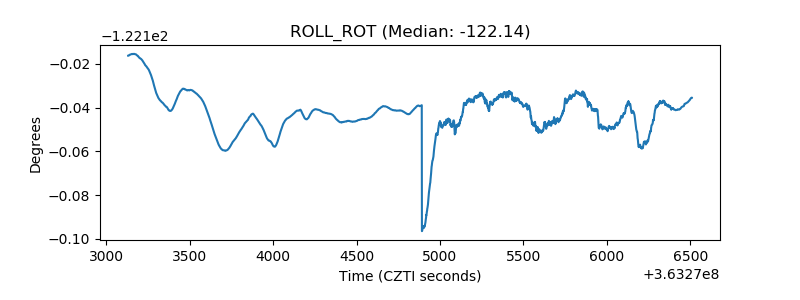 |
| _Roll_DEC | 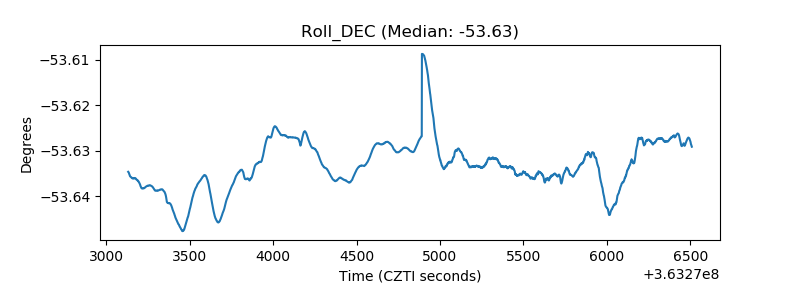 |
| _Roll_RA | 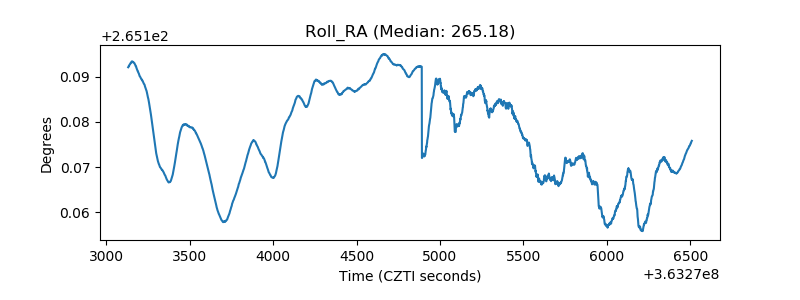 |
| Veto Counter | 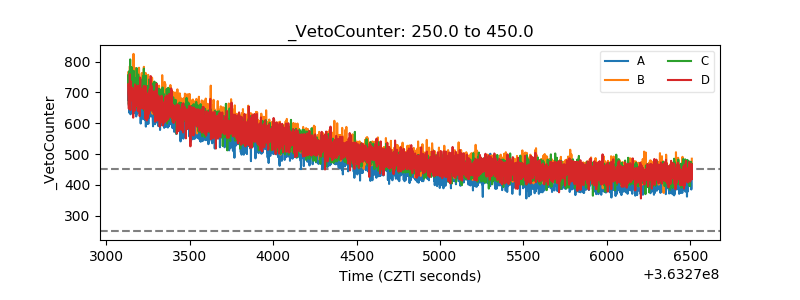 |