| Param | Original file | Final file |
|---|---|---|
| Filename | modeM0/AS1T04_019T01_9000004516cztM0_level2.fits | modeM0/AS1T04_019T01_9000004516cztM0_level2_quad_clean.evt |
| Size (bytes) | 497,419,200 | 456,240,960 |
| Size | 474.4 MB | 435.1 MB |
| Events in quadrant A | 3,108,216 | 2,733,914 |
| Events in quadrant B | 2,898,464 | 2,688,969 |
| Events in quadrant C | 2,976,732 | 2,569,184 |
| Events in quadrant D | 2,623,048 | 2,367,166 |
| Mode SS | |||
|---|---|---|---|
| Quadrant | BADHDUFLAG | Total packets | Discarded packets |
| A | 0 | 1028 | 0 |
| B | 0 | 1028 | 0 |
| C | 0 | 1028 | 0 |
| D | 0 | 1028 | 0 |
| Mode M9 | |||
|---|---|---|---|
| Quadrant | BADHDUFLAG | Total packets | Discarded packets |
| A | 0 | 55 | 0 |
| B | 0 | 55 | 0 |
| C | 0 | 55 | 0 |
| D | 0 | 55 | 0 |
| Mode M0 | |||
|---|---|---|---|
| Quadrant | BADHDUFLAG | Total packets | Discarded packets |
| A | 0 | 104863 | 0 |
| B | 0 | 153631 | 0 |
| C | 0 | 110340 | 0 |
| D | 0 | 162270 | 0 |
| Quadrant | Total seconds | Saturated seconds | Saturation percentage |
|---|---|---|---|
| A | 50364 | 691 | 1.372012% |
| B | 50364 | 1515 | 3.008101% |
| C | 50364 | 1577 | 3.131205% |
| D | 50364 | 1555 | 3.087523% |
Noise dominated data is calculated using 1-second bins in cleaned event files. If a bin has >2000 counts, and if more than 50% of those come from <1% of pixels, then it is considered to be noise-dominated and hence unusable.
| Quadrant | # 1 sec bins | Bins with >0 counts | Bins with >2000 counts | High rate bins dominated by noise | Noise dominated (total time) | Noise dominated (detector-on time) | Marked lightcurve |
|---|---|---|---|---|---|---|---|
| A | 55023 | 50362 | 0 | 0 | 0.00% | 0.00% |  |
| B | 55023 | 50360 | 0 | 0 | 0.00% | 0.00% |  |
| C | 55023 | 50359 | 0 | 0 | 0.00% | 0.00% |  |
| D | 55023 | 50361 | 0 | 0 | 0.00% | 0.00% |  |
Top three noisy pixels from each quadrant. If the there are fewer than three noisy pixels in the level2.evt file, extra rows are filled as -1
| Pixel properties | Quadrant properties | ||||||
|---|---|---|---|---|---|---|---|
| Quadrant | DetID | PixID | Counts | Sigma | Mean | Median | Sigma |
| A | 0 | 29 | 3016 | 11.31 | 809 | 757 | 199.7 |
| A | 7 | 110 | 2398 | 8.22 | 809 | 757 | 199.7 |
| A | 0 | 30 | 2375 | 8.1 | 809 | 757 | 199.7 |
| B | 2 | 9 | 2356 | 10.65 | 763 | 726 | 153.0 |
| B | 5 | 232 | 1937 | 7.91 | 763 | 726 | 153.0 |
| B | 2 | 8 | 1925 | 7.83 | 763 | 726 | 153.0 |
| C | 1 | 81 | 2258 | 7.58 | 788 | 738 | 200.4 |
| C | 1 | 80 | 2221 | 7.4 | 788 | 738 | 200.4 |
| C | 12 | 241 | 2136 | 6.97 | 788 | 738 | 200.4 |
| D | 15 | 47 | 1866 | 5.92 | 748 | 683 | 199.9 |
| D | 15 | 63 | 1850 | 5.84 | 748 | 683 | 199.9 |
| D | 12 | 6 | 1846 | 5.82 | 748 | 683 | 199.9 |
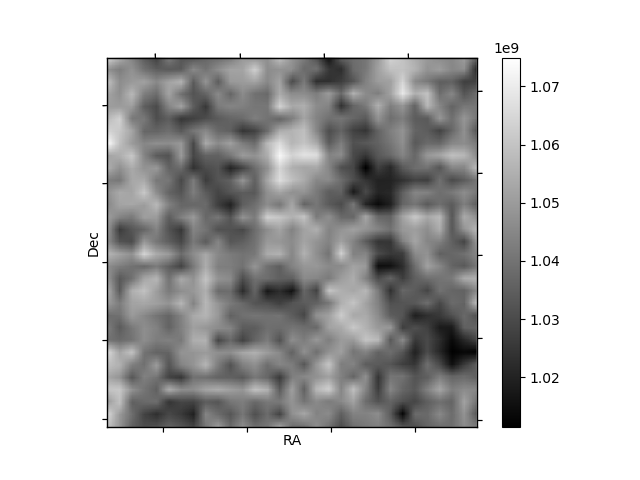
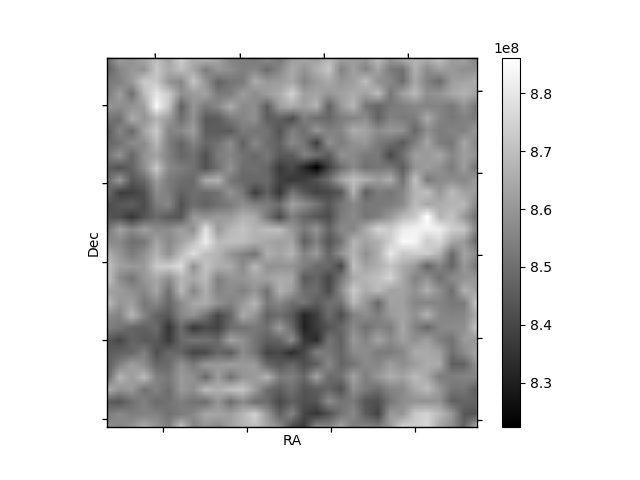
Histogram calculated using DETX and DETY for each event in the final _common_clean file
| Quadrant A |  |
 |
Quadrant B |
|---|---|---|---|
| Quadrant D |  |
 |
Quadrant C |
| Plot type | Count rate plots | Images |
|---|---|---|
| Comparison with Poisson distribution Blue bars denote a histogram of data divided into 1 sec bins. Red curve is a Poisson curve with rate = median count rate of data. |
 |
 |
| Quadrant-wise count rates Data is divided into 100 sec bins |
 |
|
| Module-wise count rates for Quadrant A Data is divided into 100 sec bins |
 |
 |
| Module-wise count rates for Quadrant B Data is divided into 100 sec bins |
 |
 |
| Module-wise count rates for Quadrant C Data is divided into 100 sec bins |
 |
 |
| Module-wise count rates for Quadrant D Data is divided into 100 sec bins |
 |
 |
| Parameter | Plot |
|---|---|
| CZT HV Monitor |  |
| D_VDD |  |
| Temperature 1 |  |
| Veto HV Monitor |  |
| Veto LLD |  |
| Alpha Counter |  |
| _CPM_Rate | 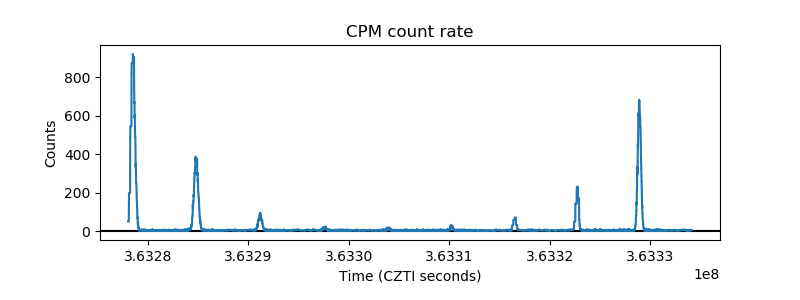 |
| CZT Counter |  |
| +2.5 Volts monitor |  |
| +5 Volts monitor |  |
| _ROLL_ROT | 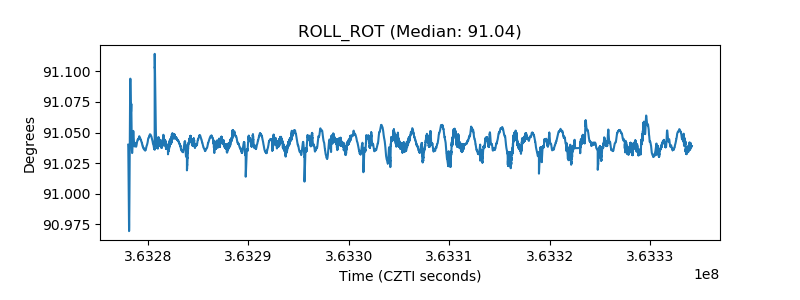 |
| _Roll_DEC | 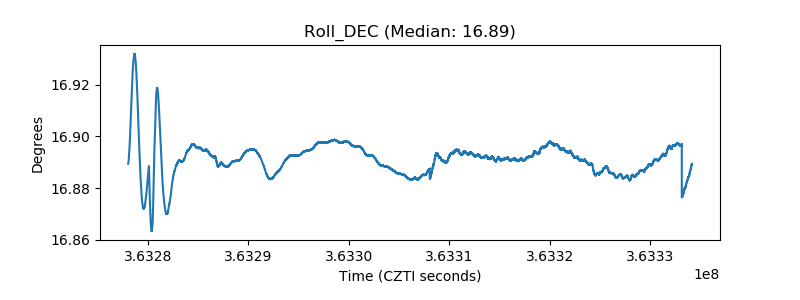 |
| _Roll_RA |  |
| Veto Counter |  |