| Param | Original file | Final file |
|---|---|---|
| Filename | modeM0/AS1T04_019T01_9000004516_31210cztM0_level2.evt | modeM0/AS1T04_019T01_9000004516_31210cztM0_level2_quad_clean.evt |
| Size (bytes) | 626,947,200 | 102,821,760 |
| Size | 597.9 MB | 98.1 MB |
| Events in quadrant A | 3,335,757 | 690,863 |
| Events in quadrant B | 5,358,145 | 685,074 |
| Events in quadrant C | 3,472,451 | 663,480 |
| Events in quadrant D | 6,388,992 | 628,561 |
| Mode SS | |||
|---|---|---|---|
| Quadrant | BADHDUFLAG | Total packets | Discarded packets |
| A | 0 | 128 | 0 |
| B | 0 | 128 | 0 |
| C | 0 | 128 | 0 |
| D | 0 | 128 | 0 |
| Mode M9 | |||
|---|---|---|---|
| Quadrant | BADHDUFLAG | Total packets | Discarded packets |
| A | 0 | 11 | 0 |
| B | 0 | 11 | 0 |
| C | 0 | 11 | 0 |
| D | 0 | 11 | 0 |
| Mode M0 | |||
|---|---|---|---|
| Quadrant | BADHDUFLAG | Total packets | Discarded packets |
| A | 0 | 13747 | 1 |
| B | 0 | 19904 | 1 |
| C | 0 | 14154 | 1 |
| D | 0 | 23567 | 1 |
| Quadrant | Total seconds | Saturated seconds | Saturation percentage |
|---|---|---|---|
| A | 6396 | 110 | 1.719825% |
| B | 6397 | 258 | 4.033141% |
| C | 6397 | 197 | 3.079569% |
| D | 6397 | 521 | 8.144443% |
Noise dominated data is calculated using 1-second bins in cleaned event files. If a bin has >2000 counts, and if more than 50% of those come from <1% of pixels, then it is considered to be noise-dominated and hence unusable.
| Quadrant | # 1 sec bins | Bins with >0 counts | Bins with >2000 counts | High rate bins dominated by noise | Noise dominated (total time) | Noise dominated (detector-on time) | Marked lightcurve |
|---|---|---|---|---|---|---|---|
| A | 7481 | 6397 | 0 | 0 | 0.00% | 0.00% | 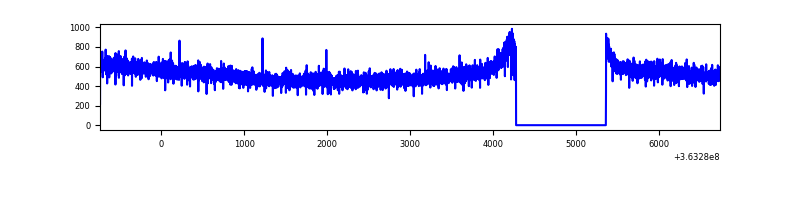 |
| B | 7482 | 6398 | 13 | 13 | 0.17% | 0.20% | 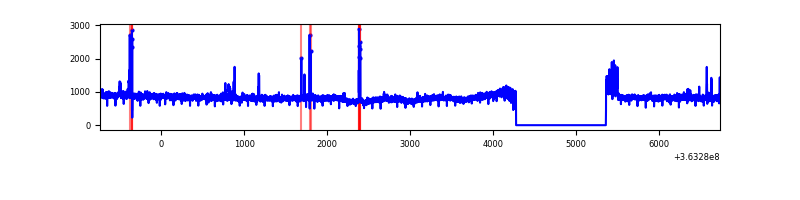 |
| C | 7482 | 6398 | 0 | 0 | 0.00% | 0.00% | 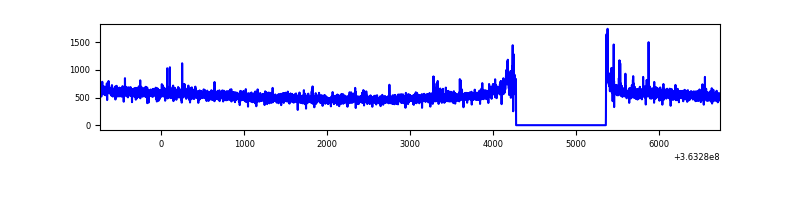 |
| D | 7482 | 6398 | 326 | 326 | 4.36% | 5.10% | 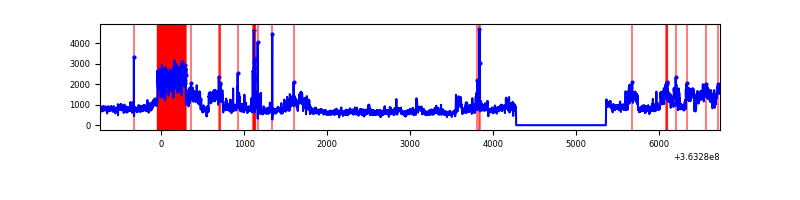 |
Top three noisy pixels from each quadrant. If the there are fewer than three noisy pixels in the level2.evt file, extra rows are filled as -1
| Pixel properties | Quadrant properties | ||||||
|---|---|---|---|---|---|---|---|
| Quadrant | DetID | PixID | Counts | Sigma | Mean | Median | Sigma |
| A | 13 | 254 | 10815 | 57.72 | 865 | 851 | 172.6 |
| A | 3 | 137 | 8442 | 43.97 | 865 | 851 | 172.6 |
| A | 0 | 226 | 7090 | 36.14 | 865 | 851 | 172.6 |
| B | 6 | 159 | 1887984 | 11815.38 | 844 | 826 | 159.7 |
| B | 0 | 190 | 89442 | 554.82 | 844 | 826 | 159.7 |
| B | 4 | 80 | 55043 | 339.45 | 844 | 826 | 159.7 |
| C | 14 | 238 | 134328 | 688.41 | 834 | 843 | 193.9 |
| C | 10 | 22 | 38587 | 194.65 | 834 | 843 | 193.9 |
| C | 2 | 114 | 14883 | 72.41 | 834 | 843 | 193.9 |
| D | 8 | 195 | 3119974 | 16157.02 | 827 | 812 | 193.1 |
| D | 11 | 176 | 101315 | 520.6 | 827 | 812 | 193.1 |
| D | 12 | 79 | 29307 | 147.6 | 827 | 812 | 193.1 |
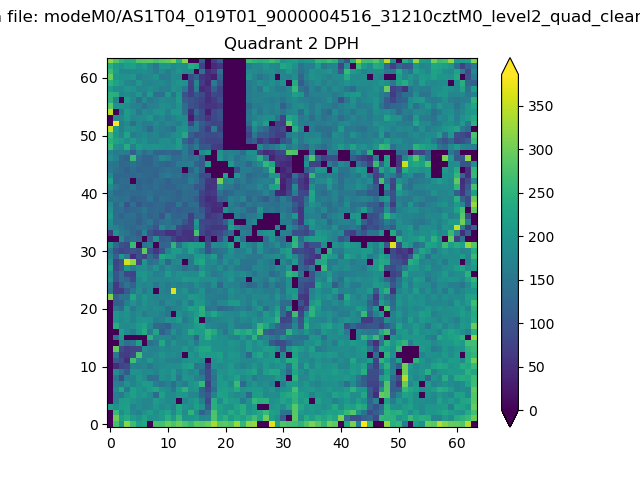
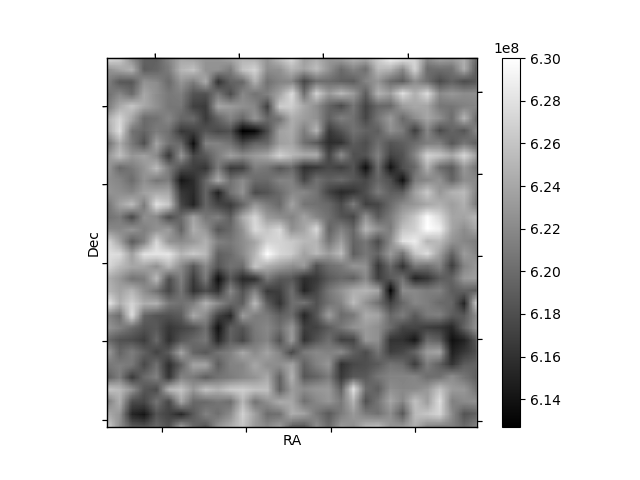
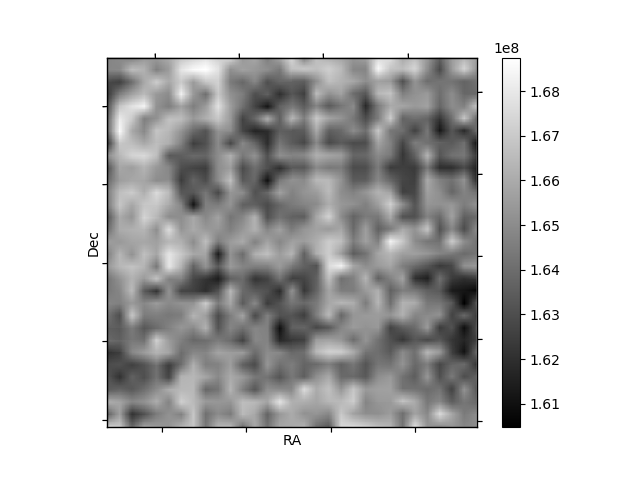
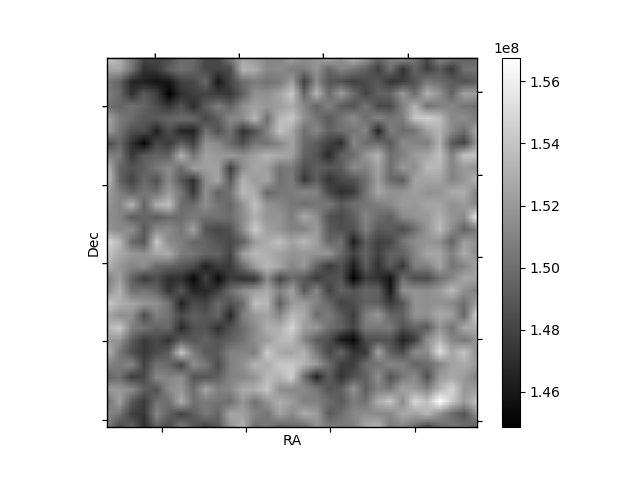
Histogram calculated using DETX and DETY for each event in the final _common_clean file
| Quadrant A | 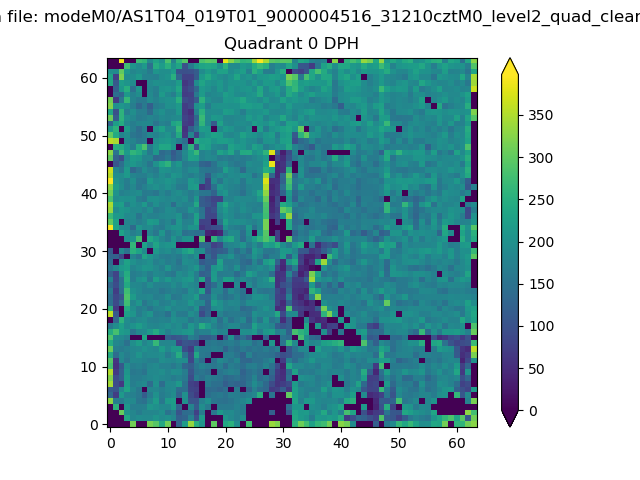 |
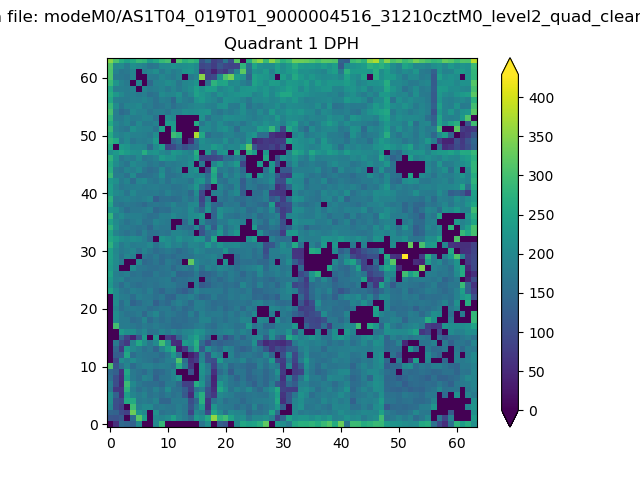 |
Quadrant B |
|---|---|---|---|
| Quadrant D | 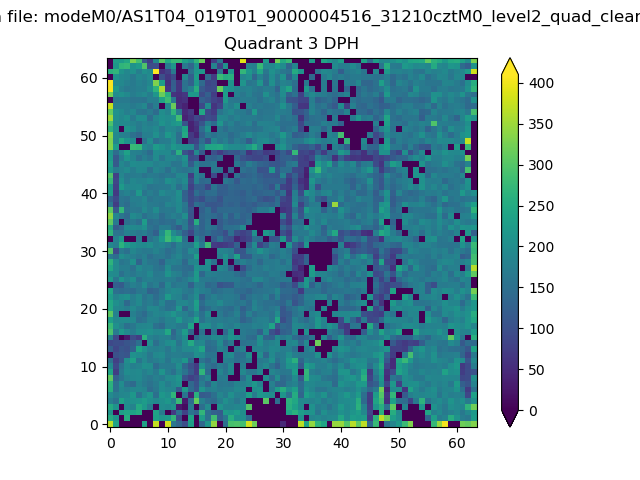 |
 |
Quadrant C |
| Plot type | Count rate plots | Images |
|---|---|---|
| Comparison with Poisson distribution Blue bars denote a histogram of data divided into 1 sec bins. Red curve is a Poisson curve with rate = median count rate of data. |
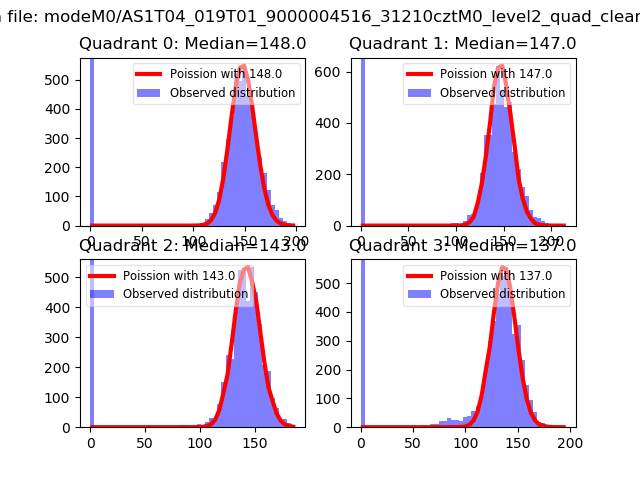 |
 |
| Quadrant-wise count rates Data is divided into 100 sec bins |
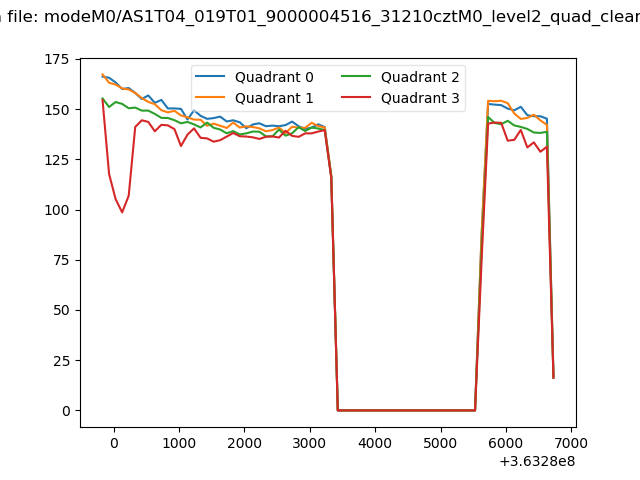 |
|
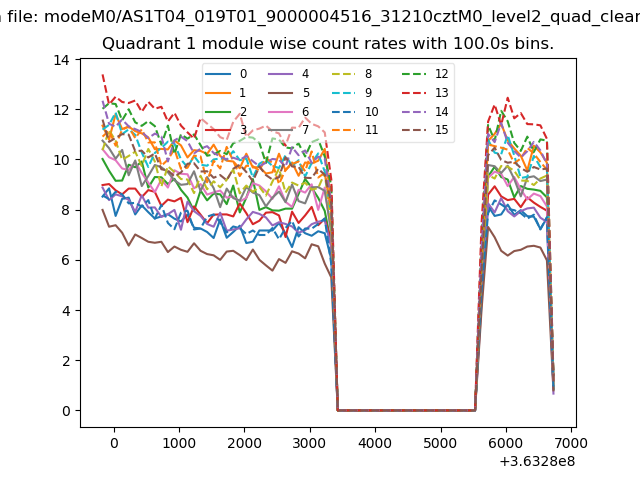
| Module-wise count rates for Quadrant A Data is divided into 100 sec bins |
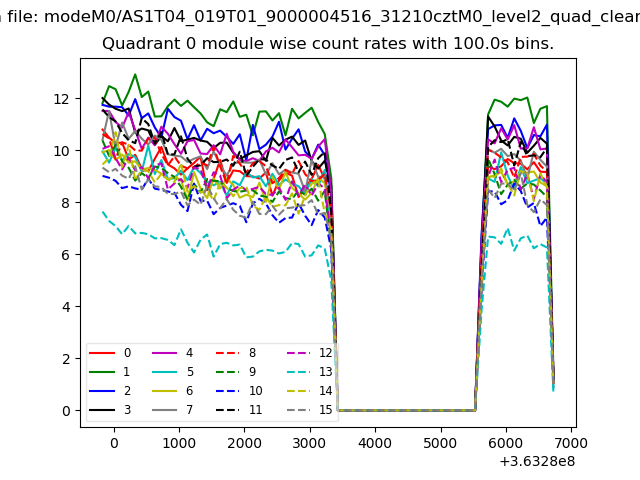 |
 |
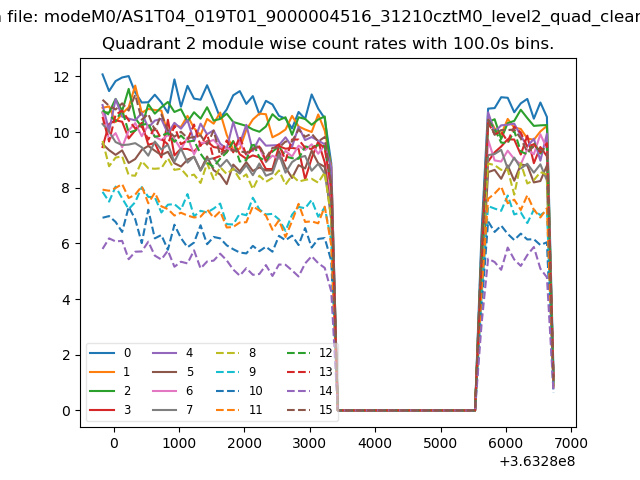
| Module-wise count rates for Quadrant B Data is divided into 100 sec bins |
 |
 |
| Module-wise count rates for Quadrant C Data is divided into 100 sec bins |
 |
 |
| Module-wise count rates for Quadrant D Data is divided into 100 sec bins |
 |
 |
| Parameter | Plot |
|---|---|
| CZT HV Monitor | 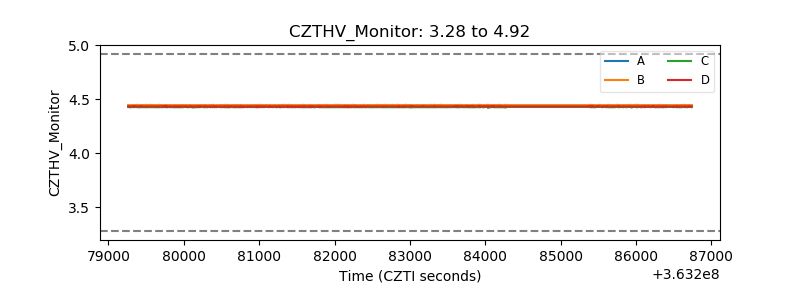 |
| D_VDD | 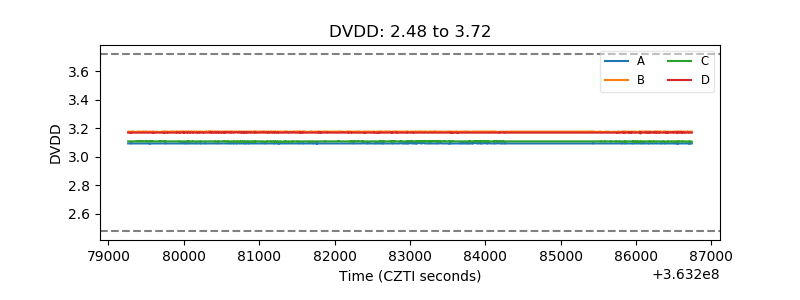 |
| Temperature 1 | 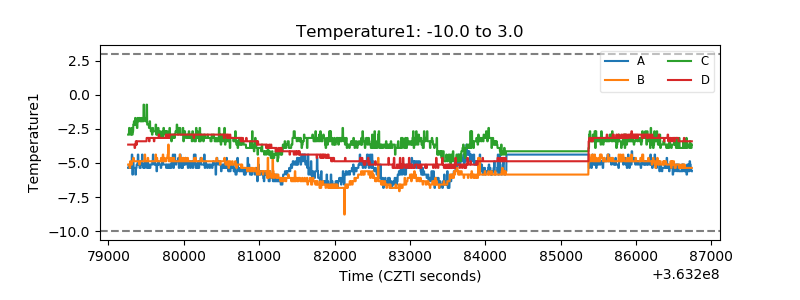 |
| Veto HV Monitor | 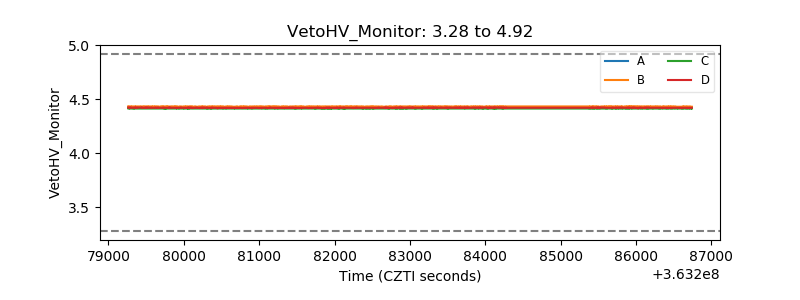 |
| Veto LLD | 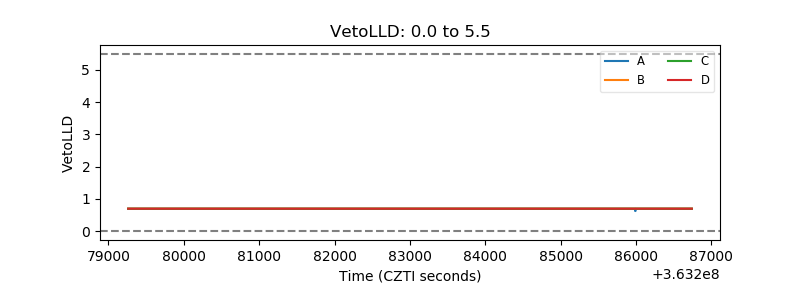 |
| Alpha Counter | 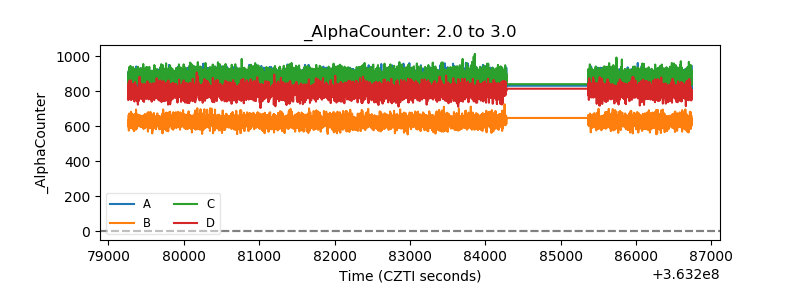 |
| _CPM_Rate | 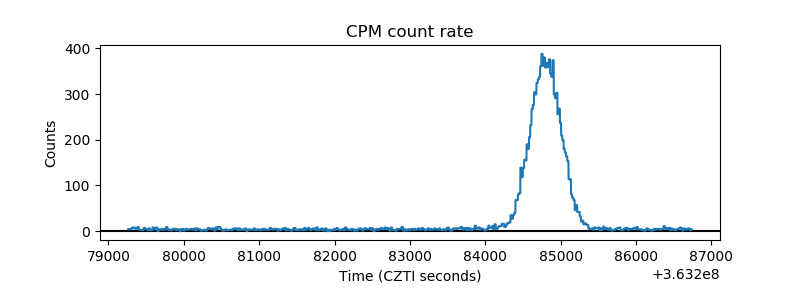 |
| CZT Counter | 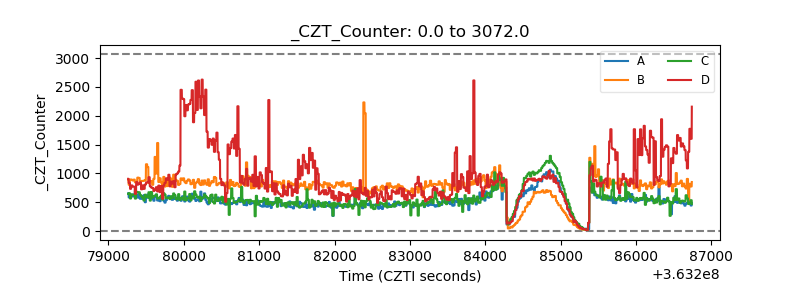 |
| +2.5 Volts monitor |  |
| +5 Volts monitor |  |
| _ROLL_ROT |  |
| _Roll_DEC |  |
| _Roll_RA | 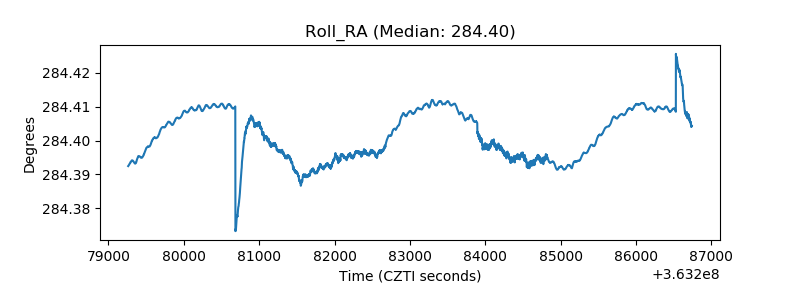 |
| Veto Counter | 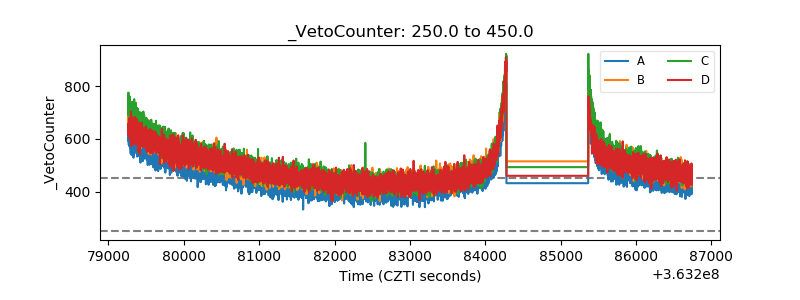 |