| Param | Original file | Final file |
|---|---|---|
| Filename | modeM0/AS1T04_019T01_9000004516_31212cztM0_level2.evt | modeM0/AS1T04_019T01_9000004516_31212cztM0_level2_quad_clean.evt |
| Size (bytes) | 686,246,400 | 109,319,040 |
| Size | 654.5 MB | 104.3 MB |
| Events in quadrant A | 3,783,800 | 716,532 |
| Events in quadrant B | 6,096,038 | 708,027 |
| Events in quadrant C | 4,080,656 | 685,620 |
| Events in quadrant D | 6,314,168 | 676,703 |
| Mode SS | |||
|---|---|---|---|
| Quadrant | BADHDUFLAG | Total packets | Discarded packets |
| A | 0 | 154 | 0 |
| B | 0 | 154 | 0 |
| C | 0 | 154 | 0 |
| D | 0 | 154 | 0 |
| Mode M9 | |||
|---|---|---|---|
| Quadrant | BADHDUFLAG | Total packets | Discarded packets |
| A | 0 | 6 | 0 |
| B | 0 | 7 | 0 |
| C | 0 | 7 | 0 |
| D | 0 | 7 | 0 |
| Mode M0 | |||
|---|---|---|---|
| Quadrant | BADHDUFLAG | Total packets | Discarded packets |
| A | 0 | 16048 | 2 |
| B | 0 | 23198 | 2 |
| C | 0 | 16786 | 2 |
| D | 0 | 24388 | 4 |
| Quadrant | Total seconds | Saturated seconds | Saturation percentage |
|---|---|---|---|
| A | 7518 | 222 | 2.952913% |
| B | 7518 | 404 | 5.373770% |
| C | 7518 | 415 | 5.520085% |
| D | 7517 | 280 | 3.724890% |
Noise dominated data is calculated using 1-second bins in cleaned event files. If a bin has >2000 counts, and if more than 50% of those come from <1% of pixels, then it is considered to be noise-dominated and hence unusable.
| Quadrant | # 1 sec bins | Bins with >0 counts | Bins with >2000 counts | High rate bins dominated by noise | Noise dominated (total time) | Noise dominated (detector-on time) | Marked lightcurve |
|---|---|---|---|---|---|---|---|
| A | 7778 | 7519 | 0 | 0 | 0.00% | 0.00% | 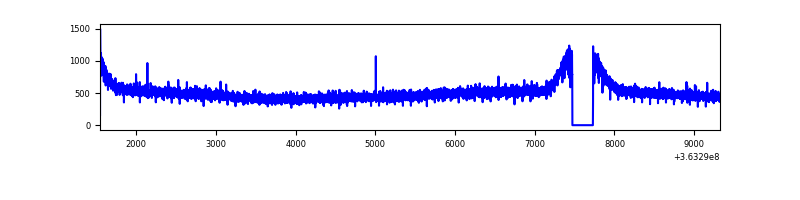 |
| B | 7778 | 7519 | 0 | 0 | 0.00% | 0.00% | 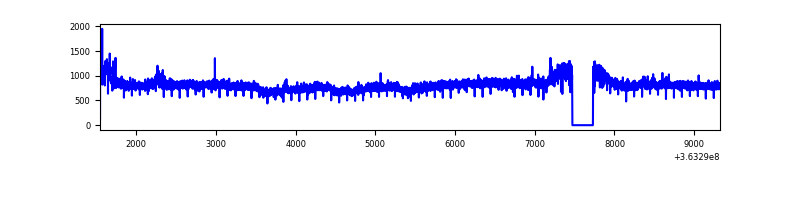 |
| C | 7778 | 7519 | 10 | 10 | 0.13% | 0.13% | 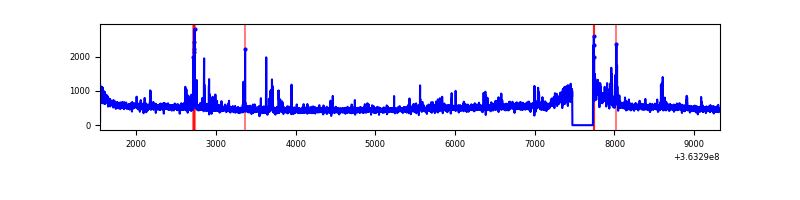 |
| D | 7777 | 7518 | 1 | 1 | 0.01% | 0.01% | 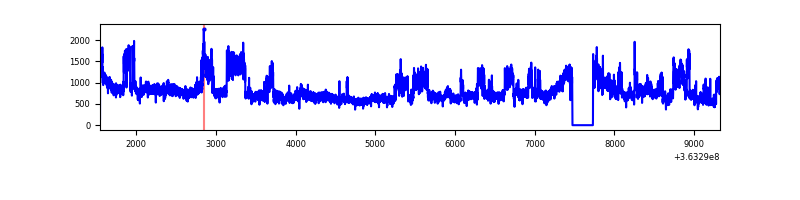 |
Top three noisy pixels from each quadrant. If the there are fewer than three noisy pixels in the level2.evt file, extra rows are filled as -1
| Pixel properties | Quadrant properties | ||||||
|---|---|---|---|---|---|---|---|
| Quadrant | DetID | PixID | Counts | Sigma | Mean | Median | Sigma |
| A | 13 | 254 | 10600 | 48.92 | 981 | 960 | 197.1 |
| A | 3 | 137 | 10198 | 46.88 | 981 | 960 | 197.1 |
| A | 0 | 226 | 8103 | 36.25 | 981 | 960 | 197.1 |
| B | 6 | 159 | 2265306 | 12020.77 | 955 | 931 | 188.4 |
| B | 0 | 230 | 42412 | 220.21 | 955 | 931 | 188.4 |
| B | 0 | 190 | 27547 | 141.29 | 955 | 931 | 188.4 |
| C | 14 | 238 | 171549 | 762.12 | 940 | 949 | 223.9 |
| C | 10 | 22 | 159606 | 708.76 | 940 | 949 | 223.9 |
| C | 14 | 254 | 36238 | 157.65 | 940 | 949 | 223.9 |
| D | 8 | 195 | 2646817 | 11680.12 | 952 | 933 | 226.5 |
| D | 2 | 72 | 30129 | 128.88 | 952 | 933 | 226.5 |
| D | 2 | 234 | 27031 | 115.21 | 952 | 933 | 226.5 |
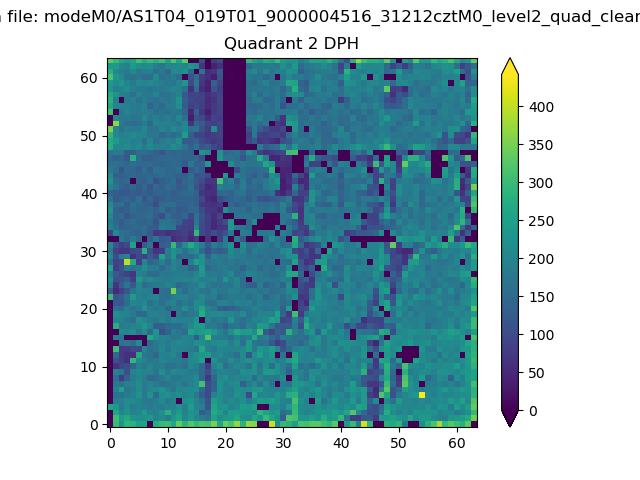
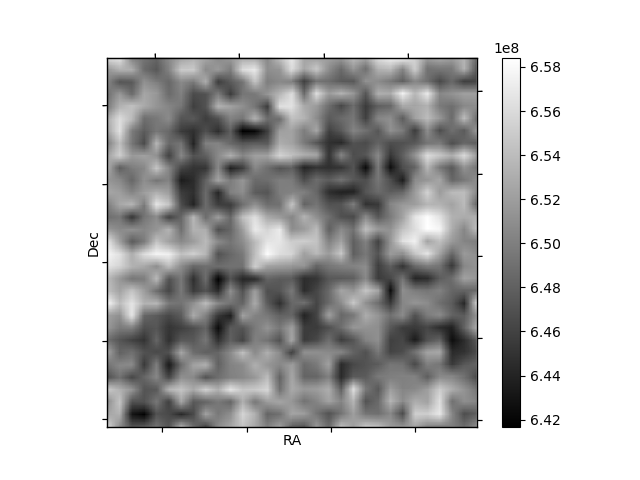
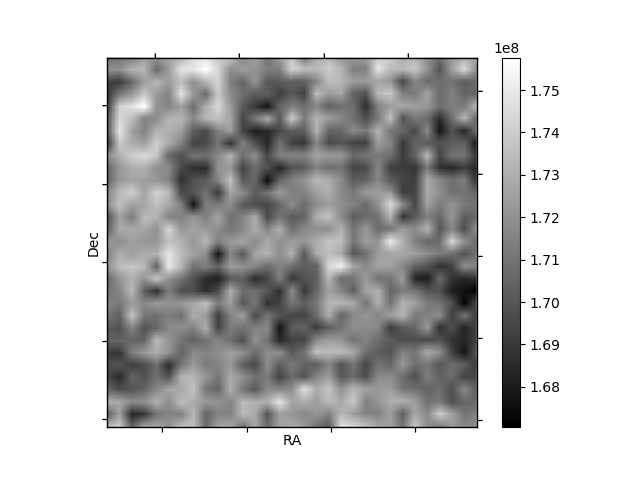
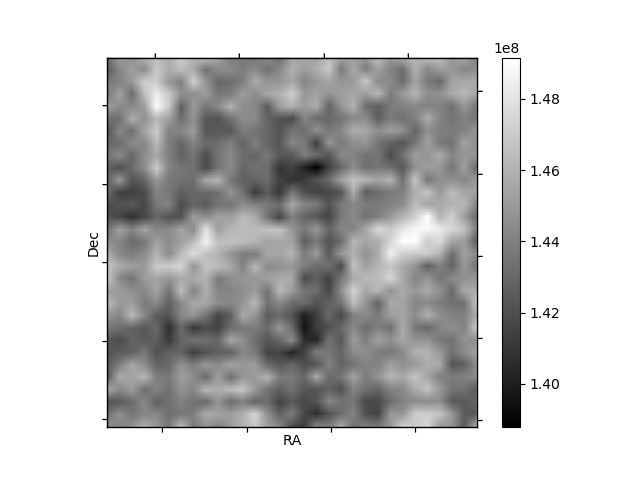
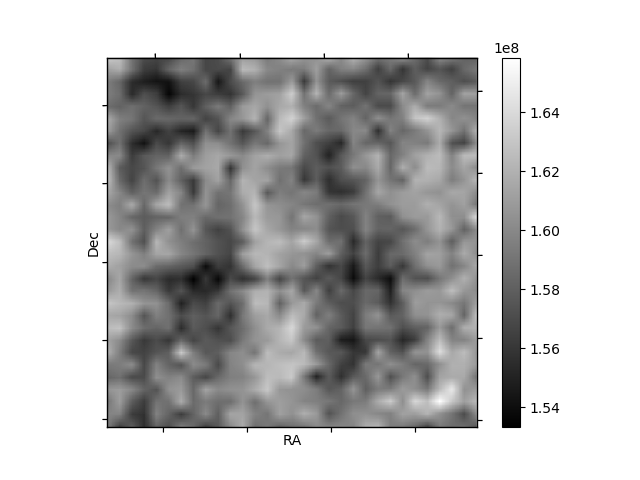
Histogram calculated using DETX and DETY for each event in the final _common_clean file
| Quadrant A | 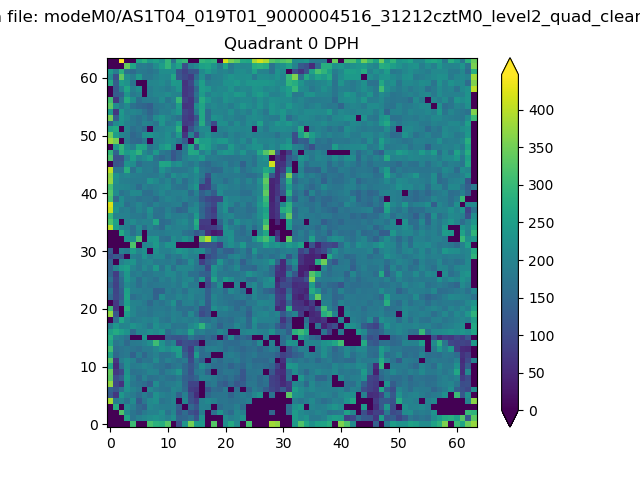 |
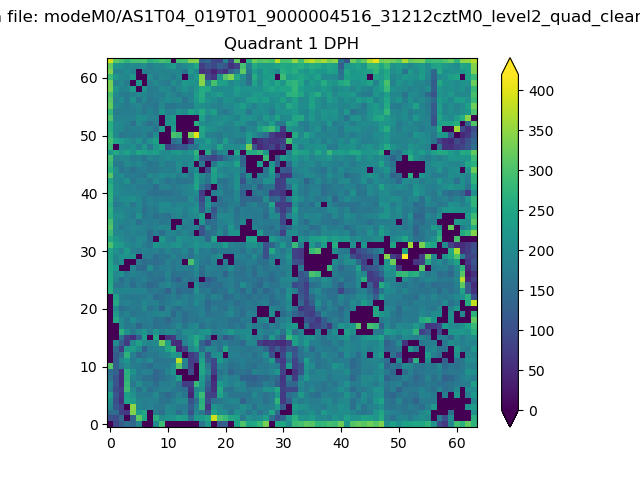 |
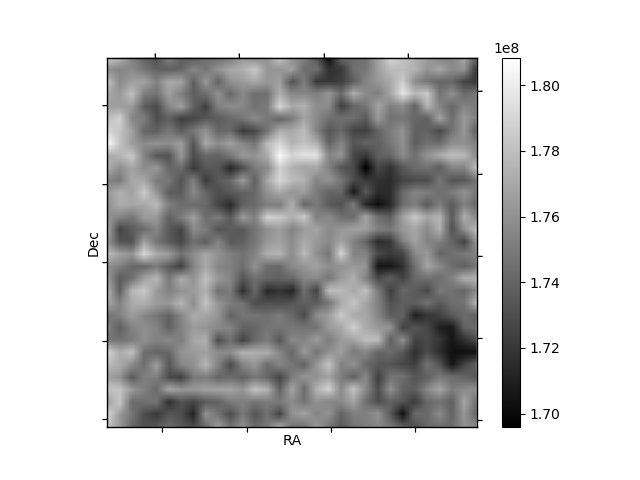
Quadrant B |
|---|---|---|---|
| Quadrant D | 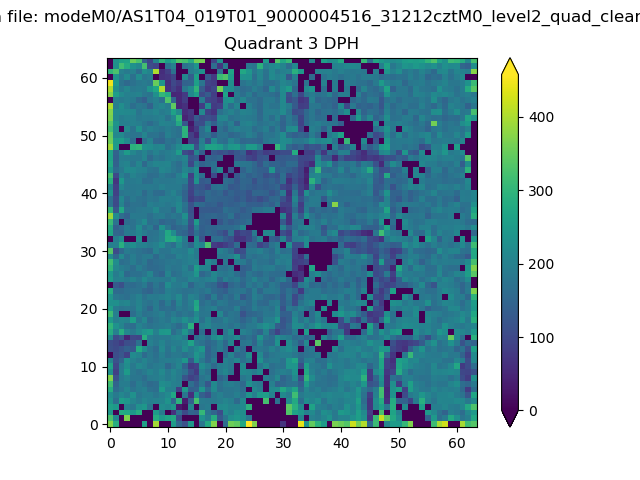 |
 |
Quadrant C |
| Plot type | Count rate plots | Images |
|---|---|---|
| Comparison with Poisson distribution Blue bars denote a histogram of data divided into 1 sec bins. Red curve is a Poisson curve with rate = median count rate of data. |
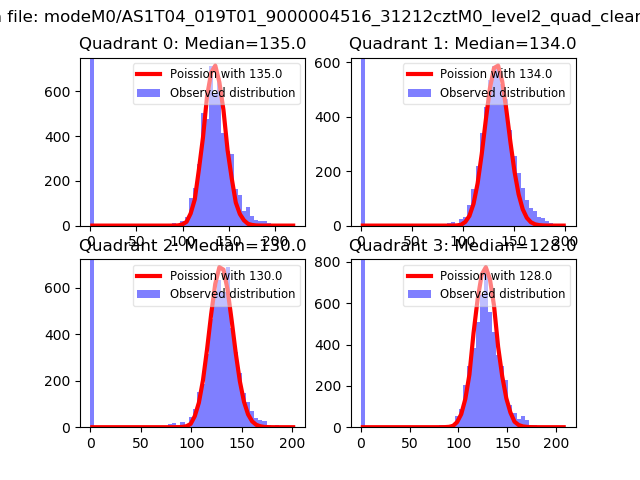 |
 |
| Quadrant-wise count rates Data is divided into 100 sec bins |
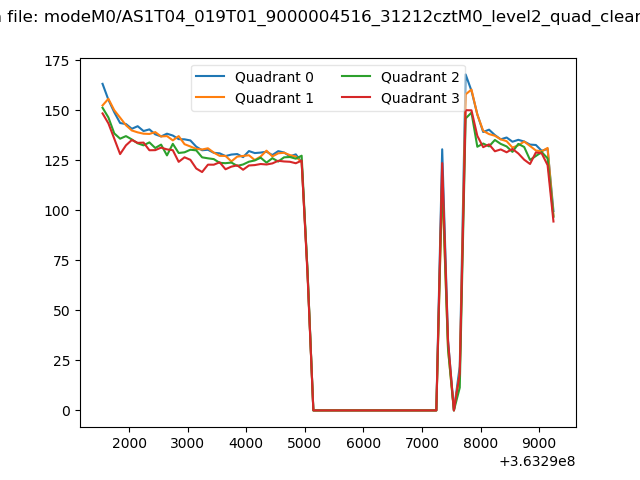 |
|
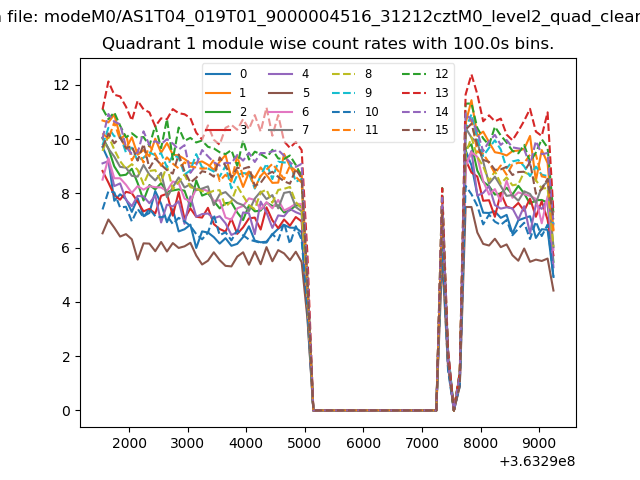
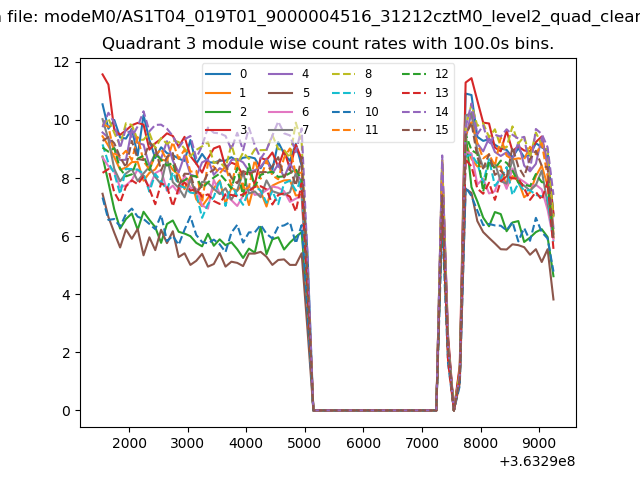
| Module-wise count rates for Quadrant A Data is divided into 100 sec bins |
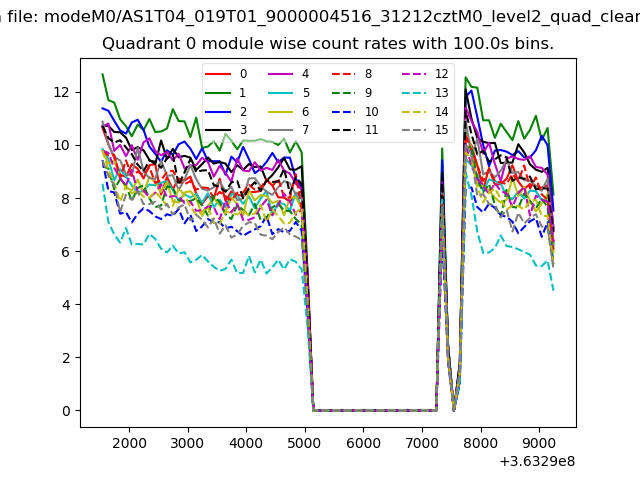 |
 |
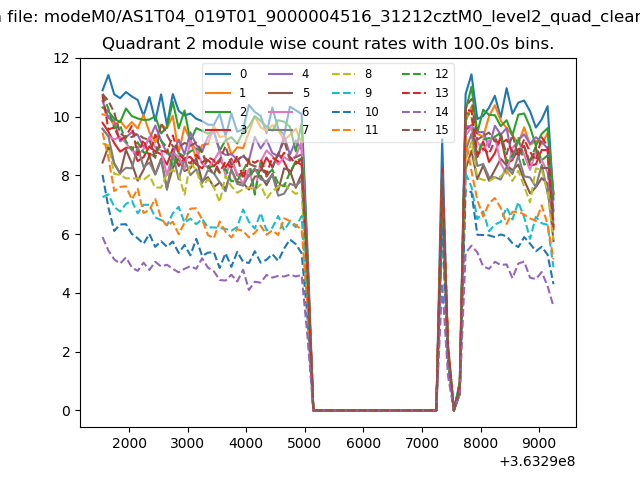
| Module-wise count rates for Quadrant B Data is divided into 100 sec bins |
 |
 |
| Module-wise count rates for Quadrant C Data is divided into 100 sec bins |
 |
 |
| Module-wise count rates for Quadrant D Data is divided into 100 sec bins |
 |
 |
| Parameter | Plot |
|---|---|
| CZT HV Monitor |  |
| D_VDD | 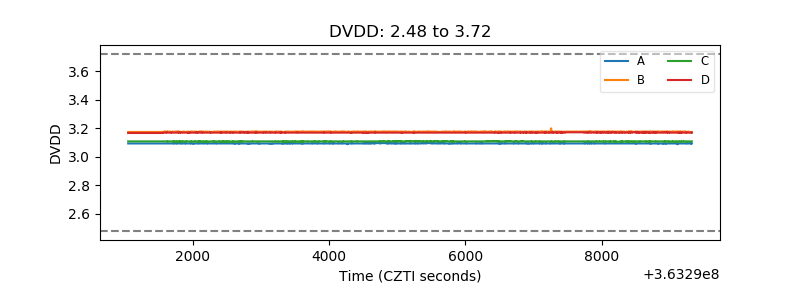 |
| Temperature 1 | 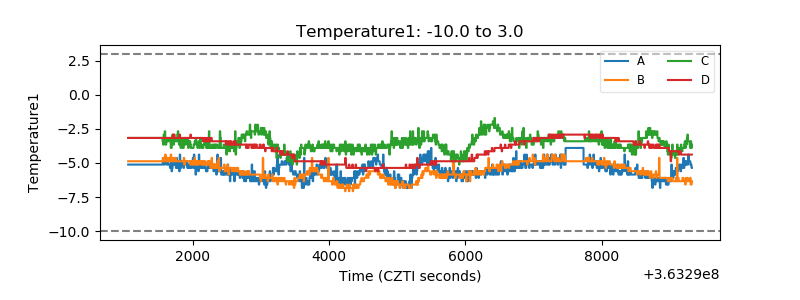 |
| Veto HV Monitor | 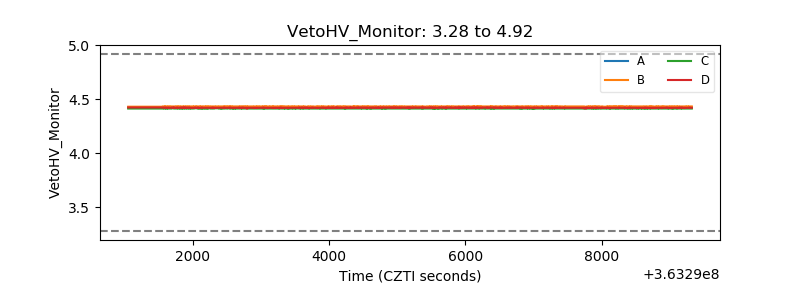 |
| Veto LLD | 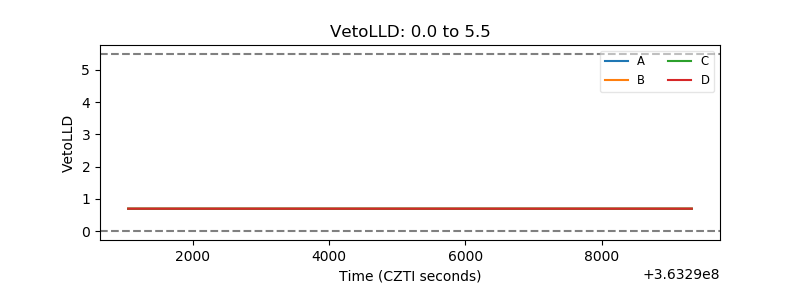 |
| Alpha Counter | 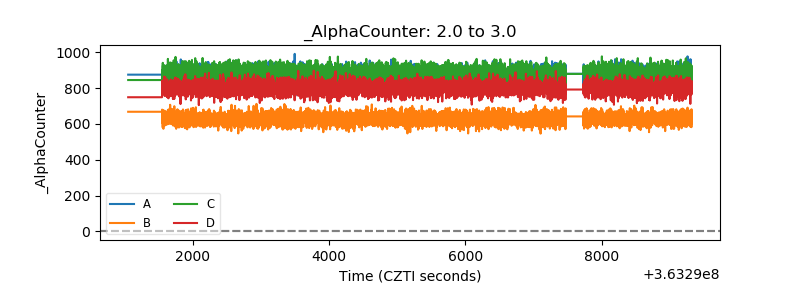 |
| _CPM_Rate | 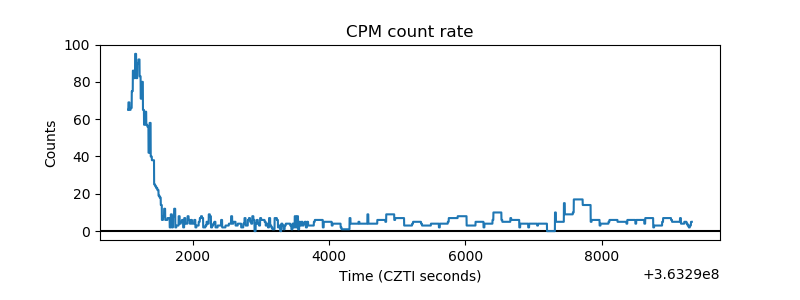 |
| CZT Counter | 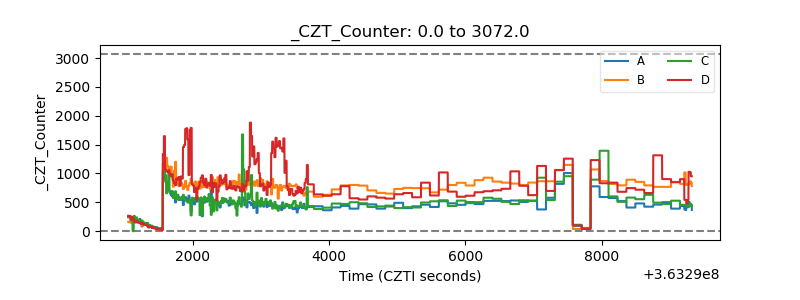 |
| +2.5 Volts monitor | 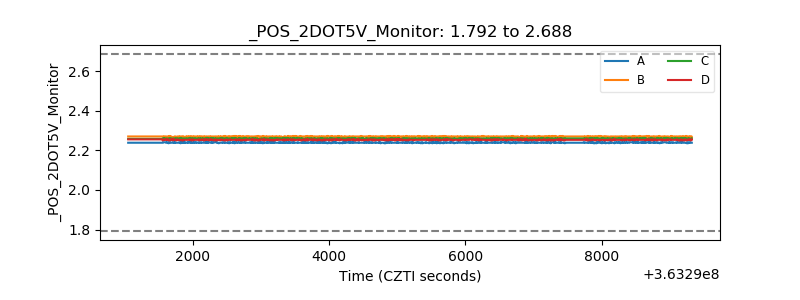 |
| +5 Volts monitor |  |
| _ROLL_ROT | 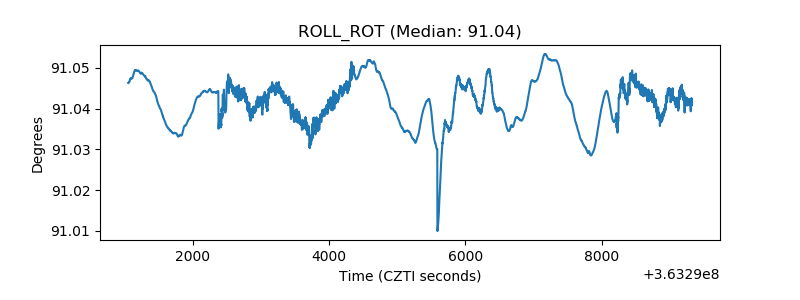 |
| _Roll_DEC | 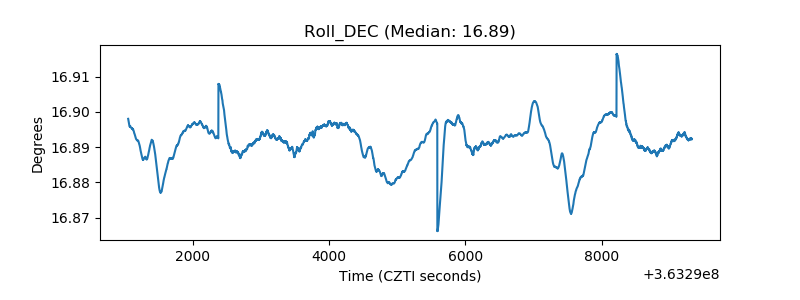 |
| _Roll_RA |  |
| Veto Counter | 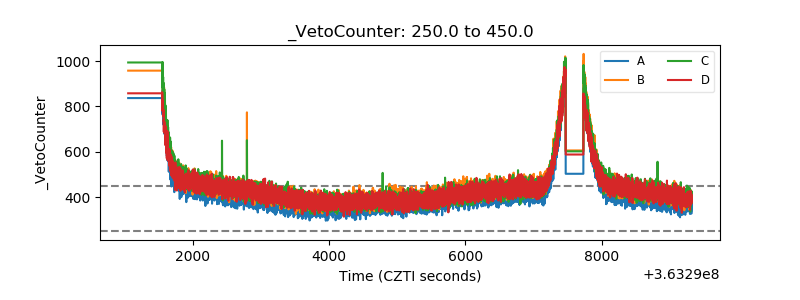 |