| Param | Original file | Final file |
|---|---|---|
| Filename | modeM0/AS1T04_019T01_9000004516_31213cztM0_level2.evt | modeM0/AS1T04_019T01_9000004516_31213cztM0_level2_quad_clean.evt |
| Size (bytes) | 683,910,720 | 111,288,960 |
| Size | 652.2 MB | 106.1 MB |
| Events in quadrant A | 3,799,754 | 729,078 |
| Events in quadrant B | 6,122,505 | 719,935 |
| Events in quadrant C | 4,372,999 | 692,301 |
| Events in quadrant D | 5,897,593 | 694,109 |
| Mode SS | |||
|---|---|---|---|
| Quadrant | BADHDUFLAG | Total packets | Discarded packets |
| A | 0 | 160 | 0 |
| B | 0 | 160 | 0 |
| C | 0 | 160 | 0 |
| D | 0 | 160 | 0 |
| Mode M9 | |||
|---|---|---|---|
| Quadrant | BADHDUFLAG | Total packets | Discarded packets |
| A | 0 | 2 | 0 |
| B | 0 | 3 | 0 |
| C | 0 | 3 | 0 |
| D | 0 | 3 | 0 |
| Mode M0 | |||
|---|---|---|---|
| Quadrant | BADHDUFLAG | Total packets | Discarded packets |
| A | 0 | 16302 | 5 |
| B | 0 | 23644 | 4 |
| C | 0 | 17919 | 4 |
| D | 0 | 22993 | 4 |
| Quadrant | Total seconds | Saturated seconds | Saturation percentage |
|---|---|---|---|
| A | 7677 | 178 | 2.318614% |
| B | 7677 | 371 | 4.832617% |
| C | 7677 | 417 | 5.431809% |
| D | 7677 | 222 | 2.891755% |
Noise dominated data is calculated using 1-second bins in cleaned event files. If a bin has >2000 counts, and if more than 50% of those come from <1% of pixels, then it is considered to be noise-dominated and hence unusable.
| Quadrant | # 1 sec bins | Bins with >0 counts | Bins with >2000 counts | High rate bins dominated by noise | Noise dominated (total time) | Noise dominated (detector-on time) | Marked lightcurve |
|---|---|---|---|---|---|---|---|
| A | 7862 | 7680 | 0 | 0 | 0.00% | 0.00% | 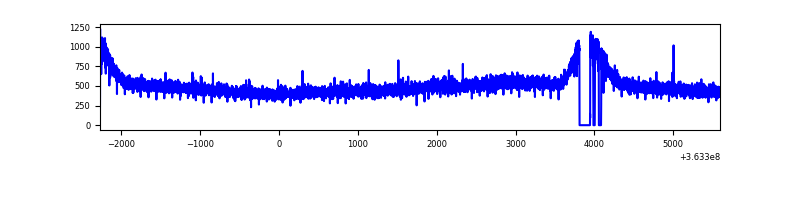 |
| B | 7862 | 7680 | 2 | 2 | 0.03% | 0.03% | 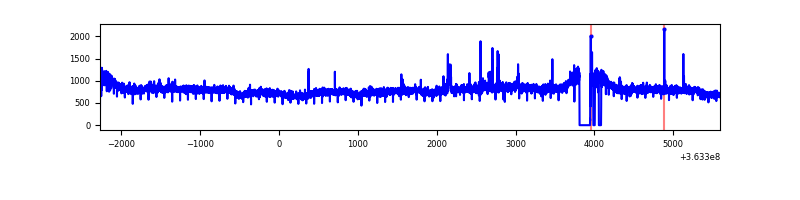 |
| C | 7862 | 7680 | 31 | 31 | 0.39% | 0.40% |  |
| D | 7862 | 7680 | 10 | 10 | 0.13% | 0.13% | 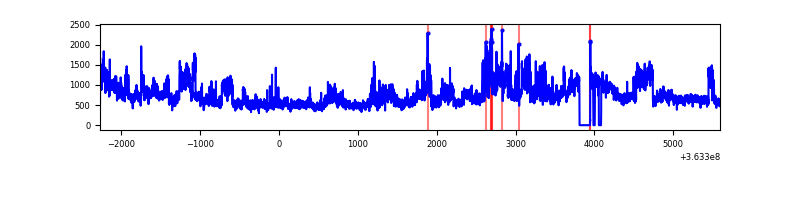 |
Top three noisy pixels from each quadrant. If the there are fewer than three noisy pixels in the level2.evt file, extra rows are filled as -1
| Pixel properties | Quadrant properties | ||||||
|---|---|---|---|---|---|---|---|
| Quadrant | DetID | PixID | Counts | Sigma | Mean | Median | Sigma |
| A | 13 | 254 | 11799 | 54.09 | 985 | 966 | 200.3 |
| A | 3 | 137 | 10679 | 48.49 | 985 | 966 | 200.3 |
| A | 0 | 226 | 8296 | 36.6 | 985 | 966 | 200.3 |
| B | 6 | 159 | 2259391 | 11949.71 | 963 | 937 | 189.0 |
| B | 0 | 230 | 36793 | 189.72 | 963 | 937 | 189.0 |
| B | 10 | 247 | 24899 | 126.79 | 963 | 937 | 189.0 |
| C | 10 | 22 | 226569 | 1009.99 | 940 | 946 | 223.4 |
| C | 3 | 233 | 177921 | 792.22 | 940 | 946 | 223.4 |
| C | 14 | 238 | 150326 | 668.69 | 940 | 946 | 223.4 |
| D | 8 | 195 | 1973810 | 8671.66 | 956 | 936 | 227.5 |
| D | 2 | 72 | 284663 | 1247.11 | 956 | 936 | 227.5 |
| D | 12 | 218 | 36130 | 154.69 | 956 | 936 | 227.5 |
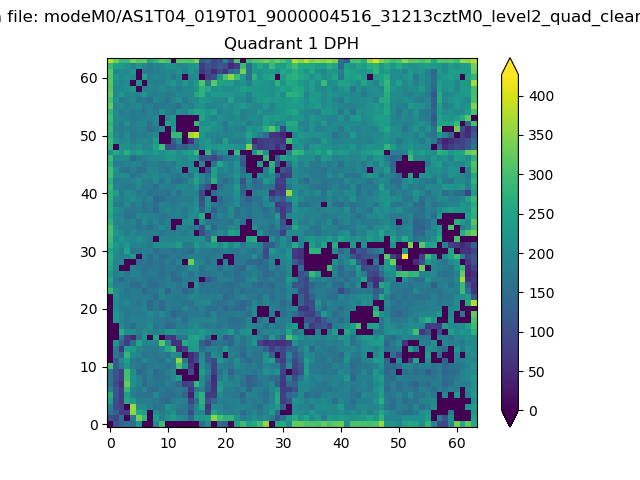
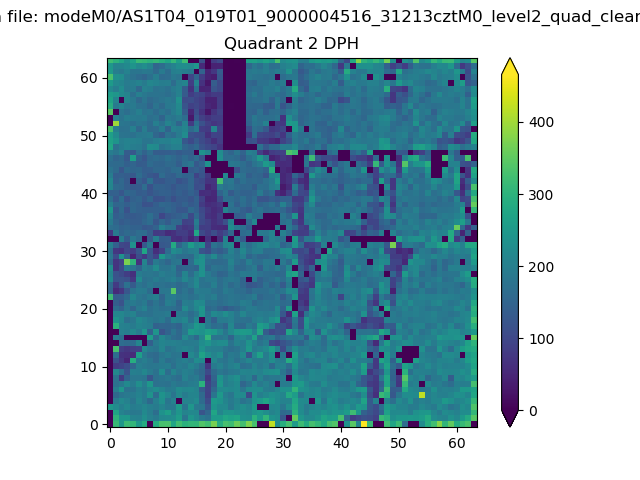
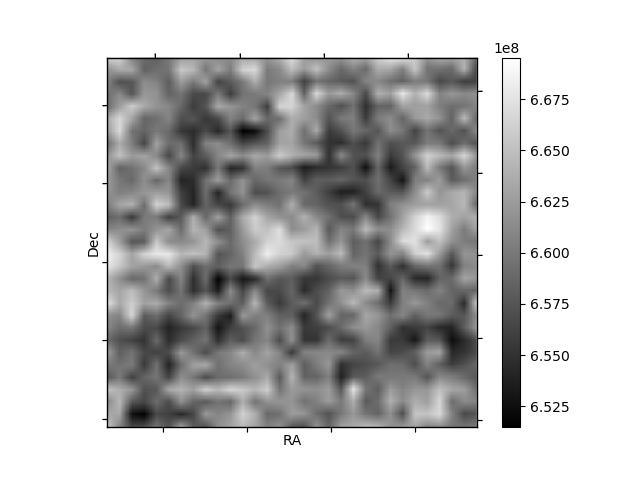
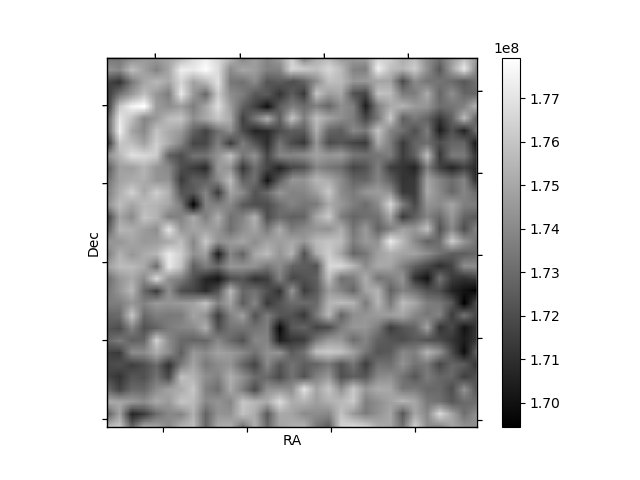
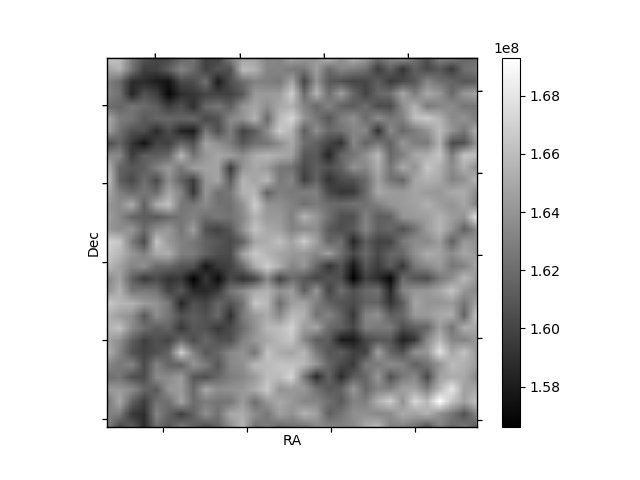
Histogram calculated using DETX and DETY for each event in the final _common_clean file
| Quadrant A | 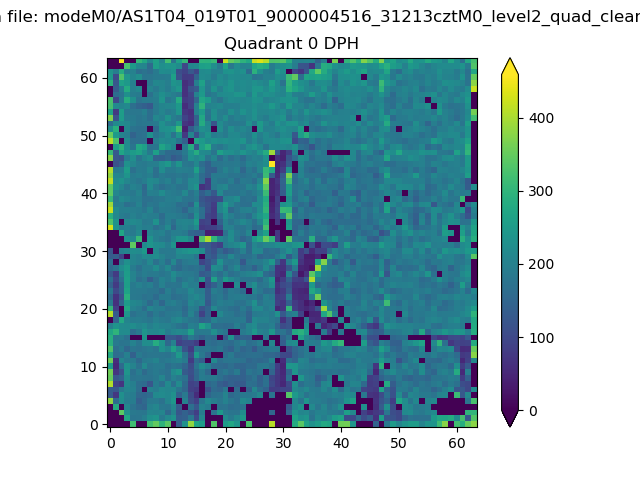 |
 |
Quadrant B |
|---|---|---|---|
| Quadrant D | 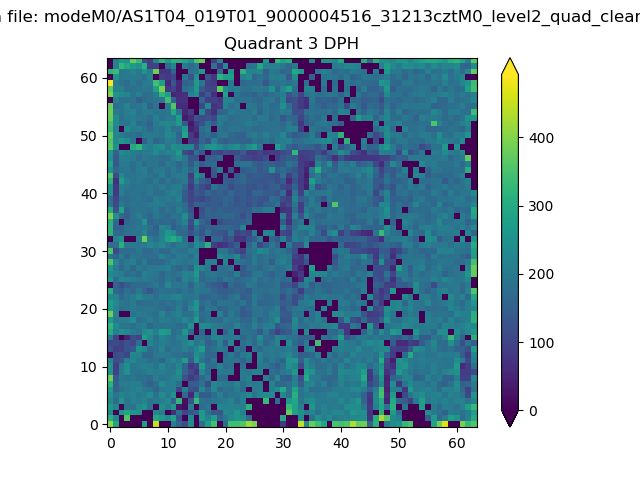 |
 |
Quadrant C |
| Plot type | Count rate plots | Images |
|---|---|---|
| Comparison with Poisson distribution Blue bars denote a histogram of data divided into 1 sec bins. Red curve is a Poisson curve with rate = median count rate of data. |
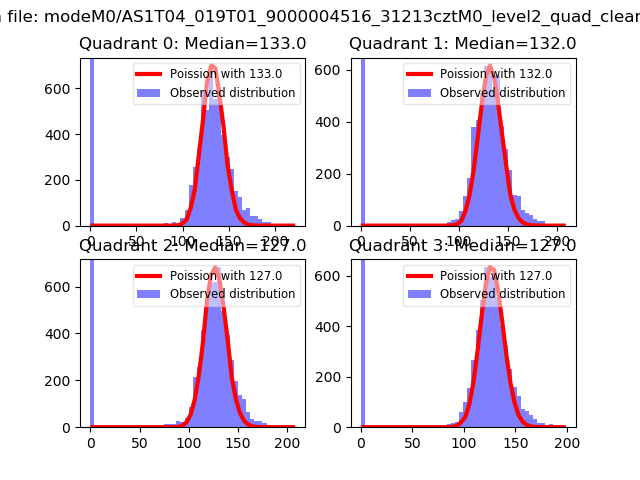 |
 |
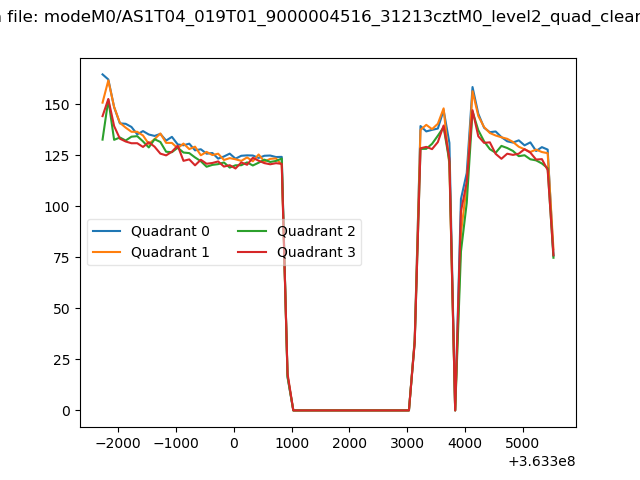
| Quadrant-wise count rates Data is divided into 100 sec bins |
 |
|
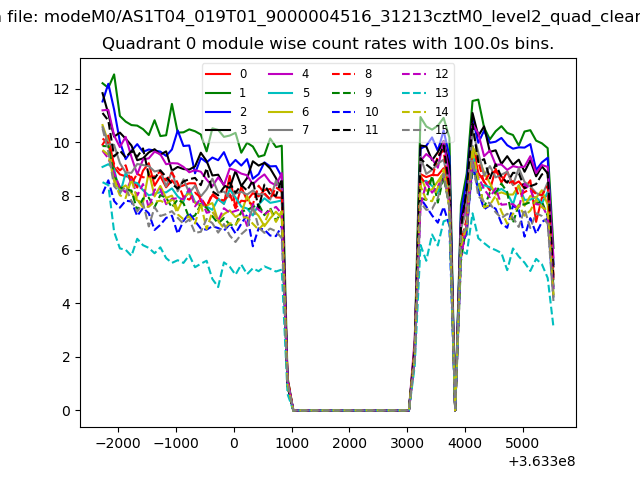
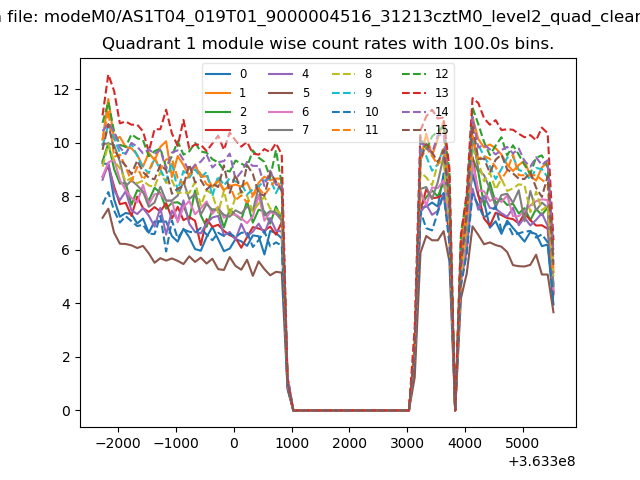
| Module-wise count rates for Quadrant A Data is divided into 100 sec bins |
 |
 |
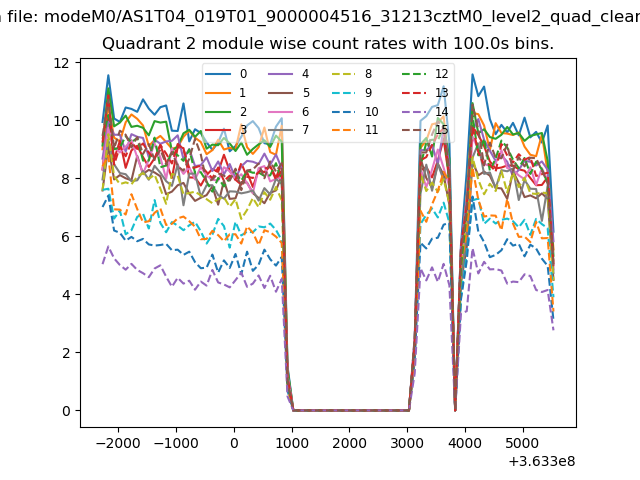
| Module-wise count rates for Quadrant B Data is divided into 100 sec bins |
 |
 |
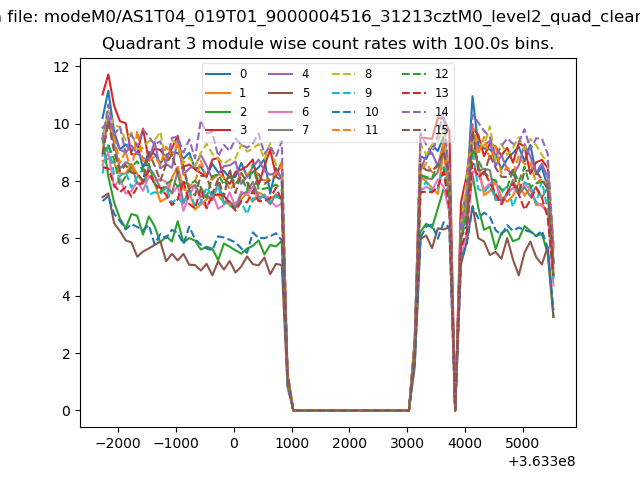
| Module-wise count rates for Quadrant C Data is divided into 100 sec bins |
 |
 |
| Module-wise count rates for Quadrant D Data is divided into 100 sec bins |
 |
 |
| Parameter | Plot |
|---|---|
| CZT HV Monitor |  |
| D_VDD |  |
| Temperature 1 | 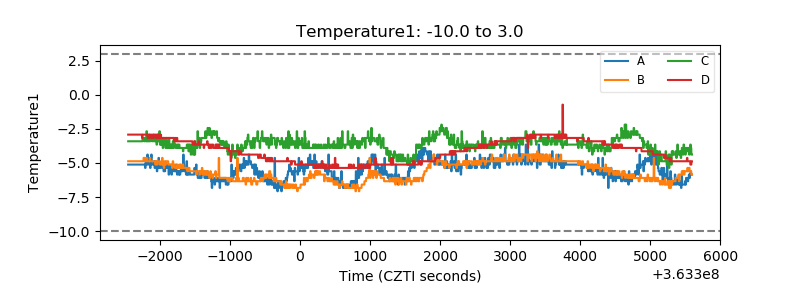 |
| Veto HV Monitor | 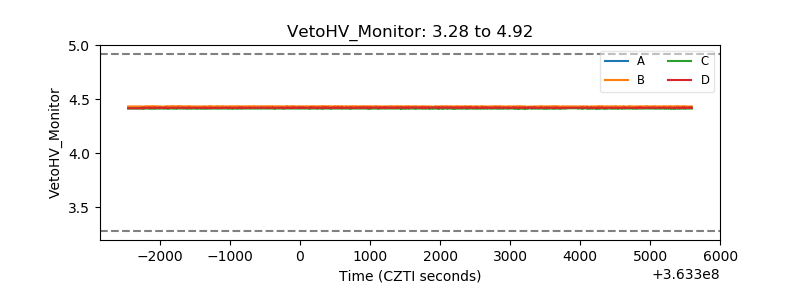 |
| Veto LLD |  |
| Alpha Counter | 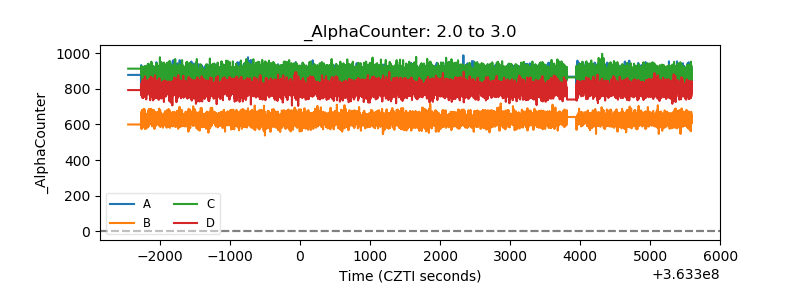 |
| _CPM_Rate | 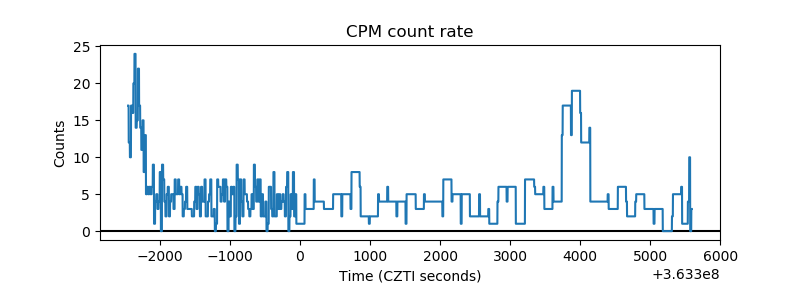 |
| CZT Counter | 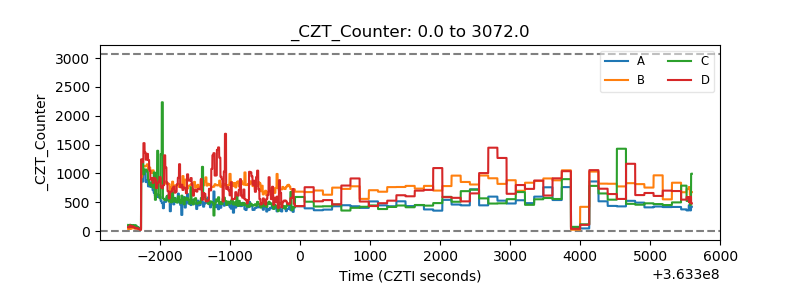 |
| +2.5 Volts monitor |  |
| +5 Volts monitor |  |
| _ROLL_ROT | 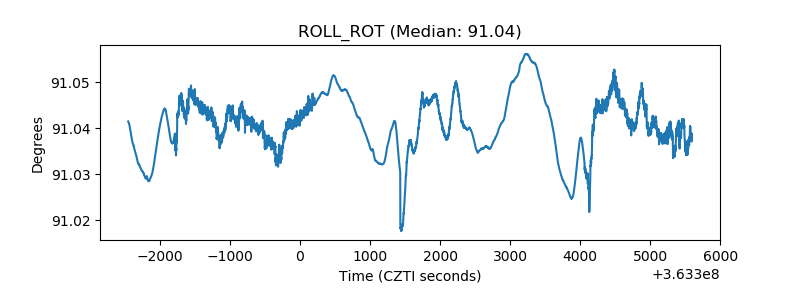 |
| _Roll_DEC | 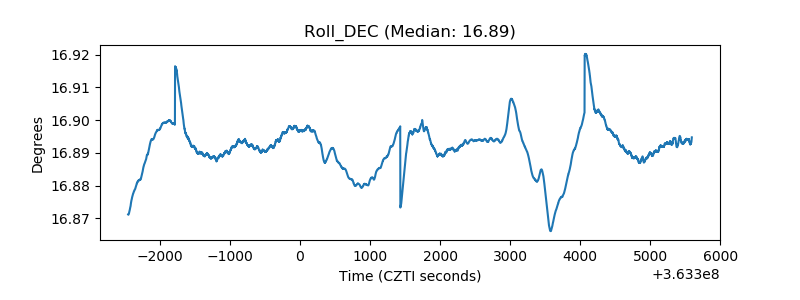 |
| _Roll_RA | 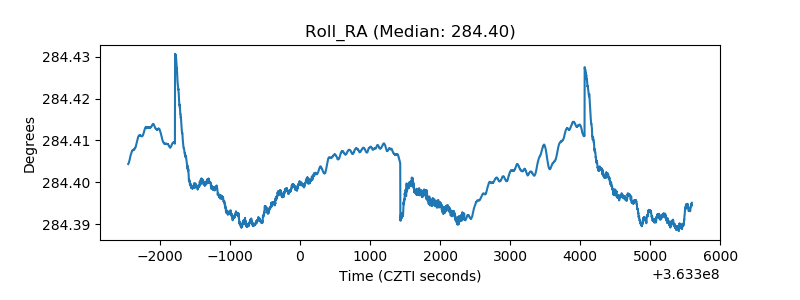 |
| Veto Counter | 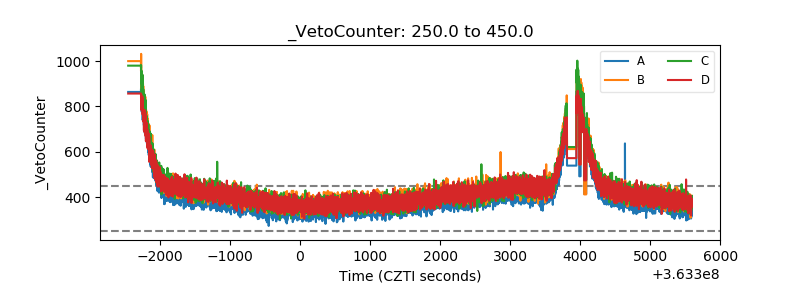 |