| Param | Original file | Final file |
|---|---|---|
| Filename | modeM0/AS1T04_019T01_9000004516_31214cztM0_level2.evt | modeM0/AS1T04_019T01_9000004516_31214cztM0_level2_quad_clean.evt |
| Size (bytes) | 674,821,440 | 113,244,480 |
| Size | 643.6 MB | 108.0 MB |
| Events in quadrant A | 3,815,894 | 740,158 |
| Events in quadrant B | 6,196,607 | 733,057 |
| Events in quadrant C | 4,296,074 | 705,423 |
| Events in quadrant D | 5,599,732 | 707,020 |
| Mode SS | |||
|---|---|---|---|
| Quadrant | BADHDUFLAG | Total packets | Discarded packets |
| A | 0 | 162 | 0 |
| B | 0 | 162 | 0 |
| C | 0 | 162 | 0 |
| D | 0 | 162 | 0 |
| Mode M9 | |||
|---|---|---|---|
| Quadrant | BADHDUFLAG | Total packets | Discarded packets |
| A | 0 | 4 | 0 |
| B | 0 | 4 | 0 |
| C | 0 | 4 | 0 |
| D | 0 | 4 | 0 |
| Mode M0 | |||
|---|---|---|---|
| Quadrant | BADHDUFLAG | Total packets | Discarded packets |
| A | 0 | 16537 | 4 |
| B | 0 | 24087 | 4 |
| C | 0 | 17849 | 4 |
| D | 0 | 22233 | 4 |
| Quadrant | Total seconds | Saturated seconds | Saturation percentage |
|---|---|---|---|
| A | 7813 | 168 | 2.150262% |
| B | 7814 | 397 | 5.080625% |
| C | 7814 | 379 | 4.850269% |
| D | 7814 | 180 | 2.303558% |
Noise dominated data is calculated using 1-second bins in cleaned event files. If a bin has >2000 counts, and if more than 50% of those come from <1% of pixels, then it is considered to be noise-dominated and hence unusable.
| Quadrant | # 1 sec bins | Bins with >0 counts | Bins with >2000 counts | High rate bins dominated by noise | Noise dominated (total time) | Noise dominated (detector-on time) | Marked lightcurve |
|---|---|---|---|---|---|---|---|
| A | 8313 | 7817 | 0 | 0 | 0.00% | 0.00% |  |
| B | 8314 | 7818 | 2 | 2 | 0.02% | 0.03% | 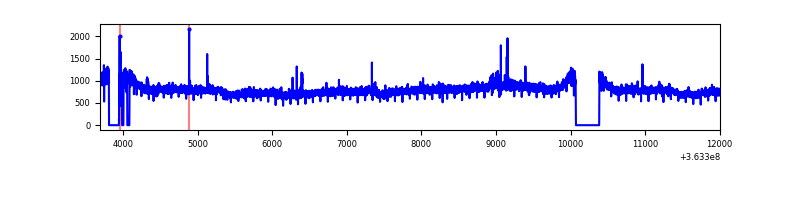 |
| C | 8314 | 7818 | 31 | 31 | 0.37% | 0.40% |  |
| D | 8314 | 7818 | 6 | 6 | 0.07% | 0.08% | 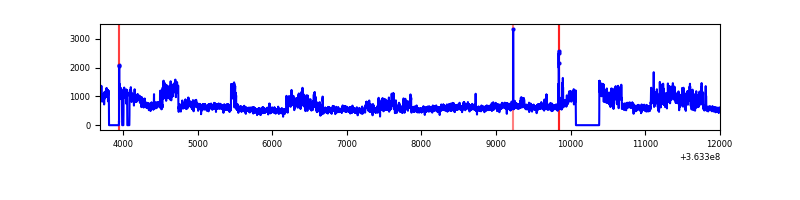 |
Top three noisy pixels from each quadrant. If the there are fewer than three noisy pixels in the level2.evt file, extra rows are filled as -1
| Pixel properties | Quadrant properties | ||||||
|---|---|---|---|---|---|---|---|
| Quadrant | DetID | PixID | Counts | Sigma | Mean | Median | Sigma |
| A | 13 | 254 | 12932 | 59.03 | 989 | 969 | 202.6 |
| A | 3 | 137 | 10735 | 48.19 | 989 | 969 | 202.6 |
| A | 0 | 226 | 8169 | 35.53 | 989 | 969 | 202.6 |
| B | 6 | 159 | 2322943 | 12127.35 | 969 | 943 | 191.5 |
| B | 0 | 190 | 40571 | 206.97 | 969 | 943 | 191.5 |
| B | 12 | 111 | 24633 | 123.73 | 969 | 943 | 191.5 |
| C | 10 | 22 | 182264 | 801.75 | 948 | 954 | 226.1 |
| C | 14 | 238 | 149938 | 658.8 | 948 | 954 | 226.1 |
| C | 3 | 233 | 128872 | 565.65 | 948 | 954 | 226.1 |
| D | 8 | 195 | 1903494 | 8322.39 | 961 | 940 | 228.6 |
| D | 2 | 72 | 35187 | 149.81 | 961 | 940 | 228.6 |
| D | 2 | 234 | 29188 | 123.57 | 961 | 940 | 228.6 |
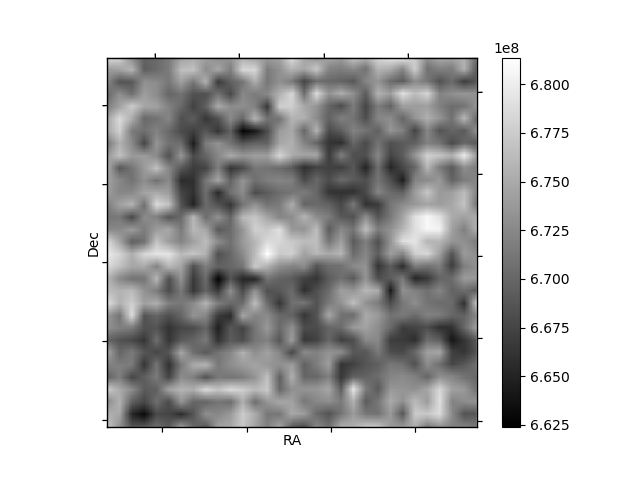
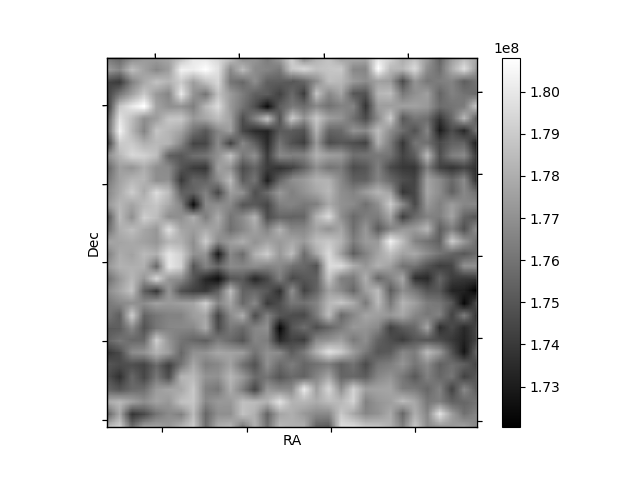
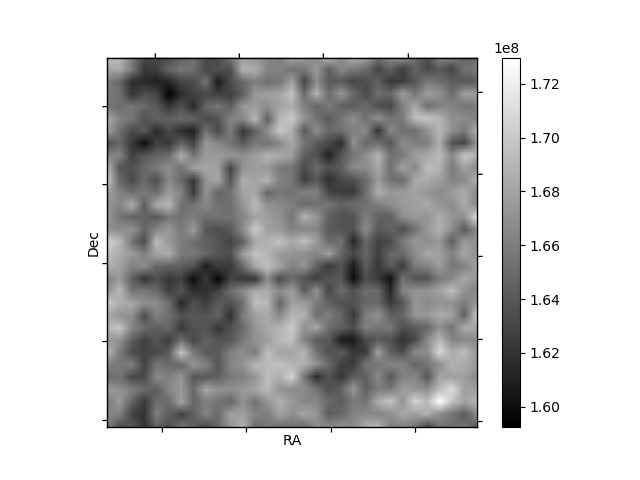
Histogram calculated using DETX and DETY for each event in the final _common_clean file
| Quadrant A | 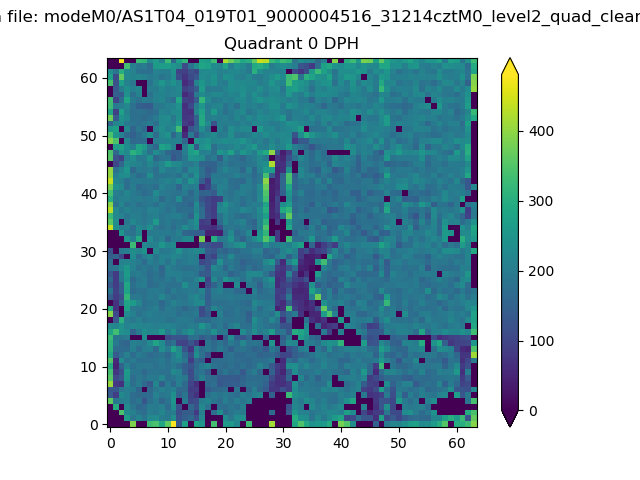 |
 |
Quadrant B |
|---|---|---|---|
| Quadrant D | 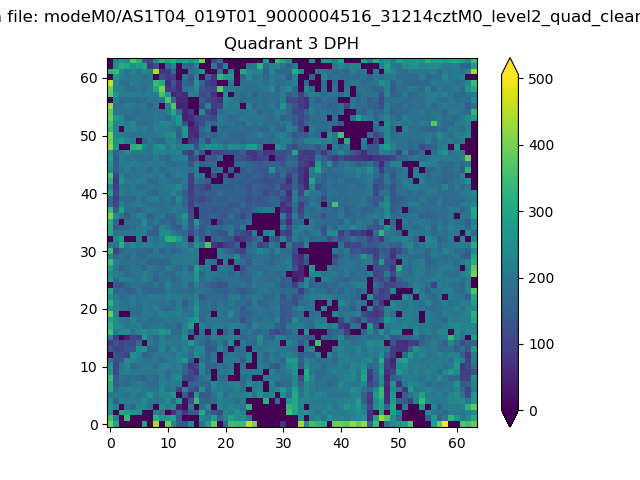 |
 |
Quadrant C |
| Plot type | Count rate plots | Images |
|---|---|---|
| Comparison with Poisson distribution Blue bars denote a histogram of data divided into 1 sec bins. Red curve is a Poisson curve with rate = median count rate of data. |
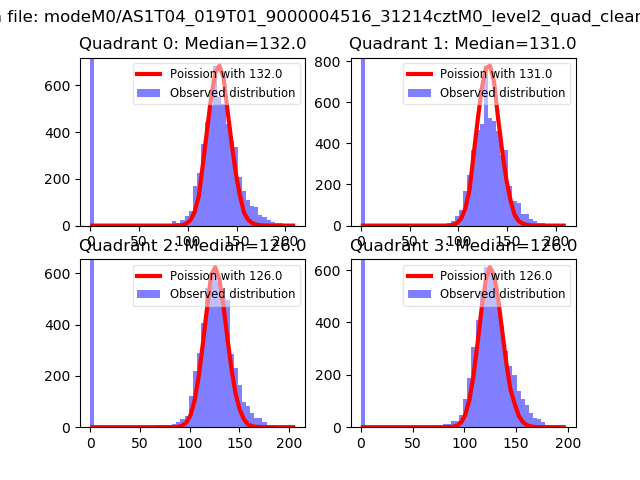 |
 |
| Quadrant-wise count rates Data is divided into 100 sec bins |
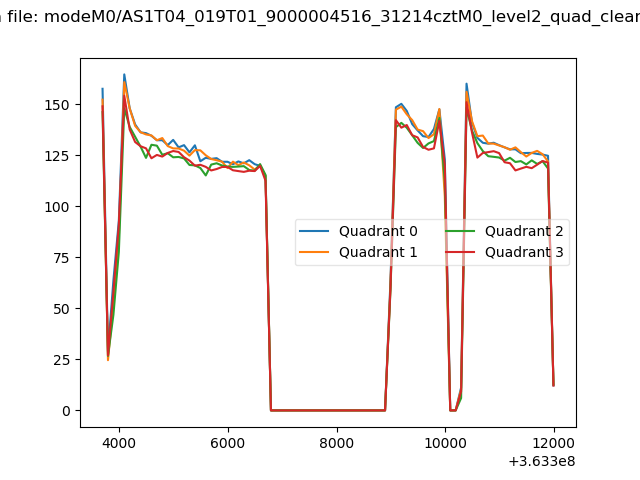 |
|
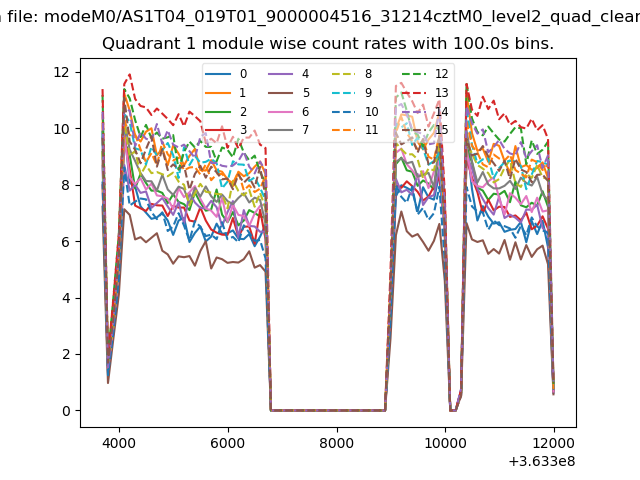
| Module-wise count rates for Quadrant A Data is divided into 100 sec bins |
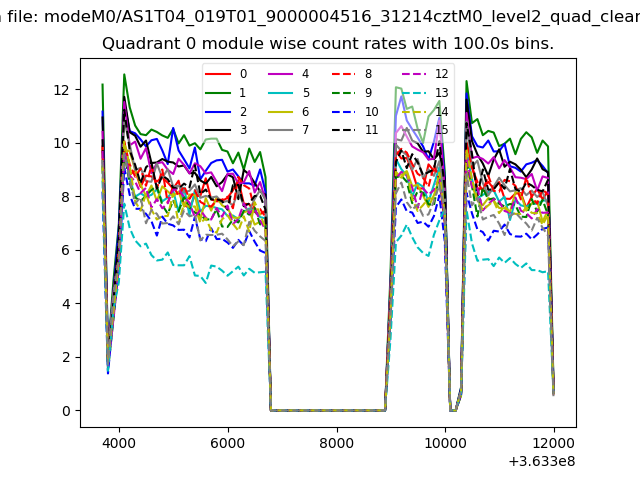 |
 |
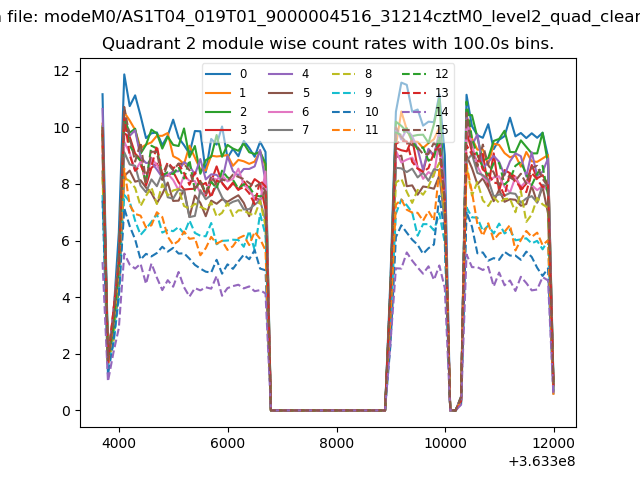
| Module-wise count rates for Quadrant B Data is divided into 100 sec bins |
 |
 |
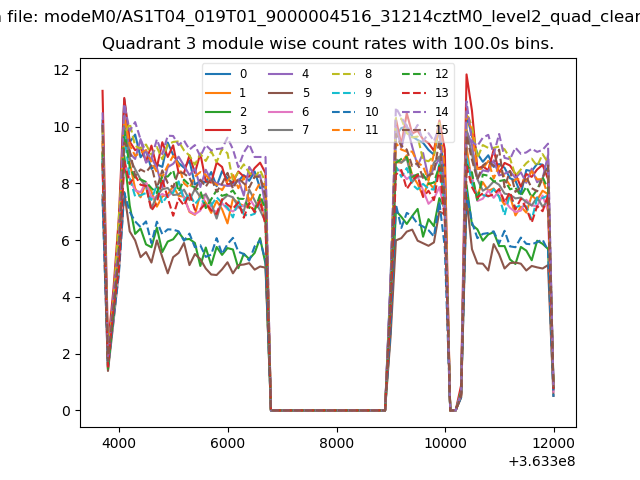
| Module-wise count rates for Quadrant C Data is divided into 100 sec bins |
 |
 |
| Module-wise count rates for Quadrant D Data is divided into 100 sec bins |
 |
 |
| Parameter | Plot |
|---|---|
| CZT HV Monitor | 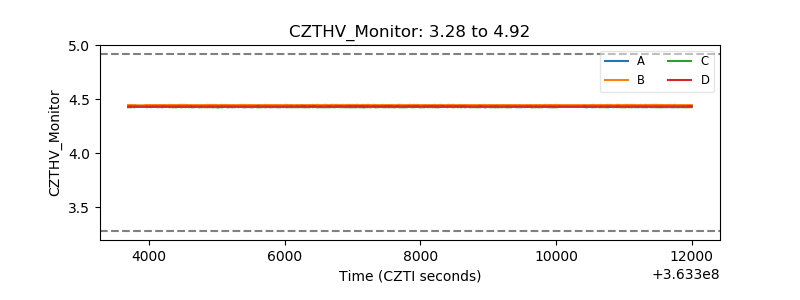 |
| D_VDD | 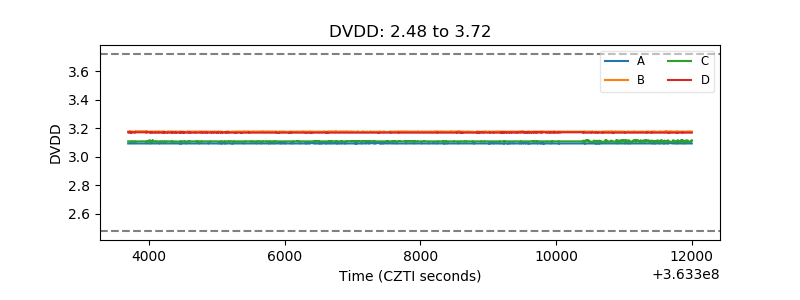 |
| Temperature 1 | 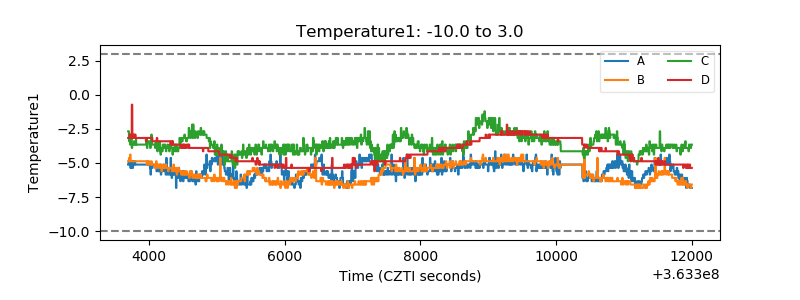 |
| Veto HV Monitor | 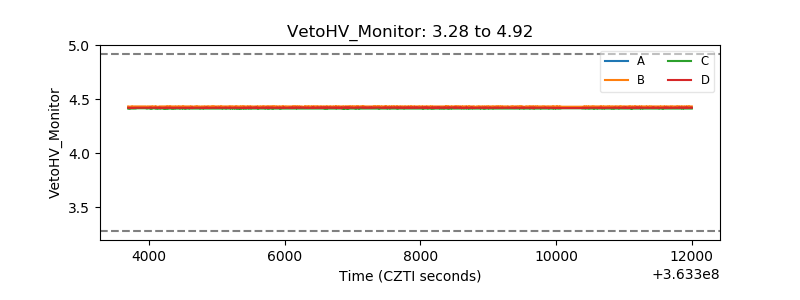 |
| Veto LLD | 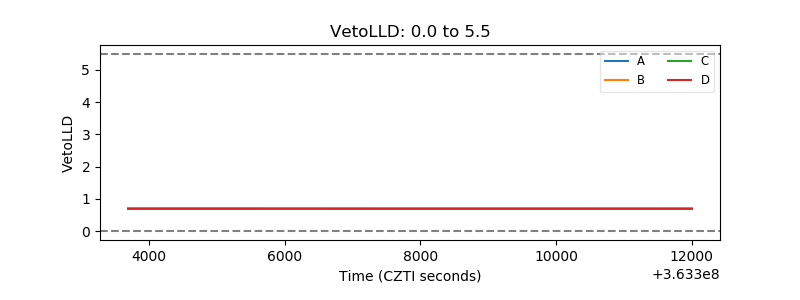 |
| Alpha Counter | 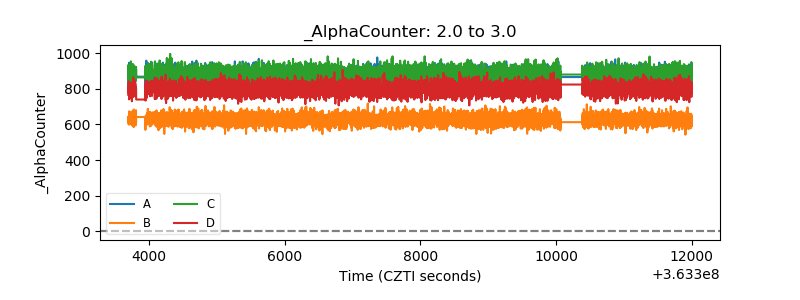 |
| _CPM_Rate | 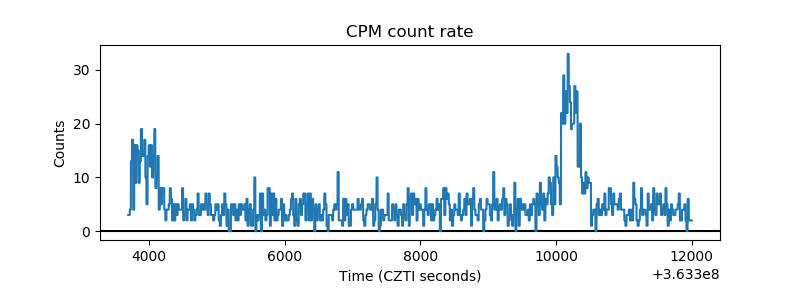 |
| CZT Counter |  |
| +2.5 Volts monitor |  |
| +5 Volts monitor |  |
| _ROLL_ROT | 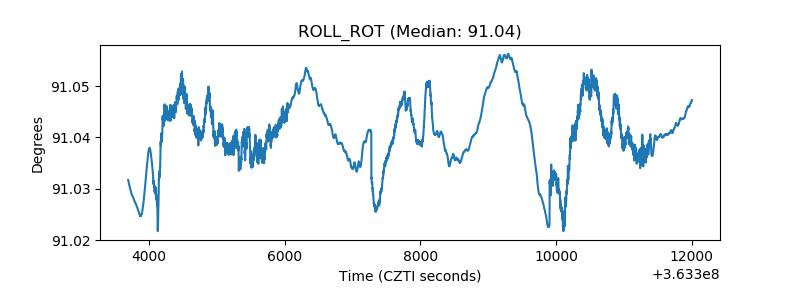 |
| _Roll_DEC | 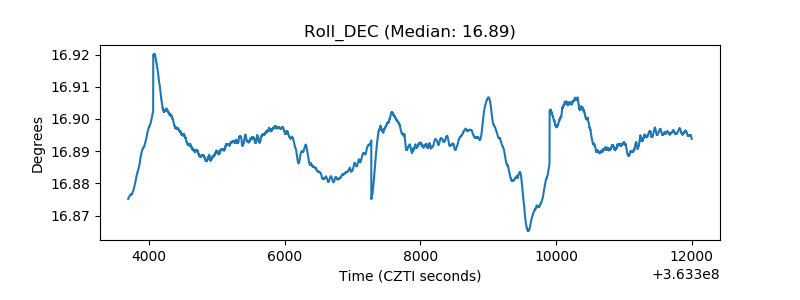 |
| _Roll_RA | 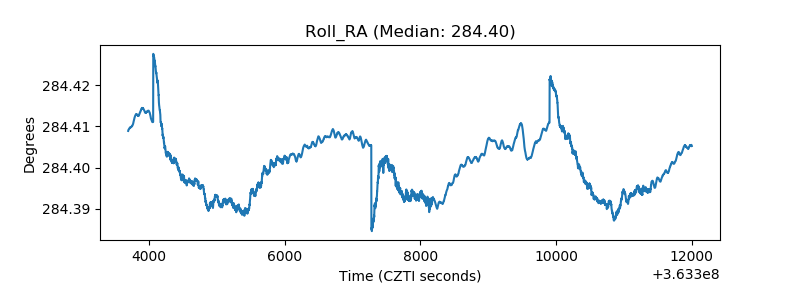 |
| Veto Counter | 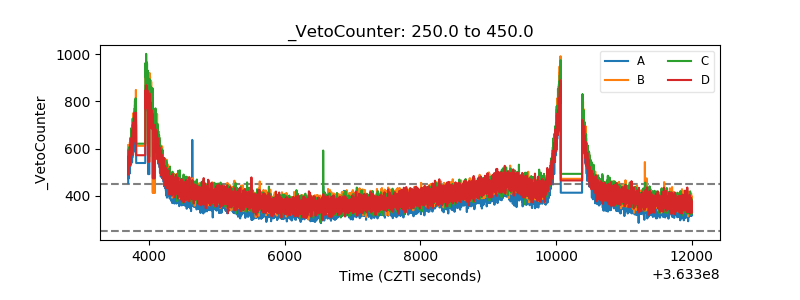 |