| Param | Original file | Final file |
|---|---|---|
| Filename | modeM0/AS1T04_019T01_9000004516_31216cztM0_level2.evt | modeM0/AS1T04_019T01_9000004516_31216cztM0_level2_quad_clean.evt |
| Size (bytes) | 1,114,770,240 | 169,390,080 |
| Size | 1.0 GB | 161.5 MB |
| Events in quadrant A | 6,064,415 | 1,086,762 |
| Events in quadrant B | 9,964,321 | 1,081,404 |
| Events in quadrant C | 6,471,454 | 1,039,903 |
| Events in quadrant D | 10,388,413 | 1,027,690 |
| Mode SS | |||
|---|---|---|---|
| Quadrant | BADHDUFLAG | Total packets | Discarded packets |
| A | 0 | 264 | 0 |
| B | 0 | 264 | 0 |
| C | 0 | 264 | 0 |
| D | 0 | 264 | 0 |
| Mode M9 | |||
|---|---|---|---|
| Quadrant | BADHDUFLAG | Total packets | Discarded packets |
| A | 0 | 13 | 0 |
| B | 0 | 14 | 0 |
| C | 0 | 14 | 0 |
| D | 0 | 14 | 0 |
| Mode M0 | |||
|---|---|---|---|
| Quadrant | BADHDUFLAG | Total packets | Discarded packets |
| A | 0 | 26494 | 3 |
| B | 0 | 39029 | 3 |
| C | 0 | 27393 | 3 |
| D | 0 | 40282 | 3 |
| Quadrant | Total seconds | Saturated seconds | Saturation percentage |
|---|---|---|---|
| A | 12939 | 86 | 0.664657% |
| B | 12939 | 228 | 1.762115% |
| C | 12939 | 259 | 2.001700% |
| D | 12938 | 215 | 1.661772% |
Noise dominated data is calculated using 1-second bins in cleaned event files. If a bin has >2000 counts, and if more than 50% of those come from <1% of pixels, then it is considered to be noise-dominated and hence unusable.
| Quadrant | # 1 sec bins | Bins with >0 counts | Bins with >2000 counts | High rate bins dominated by noise | Noise dominated (total time) | Noise dominated (detector-on time) | Marked lightcurve |
|---|---|---|---|---|---|---|---|
| A | 14169 | 12941 | 1 | 1 | 0.01% | 0.01% | 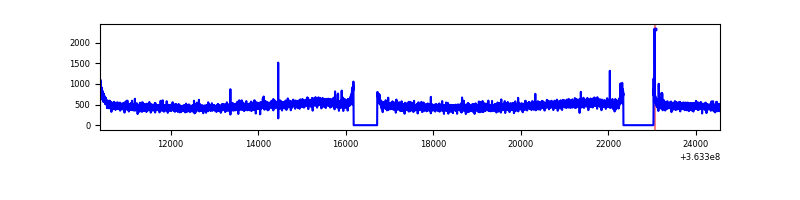 |
| B | 14169 | 12941 | 0 | 0 | 0.00% | 0.00% |  |
| C | 14169 | 12941 | 12 | 12 | 0.08% | 0.09% | 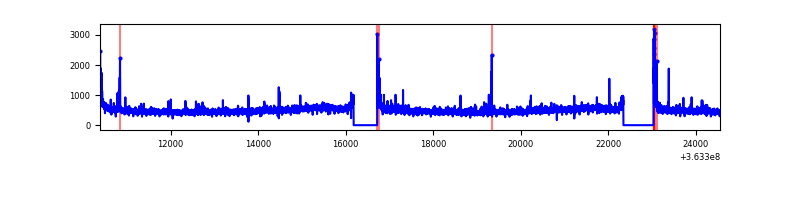 |
| D | 14168 | 12940 | 30 | 30 | 0.21% | 0.23% | 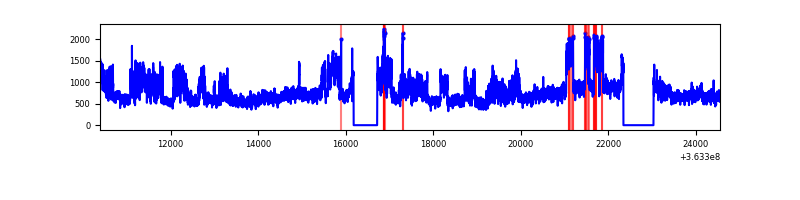 |
Top three noisy pixels from each quadrant. If the there are fewer than three noisy pixels in the level2.evt file, extra rows are filled as -1
| Pixel properties | Quadrant properties | ||||||
|---|---|---|---|---|---|---|---|
| Quadrant | DetID | PixID | Counts | Sigma | Mean | Median | Sigma |
| A | 13 | 254 | 20648 | 60.56 | 1570 | 1542 | 315.5 |
| A | 3 | 137 | 16492 | 47.38 | 1570 | 1542 | 315.5 |
| A | 0 | 226 | 12985 | 36.27 | 1570 | 1542 | 315.5 |
| B | 6 | 159 | 3853423 | 12889.92 | 1543 | 1497 | 298.8 |
| B | 12 | 111 | 38586 | 124.11 | 1543 | 1497 | 298.8 |
| B | 11 | 111 | 35917 | 115.18 | 1543 | 1497 | 298.8 |
| C | 14 | 238 | 255532 | 712.96 | 1504 | 1513 | 356.3 |
| C | 0 | 10 | 141206 | 392.08 | 1504 | 1513 | 356.3 |
| C | 3 | 233 | 84771 | 233.68 | 1504 | 1513 | 356.3 |
| D | 8 | 195 | 4669949 | 13118.87 | 1512 | 1479 | 355.9 |
| D | 2 | 234 | 49857 | 135.95 | 1512 | 1479 | 355.9 |
| D | 0 | 60 | 16804 | 43.06 | 1512 | 1479 | 355.9 |
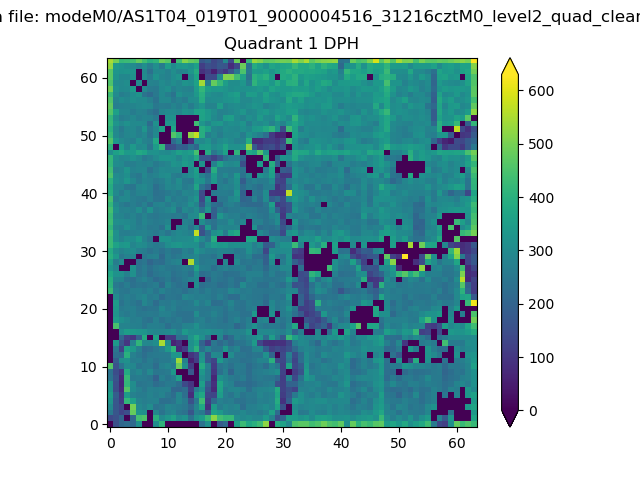
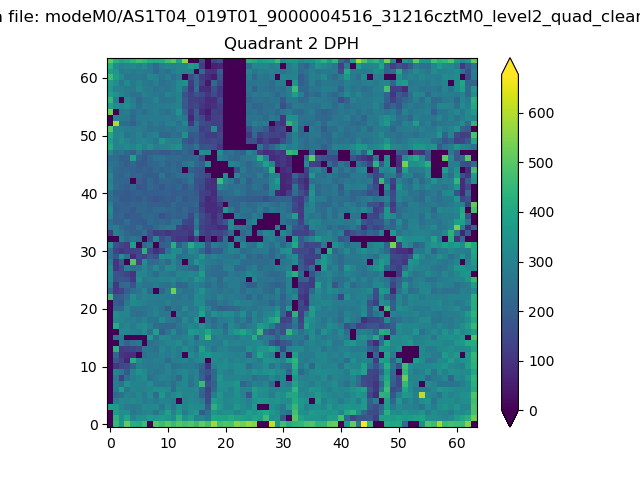
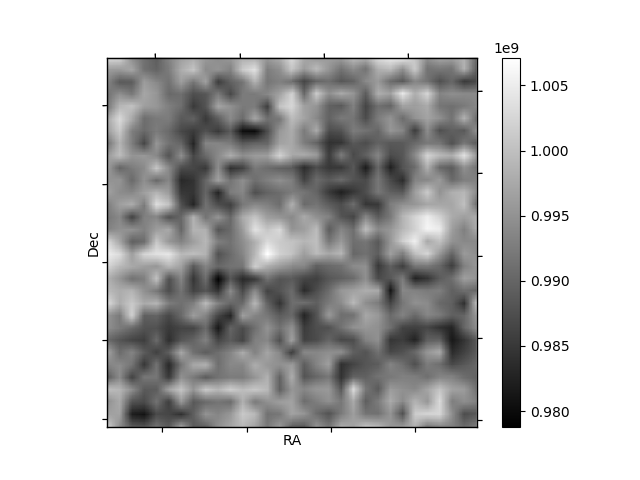
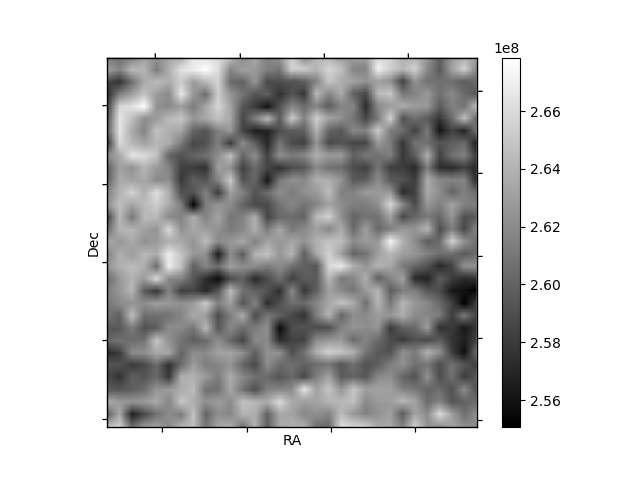
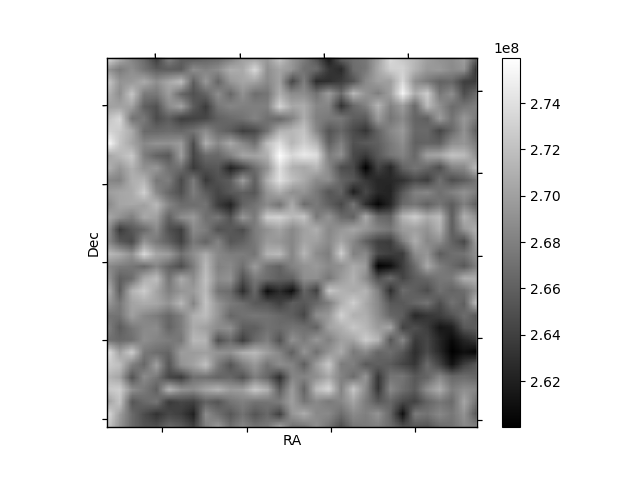
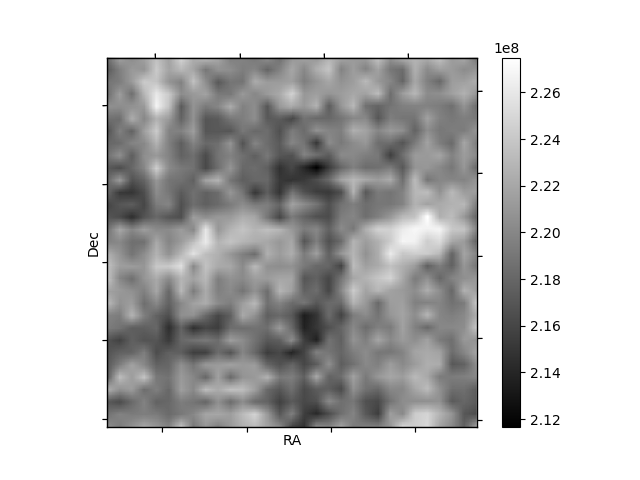
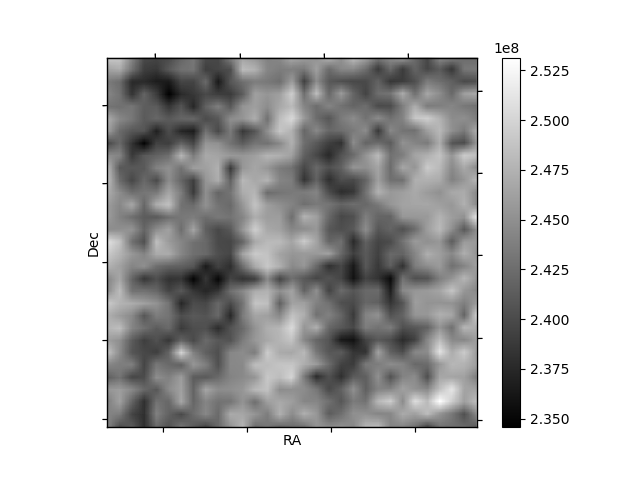
Histogram calculated using DETX and DETY for each event in the final _common_clean file
| Quadrant A | 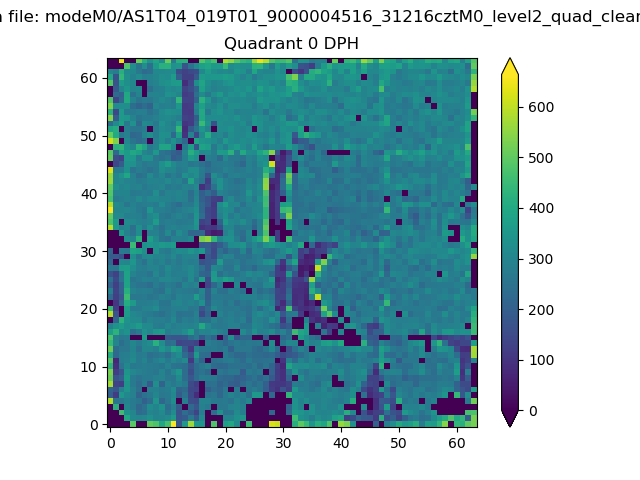 |
 |
Quadrant B |
|---|---|---|---|
| Quadrant D | 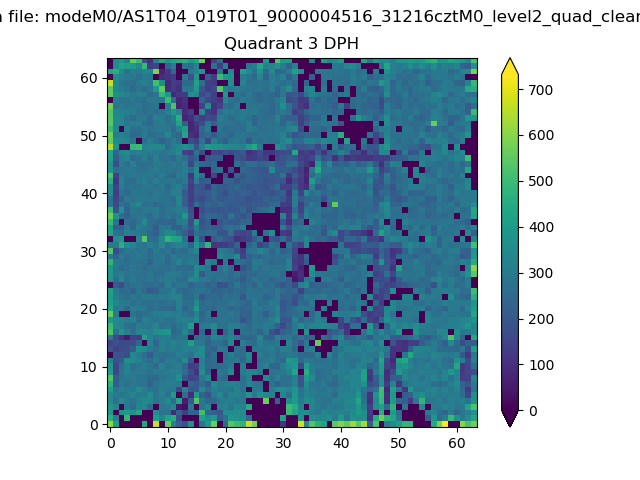 |
 |
Quadrant C |
| Plot type | Count rate plots | Images |
|---|---|---|
| Comparison with Poisson distribution Blue bars denote a histogram of data divided into 1 sec bins. Red curve is a Poisson curve with rate = median count rate of data. |
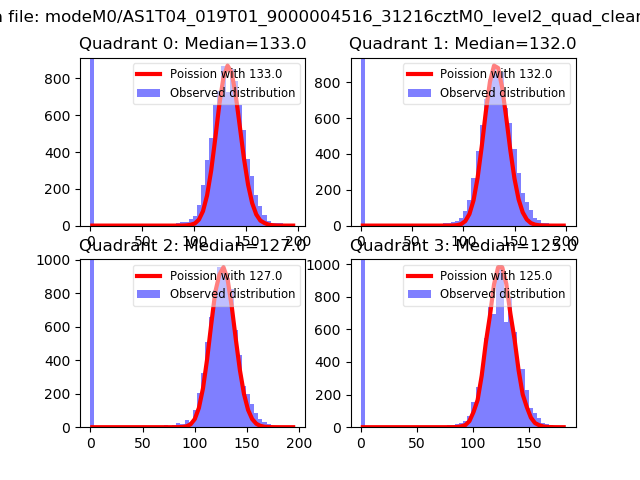 |
 |
| Quadrant-wise count rates Data is divided into 100 sec bins |
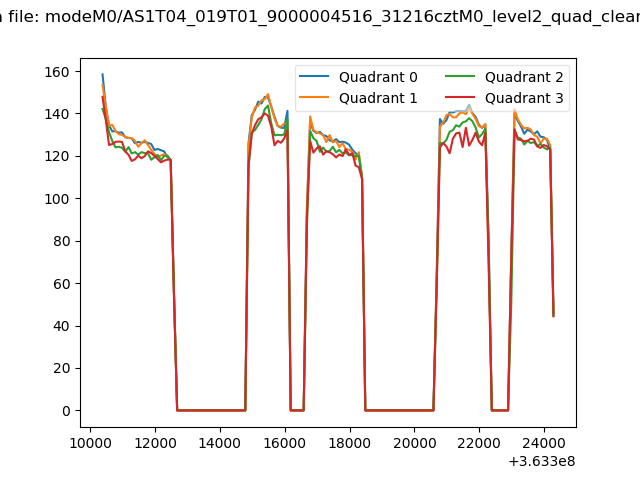 |
|
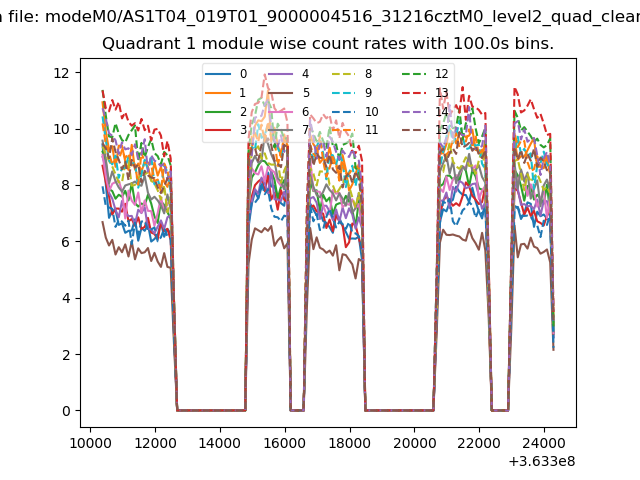
| Module-wise count rates for Quadrant A Data is divided into 100 sec bins |
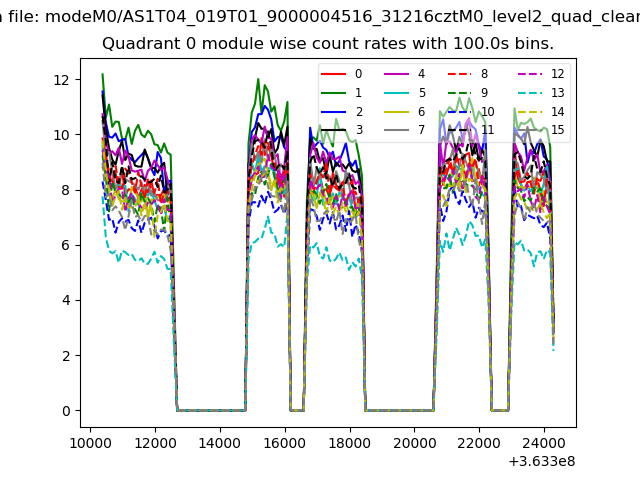 |
 |
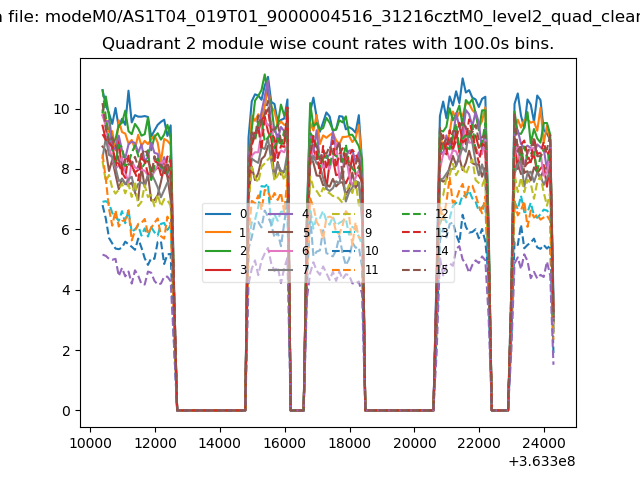
| Module-wise count rates for Quadrant B Data is divided into 100 sec bins |
 |
 |
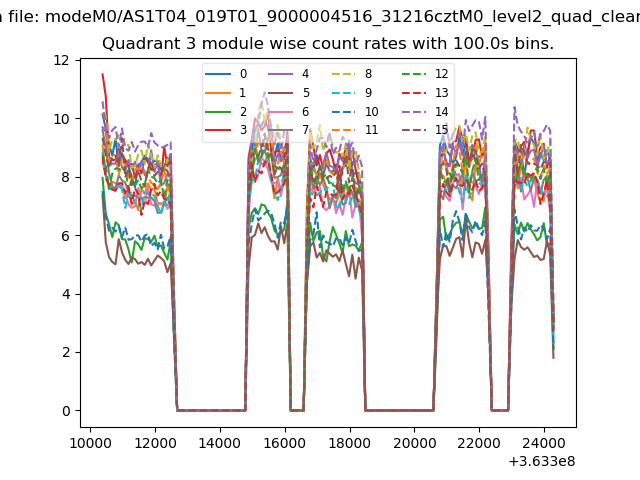
| Module-wise count rates for Quadrant C Data is divided into 100 sec bins |
 |
 |
| Module-wise count rates for Quadrant D Data is divided into 100 sec bins |
 |
 |
| Parameter | Plot |
|---|---|
| CZT HV Monitor | 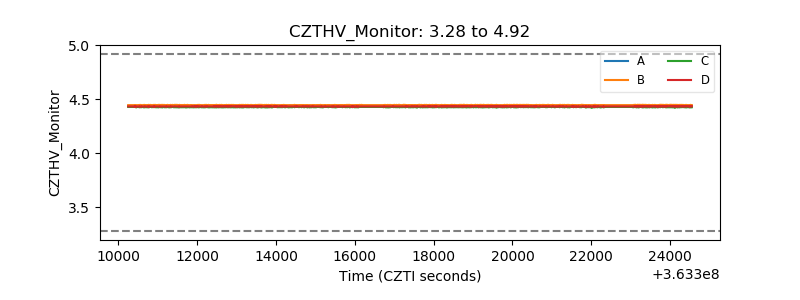 |
| D_VDD | 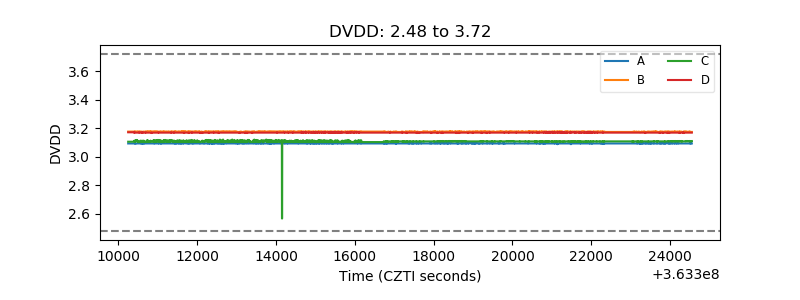 |
| Temperature 1 | 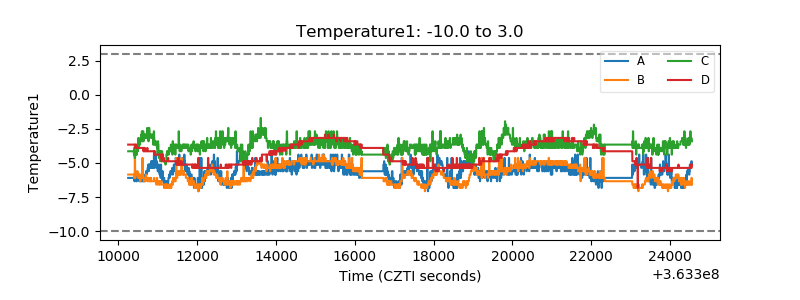 |
| Veto HV Monitor |  |
| Veto LLD | 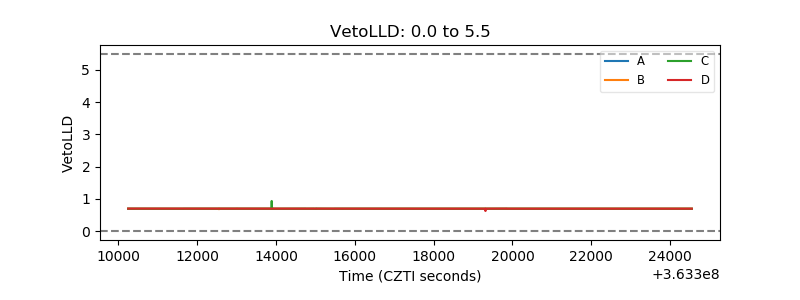 |
| Alpha Counter | 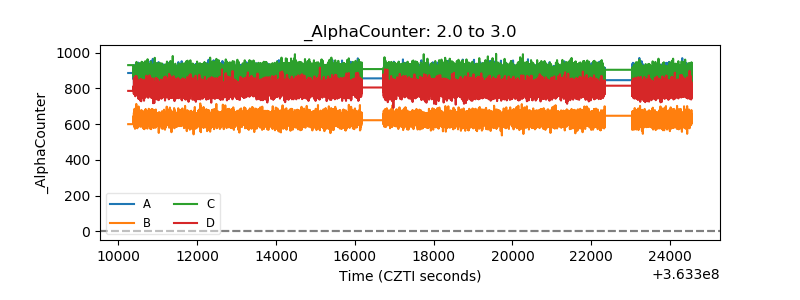 |
| _CPM_Rate | 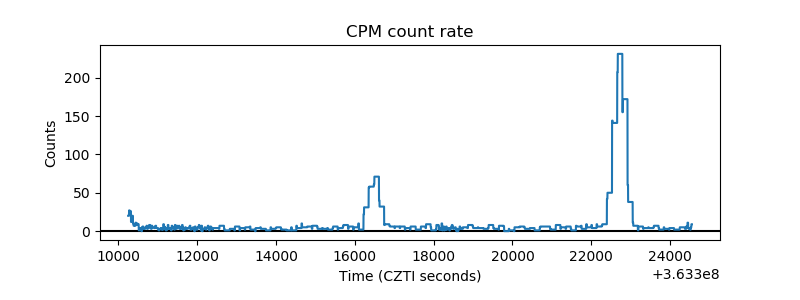 |
| CZT Counter | 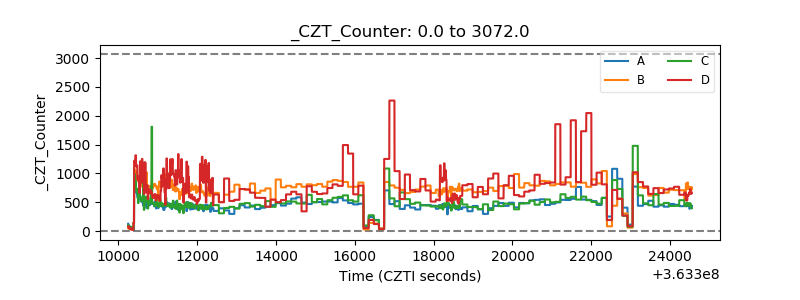 |
| +2.5 Volts monitor | 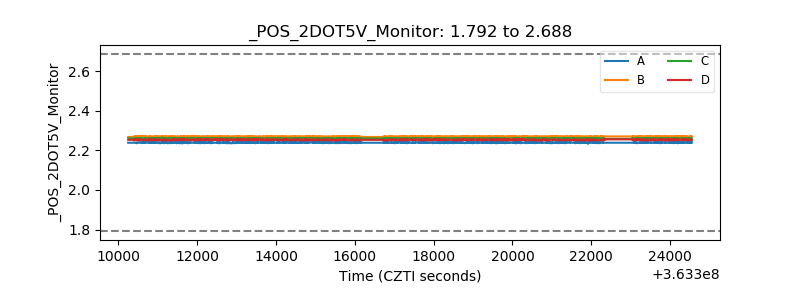 |
| +5 Volts monitor |  |
| _ROLL_ROT | 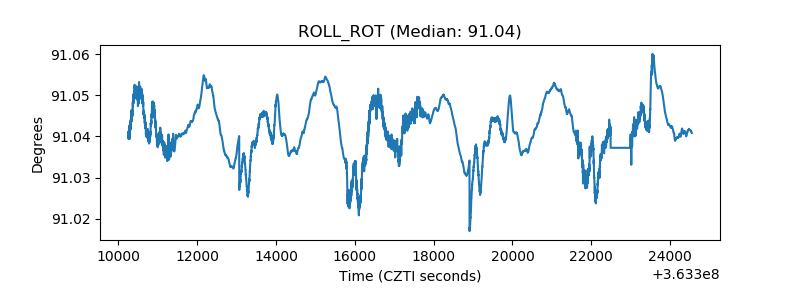 |
| _Roll_DEC | 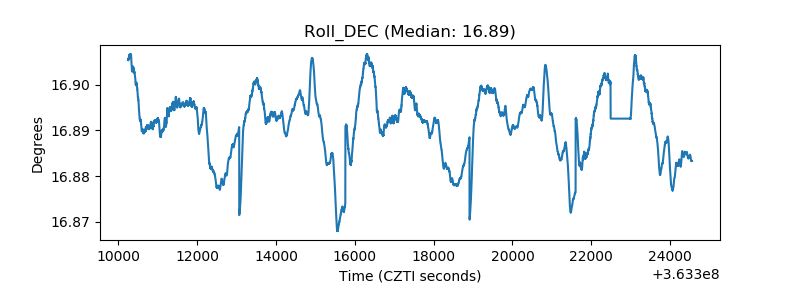 |
| _Roll_RA | 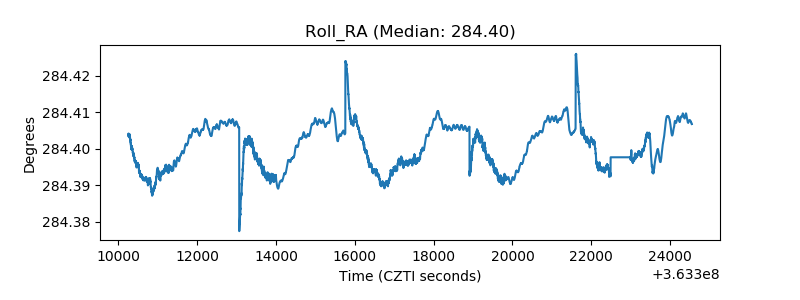 |
| Veto Counter | 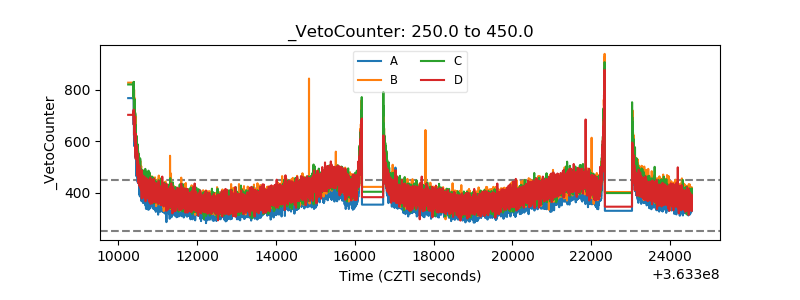 |