| Param | Original file | Final file |
|---|---|---|
| Filename | modeM0/AS1T04_019T01_9000004516_31217cztM0_level2.evt | modeM0/AS1T04_019T01_9000004516_31217cztM0_level2_quad_clean.evt |
| Size (bytes) | 587,998,080 | 77,333,760 |
| Size | 560.8 MB | 73.8 MB |
| Events in quadrant A | 3,034,257 | 486,512 |
| Events in quadrant B | 4,965,940 | 486,136 |
| Events in quadrant C | 3,412,633 | 465,522 |
| Events in quadrant D | 5,964,279 | 459,196 |
| Mode SS | |||
|---|---|---|---|
| Quadrant | BADHDUFLAG | Total packets | Discarded packets |
| A | 0 | 130 | 0 |
| B | 0 | 130 | 0 |
| C | 0 | 130 | 0 |
| D | 0 | 130 | 0 |
| Mode M9 | |||
|---|---|---|---|
| Quadrant | BADHDUFLAG | Total packets | Discarded packets |
| A | 0 | 8 | 0 |
| B | 0 | 8 | 0 |
| C | 0 | 8 | 0 |
| D | 0 | 8 | 0 |
| Mode M0 | |||
|---|---|---|---|
| Quadrant | BADHDUFLAG | Total packets | Discarded packets |
| A | 0 | 12988 | 1 |
| B | 0 | 19149 | 1 |
| C | 0 | 14161 | 2 |
| D | 0 | 22641 | 1 |
| Quadrant | Total seconds | Saturated seconds | Saturation percentage |
|---|---|---|---|
| A | 6365 | 57 | 0.895522% |
| B | 6366 | 103 | 1.617970% |
| C | 6365 | 139 | 2.183818% |
| D | 6365 | 188 | 2.953653% |
Noise dominated data is calculated using 1-second bins in cleaned event files. If a bin has >2000 counts, and if more than 50% of those come from <1% of pixels, then it is considered to be noise-dominated and hence unusable.
| Quadrant | # 1 sec bins | Bins with >0 counts | Bins with >2000 counts | High rate bins dominated by noise | Noise dominated (total time) | Noise dominated (detector-on time) | Marked lightcurve |
|---|---|---|---|---|---|---|---|
| A | 7210 | 6366 | 0 | 0 | 0.00% | 0.00% | 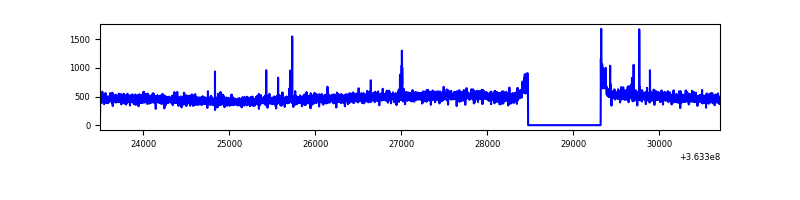 |
| B | 7211 | 6367 | 0 | 0 | 0.00% | 0.00% | 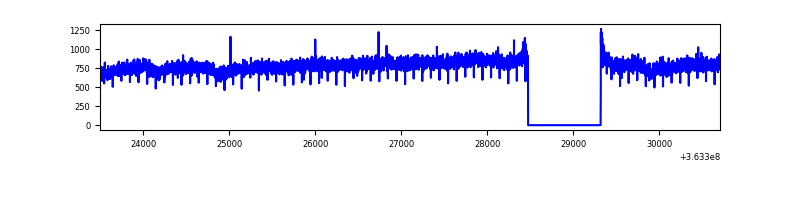 |
| C | 7210 | 6366 | 15 | 15 | 0.21% | 0.24% | 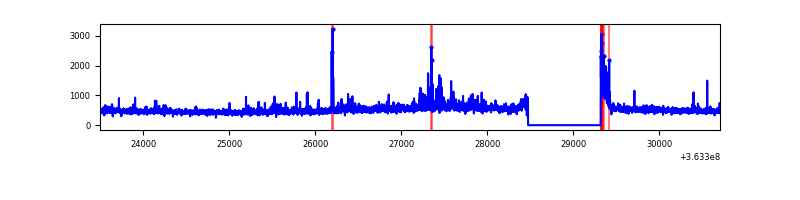 |
| D | 7210 | 6366 | 74 | 74 | 1.03% | 1.16% | 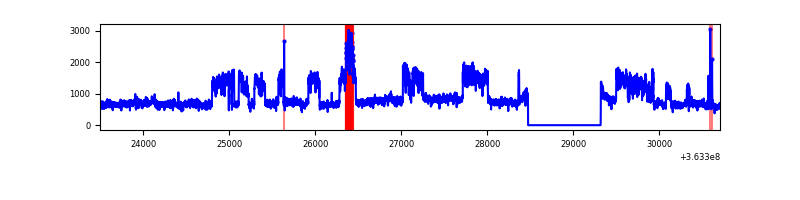 |
Top three noisy pixels from each quadrant. If the there are fewer than three noisy pixels in the level2.evt file, extra rows are filled as -1
| Pixel properties | Quadrant properties | ||||||
|---|---|---|---|---|---|---|---|
| Quadrant | DetID | PixID | Counts | Sigma | Mean | Median | Sigma |
| A | 5 | 16 | 20955 | 127.97 | 781 | 766 | 157.8 |
| A | 13 | 254 | 10680 | 62.84 | 781 | 766 | 157.8 |
| A | 3 | 137 | 8087 | 46.41 | 781 | 766 | 157.8 |
| B | 6 | 159 | 1940975 | 12973.59 | 768 | 748 | 149.6 |
| B | 12 | 111 | 19099 | 122.71 | 768 | 748 | 149.6 |
| B | 11 | 111 | 17833 | 114.24 | 768 | 748 | 149.6 |
| C | 3 | 233 | 238092 | 1346.95 | 741 | 745 | 176.2 |
| C | 14 | 238 | 123038 | 694.02 | 741 | 745 | 176.2 |
| C | 0 | 10 | 113810 | 641.65 | 741 | 745 | 176.2 |
| D | 8 | 195 | 3122897 | 17584.68 | 747 | 731 | 177.6 |
| D | 12 | 79 | 24584 | 134.34 | 747 | 731 | 177.6 |
| D | 2 | 234 | 23018 | 125.52 | 747 | 731 | 177.6 |
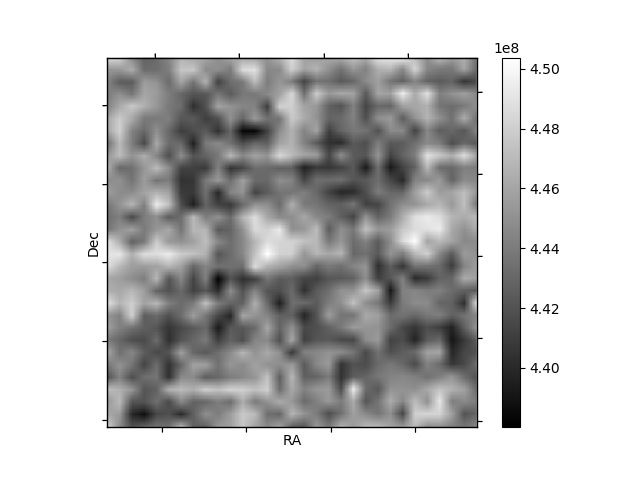
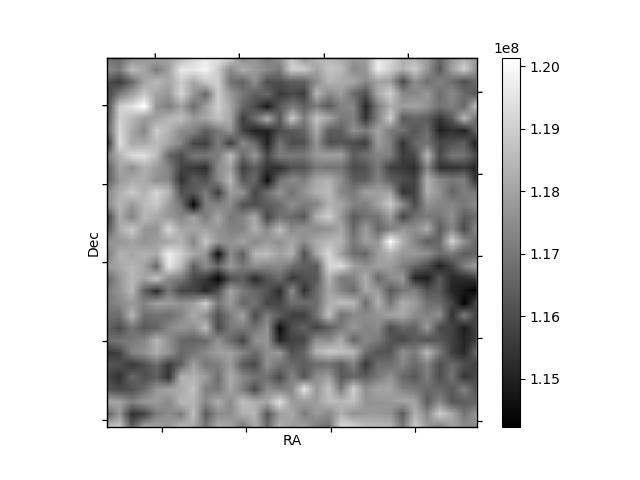
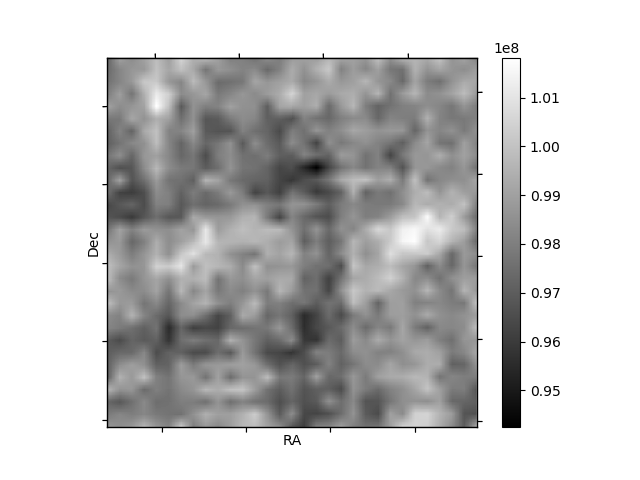
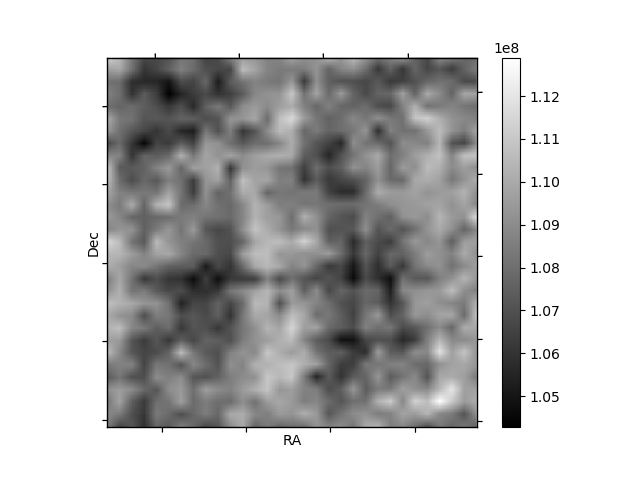
Histogram calculated using DETX and DETY for each event in the final _common_clean file
| Quadrant A | 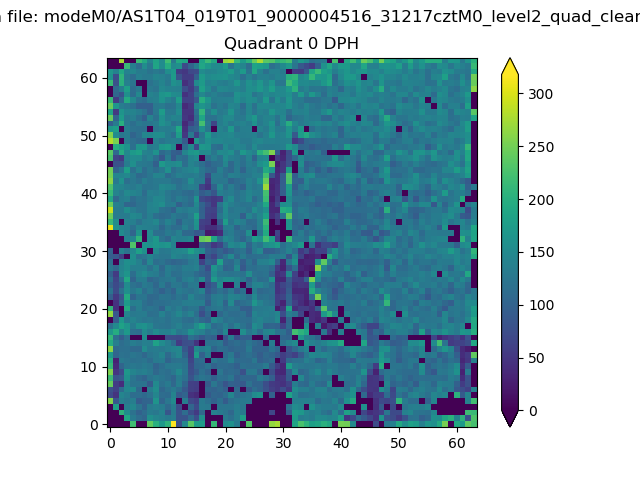 |
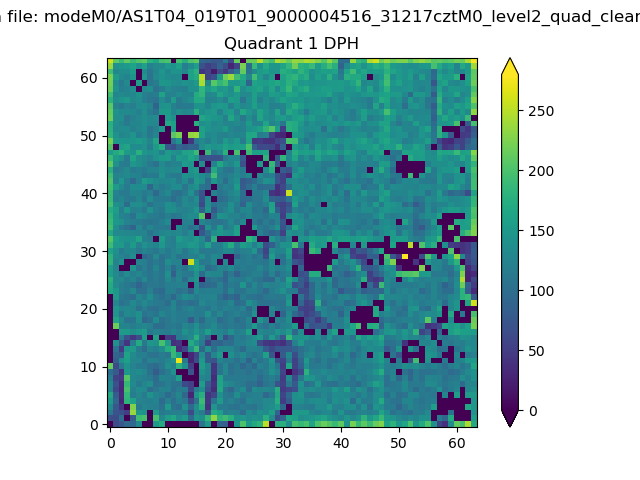 |
Quadrant B |
|---|---|---|---|
| Quadrant D | 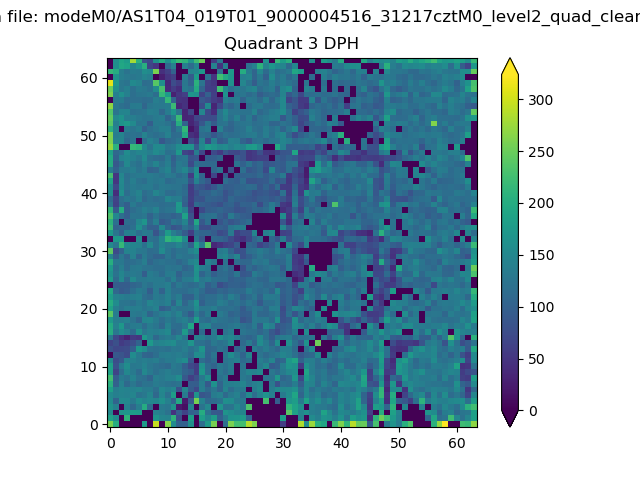 |
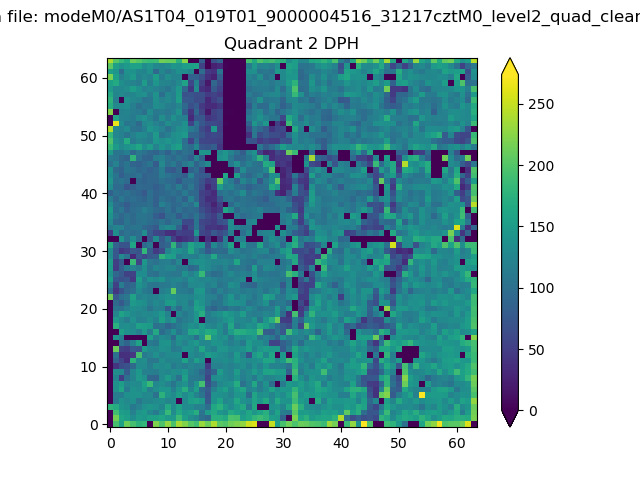 |
Quadrant C |
| Plot type | Count rate plots | Images |
|---|---|---|
| Comparison with Poisson distribution Blue bars denote a histogram of data divided into 1 sec bins. Red curve is a Poisson curve with rate = median count rate of data. |
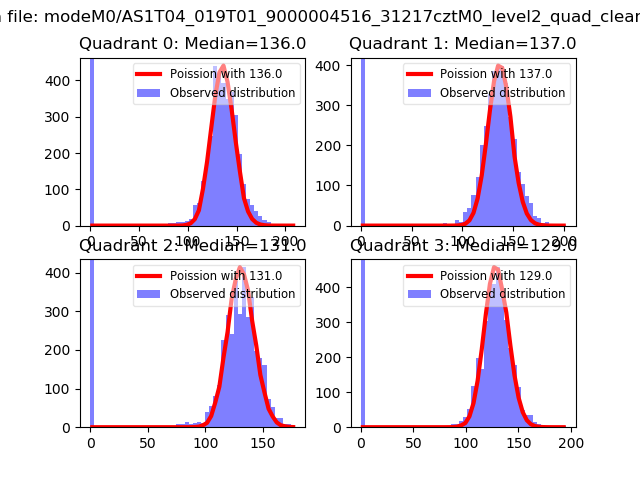 |
 |
| Quadrant-wise count rates Data is divided into 100 sec bins |
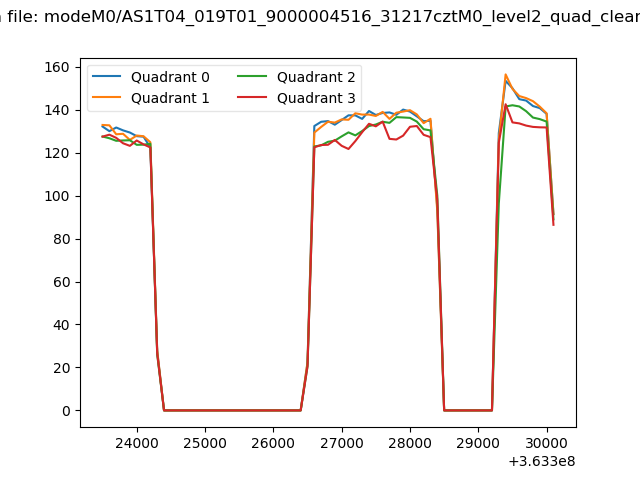 |
|
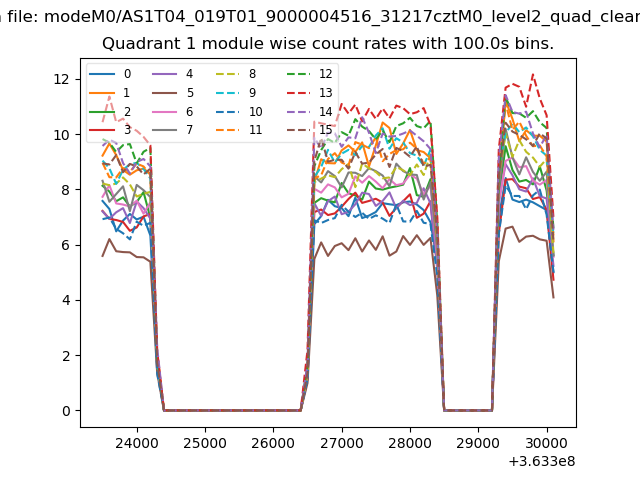
| Module-wise count rates for Quadrant A Data is divided into 100 sec bins |
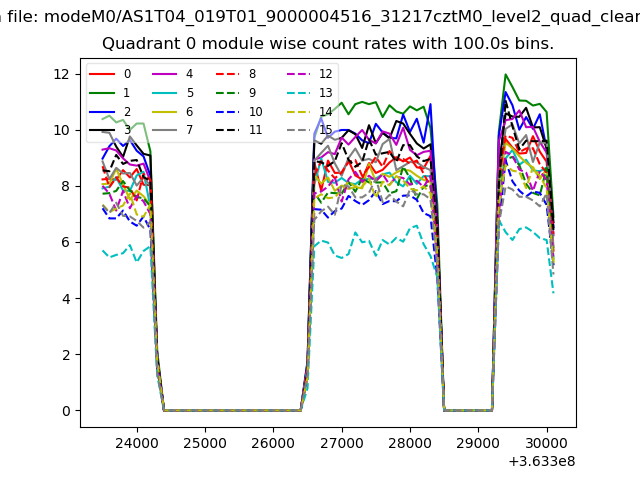 |
 |
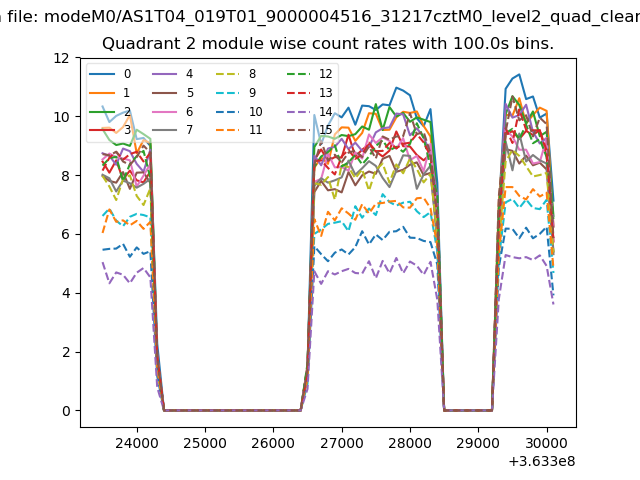
| Module-wise count rates for Quadrant B Data is divided into 100 sec bins |
 |
 |
| Module-wise count rates for Quadrant C Data is divided into 100 sec bins |
 |
 |
| Module-wise count rates for Quadrant D Data is divided into 100 sec bins |
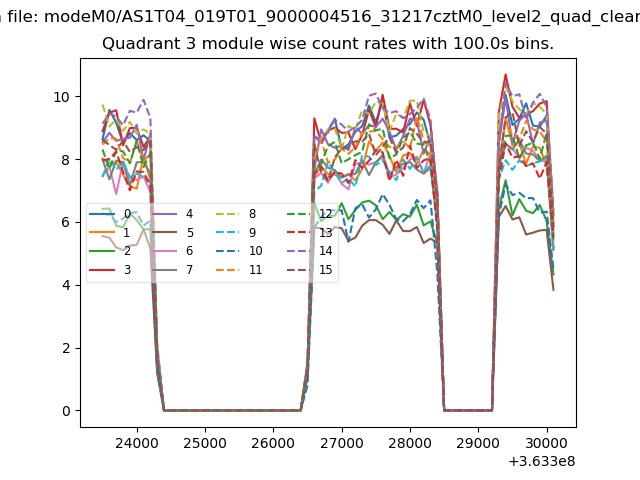 |
 |
| Parameter | Plot |
|---|---|
| CZT HV Monitor | 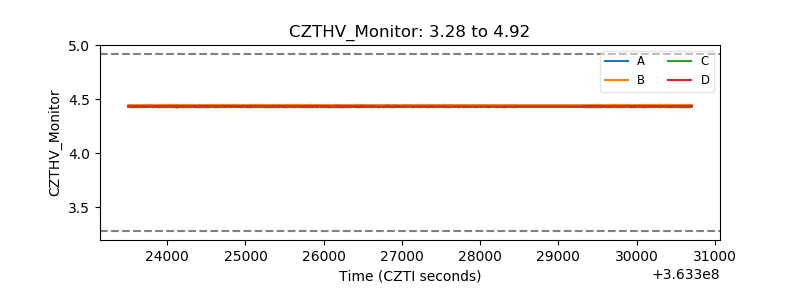 |
| D_VDD |  |
| Temperature 1 |  |
| Veto HV Monitor | 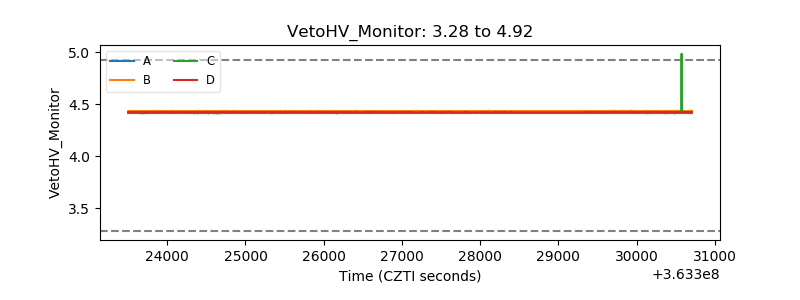 |
| Veto LLD | 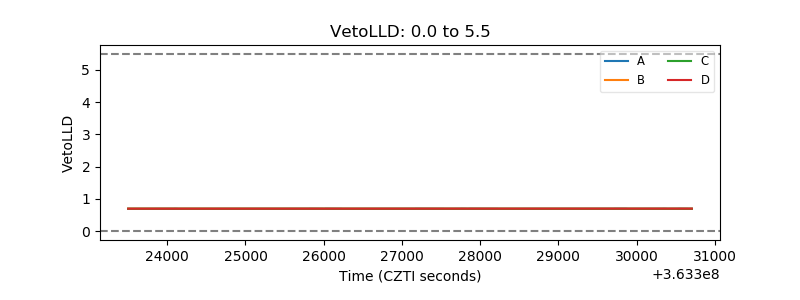 |
| Alpha Counter | 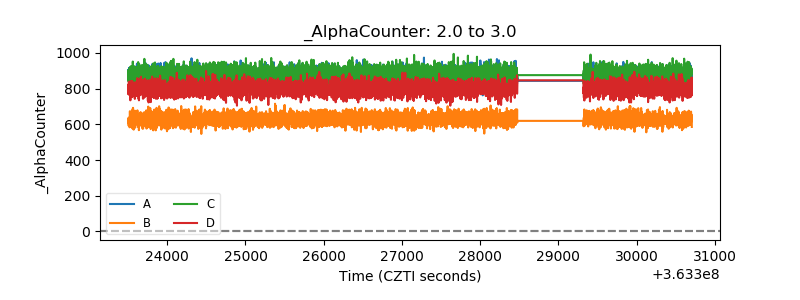 |
| _CPM_Rate | 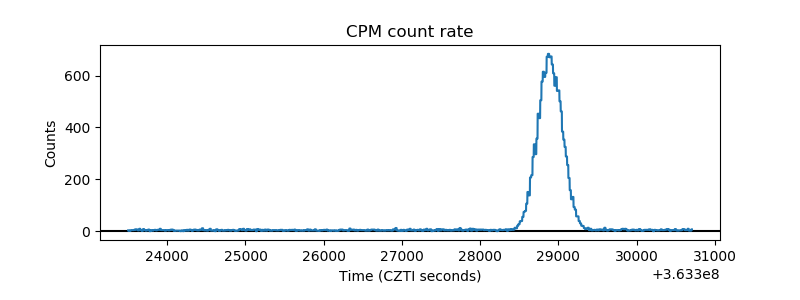 |
| CZT Counter | 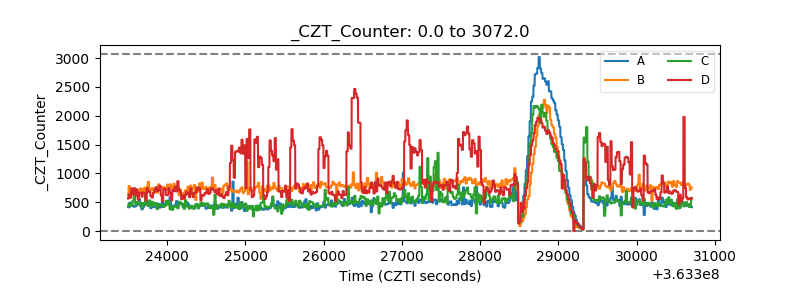 |
| +2.5 Volts monitor |  |
| +5 Volts monitor |  |
| _ROLL_ROT | 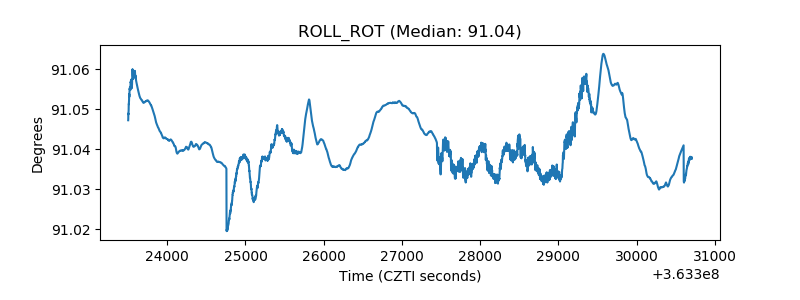 |
| _Roll_DEC | 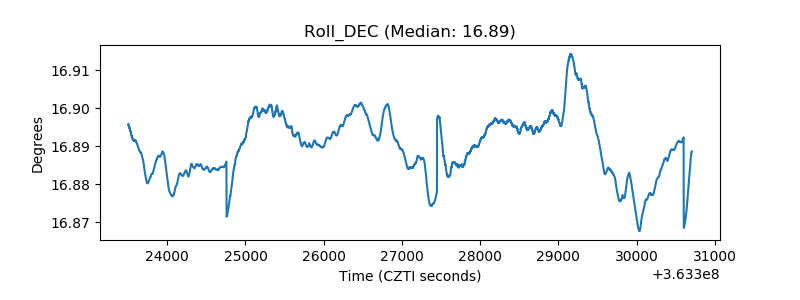 |
| _Roll_RA | 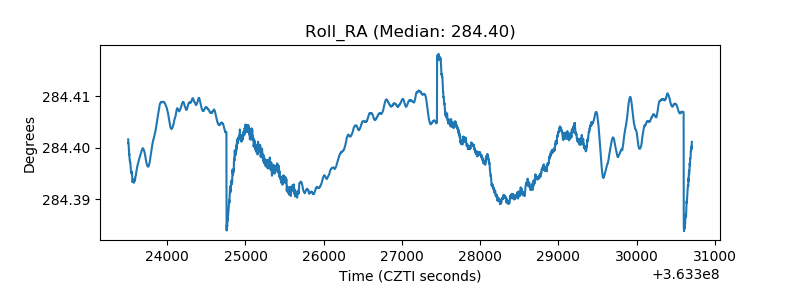 |
| Veto Counter | 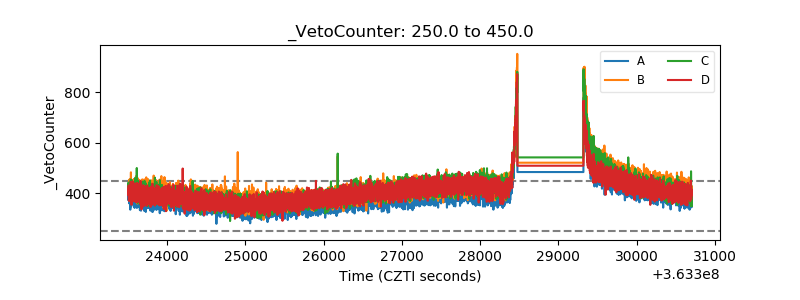 |