| Param | Original file | Final file |
|---|---|---|
| Filename | modeM0/AS1T04_019T01_9000004516_31218cztM0_level2.evt | modeM0/AS1T04_019T01_9000004516_31218cztM0_level2_quad_clean.evt |
| Size (bytes) | 444,139,200 | 58,944,960 |
| Size | 423.6 MB | 56.2 MB |
| Events in quadrant A | 2,373,963 | 370,290 |
| Events in quadrant B | 3,877,176 | 370,775 |
| Events in quadrant C | 2,539,146 | 352,236 |
| Events in quadrant D | 4,326,904 | 346,008 |
| Mode SS | |||
|---|---|---|---|
| Quadrant | BADHDUFLAG | Total packets | Discarded packets |
| A | 0 | 100 | 0 |
| B | 0 | 100 | 0 |
| C | 0 | 100 | 0 |
| D | 0 | 100 | 0 |
| Mode M9 | |||
|---|---|---|---|
| Quadrant | BADHDUFLAG | Total packets | Discarded packets |
| A | 0 | 8 | 0 |
| B | 0 | 8 | 0 |
| C | 0 | 8 | 0 |
| D | 0 | 8 | 0 |
| Mode M0 | |||
|---|---|---|---|
| Quadrant | BADHDUFLAG | Total packets | Discarded packets |
| A | 0 | 10078 | 1 |
| B | 0 | 14826 | 1 |
| C | 0 | 10472 | 1 |
| D | 0 | 16576 | 1 |
| Quadrant | Total seconds | Saturated seconds | Saturation percentage |
|---|---|---|---|
| A | 4924 | 57 | 1.157595% |
| B | 4924 | 87 | 1.766856% |
| C | 4924 | 124 | 2.518278% |
| D | 4924 | 121 | 2.457352% |
Noise dominated data is calculated using 1-second bins in cleaned event files. If a bin has >2000 counts, and if more than 50% of those come from <1% of pixels, then it is considered to be noise-dominated and hence unusable.
| Quadrant | # 1 sec bins | Bins with >0 counts | Bins with >2000 counts | High rate bins dominated by noise | Noise dominated (total time) | Noise dominated (detector-on time) | Marked lightcurve |
|---|---|---|---|---|---|---|---|
| A | 5769 | 4925 | 0 | 0 | 0.00% | 0.00% | 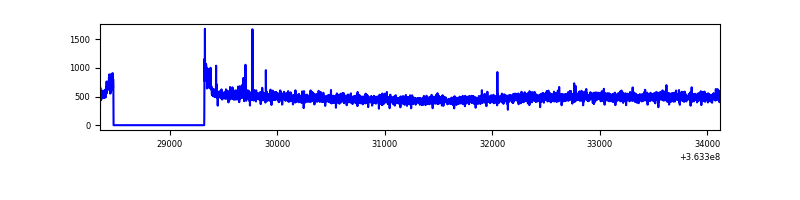 |
| B | 5769 | 4925 | 0 | 0 | 0.00% | 0.00% | 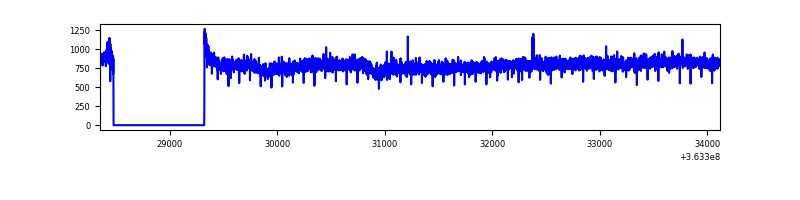 |
| C | 5769 | 4925 | 11 | 11 | 0.19% | 0.22% | 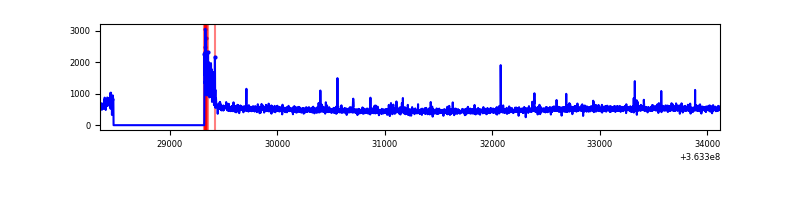 |
| D | 5769 | 4925 | 65 | 65 | 1.13% | 1.32% | 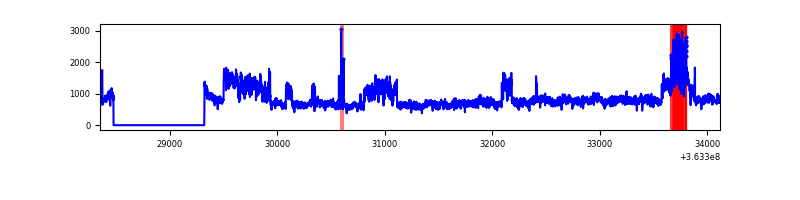 |
Top three noisy pixels from each quadrant. If the there are fewer than three noisy pixels in the level2.evt file, extra rows are filled as -1
| Pixel properties | Quadrant properties | ||||||
|---|---|---|---|---|---|---|---|
| Quadrant | DetID | PixID | Counts | Sigma | Mean | Median | Sigma |
| A | 5 | 16 | 9805 | 74.31 | 613 | 602 | 123.8 |
| A | 13 | 254 | 7888 | 58.83 | 613 | 602 | 123.8 |
| A | 3 | 137 | 6355 | 46.46 | 613 | 602 | 123.8 |
| B | 6 | 159 | 1512331 | 12875.88 | 601 | 586 | 117.4 |
| B | 12 | 111 | 14915 | 122.04 | 601 | 586 | 117.4 |
| B | 11 | 111 | 13687 | 111.58 | 601 | 586 | 117.4 |
| C | 14 | 238 | 100489 | 725.41 | 580 | 586 | 137.7 |
| C | 0 | 10 | 98798 | 713.13 | 580 | 586 | 137.7 |
| C | 3 | 233 | 31689 | 225.84 | 580 | 586 | 137.7 |
| D | 8 | 195 | 2093777 | 15129.5 | 585 | 572 | 138.4 |
| D | 12 | 79 | 23873 | 168.42 | 585 | 572 | 138.4 |
| D | 2 | 234 | 15980 | 111.37 | 585 | 572 | 138.4 |
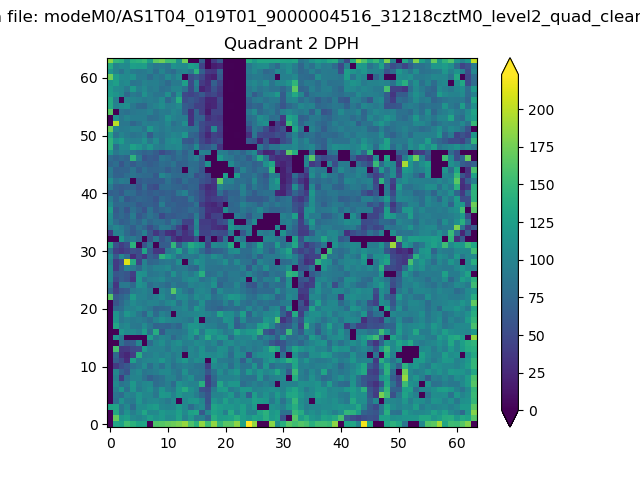
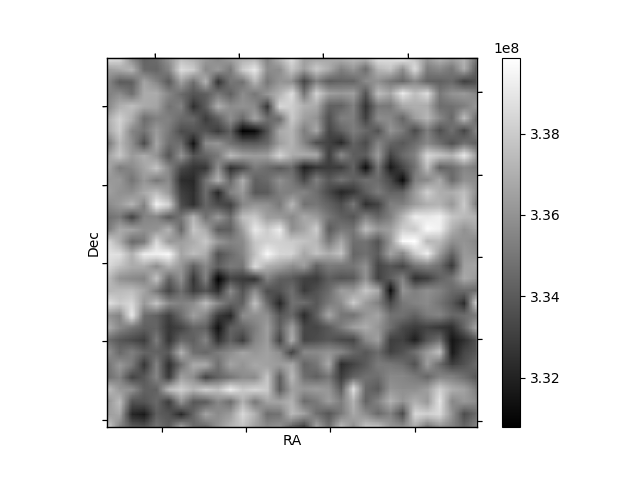
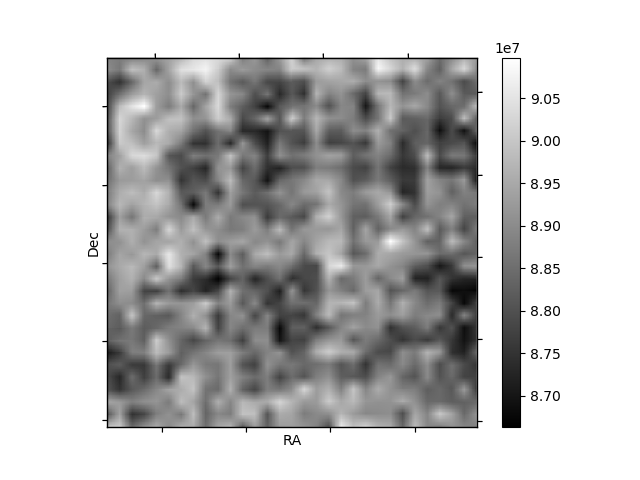
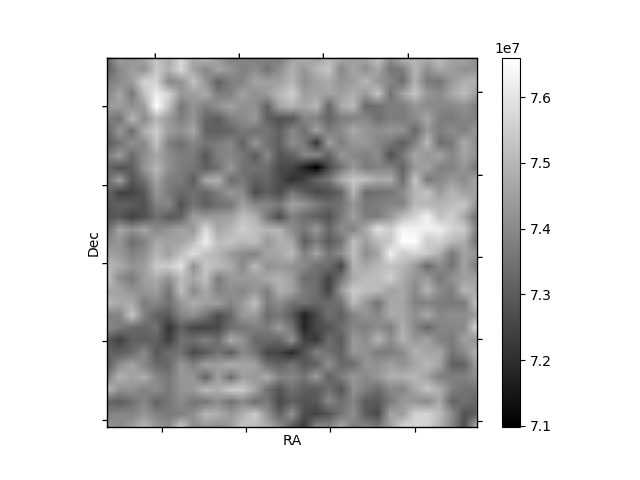
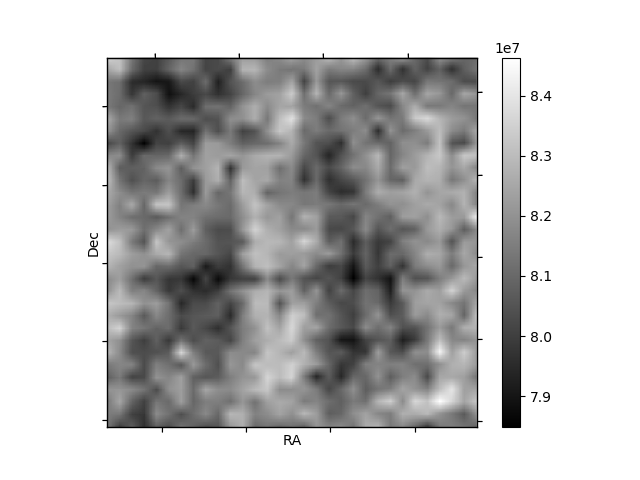
Histogram calculated using DETX and DETY for each event in the final _common_clean file
| Quadrant A | 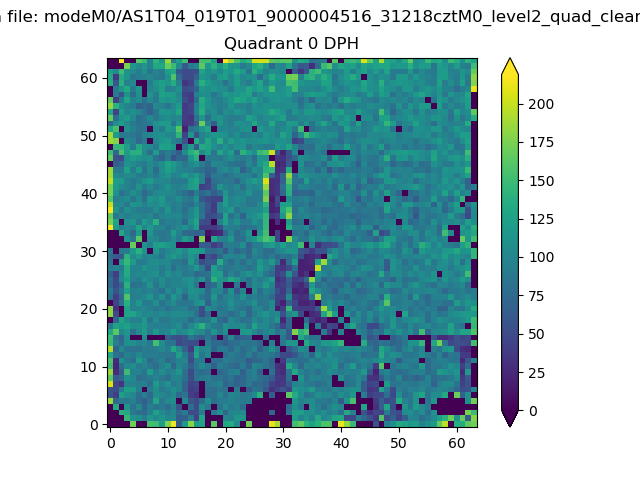 |
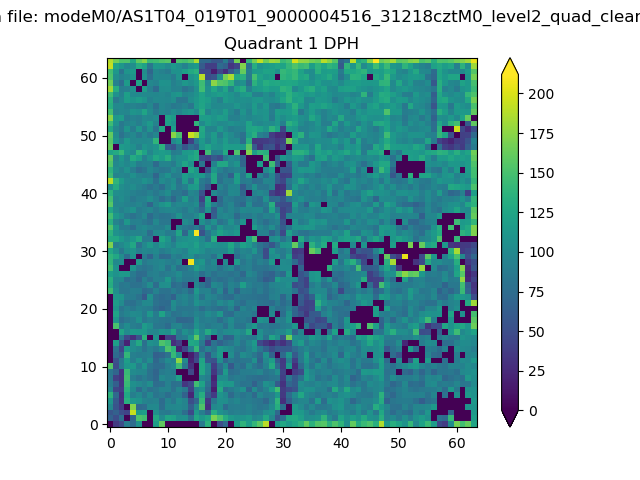 |
Quadrant B |
|---|---|---|---|
| Quadrant D | 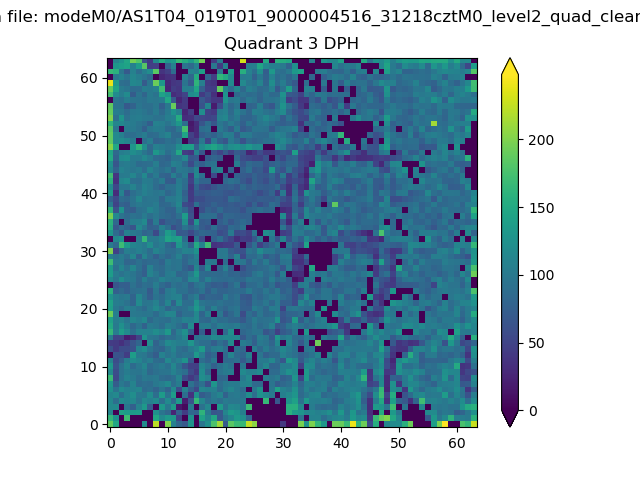 |
 |
Quadrant C |
| Plot type | Count rate plots | Images |
|---|---|---|
| Comparison with Poisson distribution Blue bars denote a histogram of data divided into 1 sec bins. Red curve is a Poisson curve with rate = median count rate of data. |
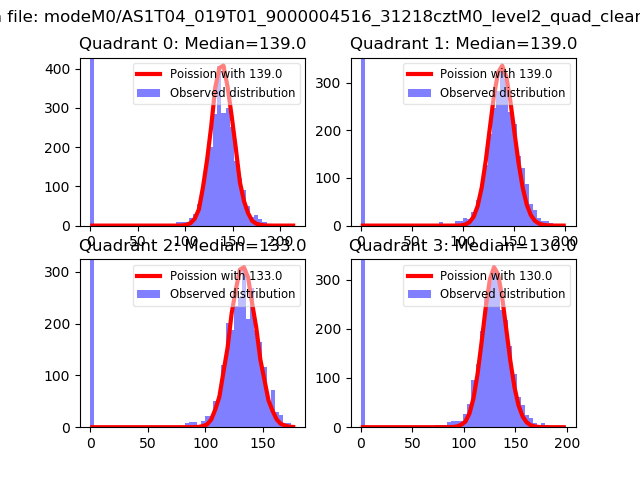 |
 |
| Quadrant-wise count rates Data is divided into 100 sec bins |
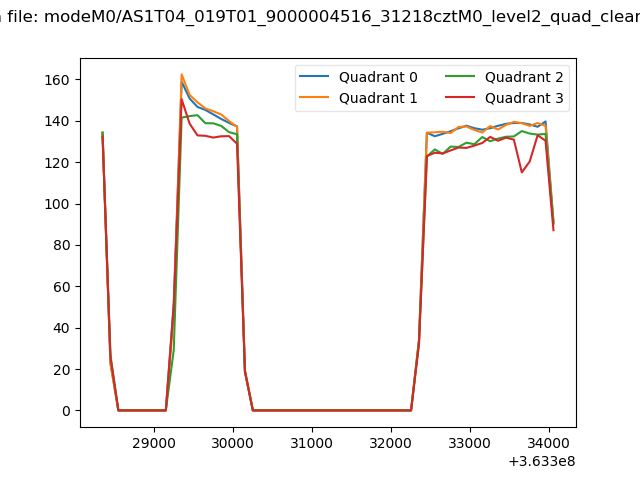 |
|
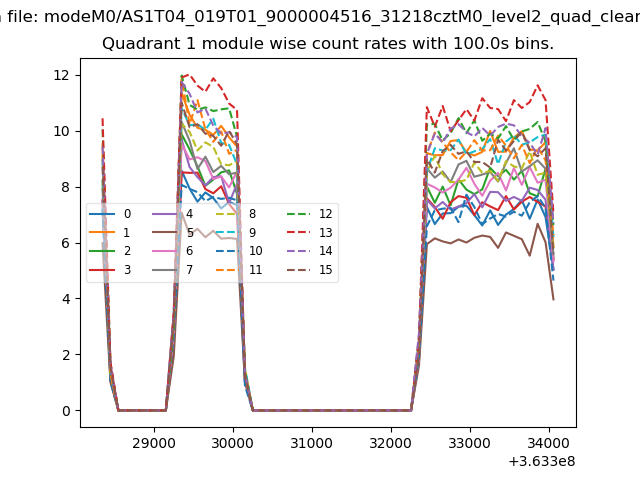
| Module-wise count rates for Quadrant A Data is divided into 100 sec bins |
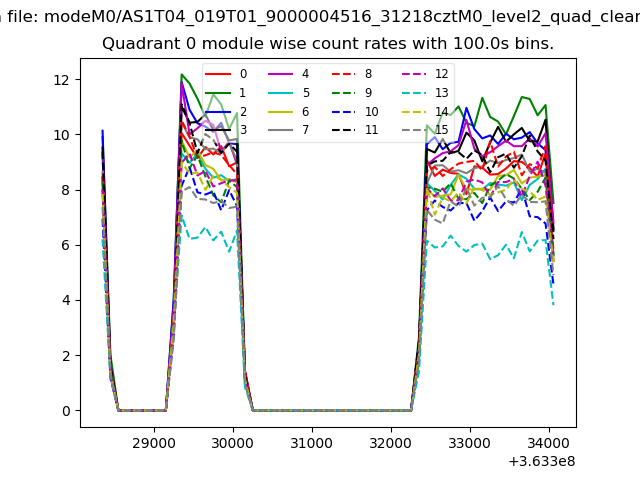 |
 |
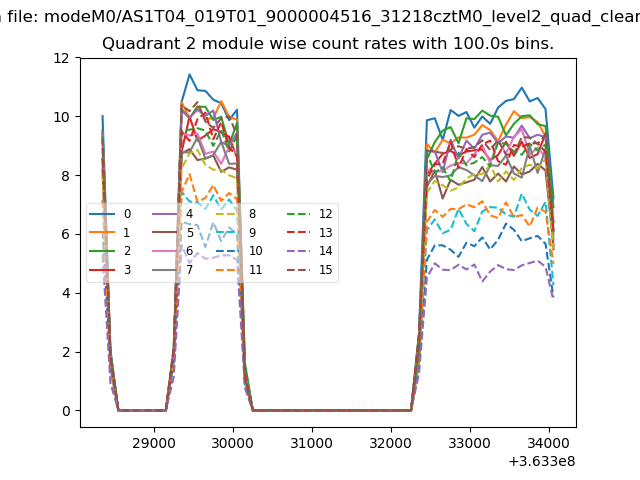
| Module-wise count rates for Quadrant B Data is divided into 100 sec bins |
 |
 |
| Module-wise count rates for Quadrant C Data is divided into 100 sec bins |
 |
 |
| Module-wise count rates for Quadrant D Data is divided into 100 sec bins |
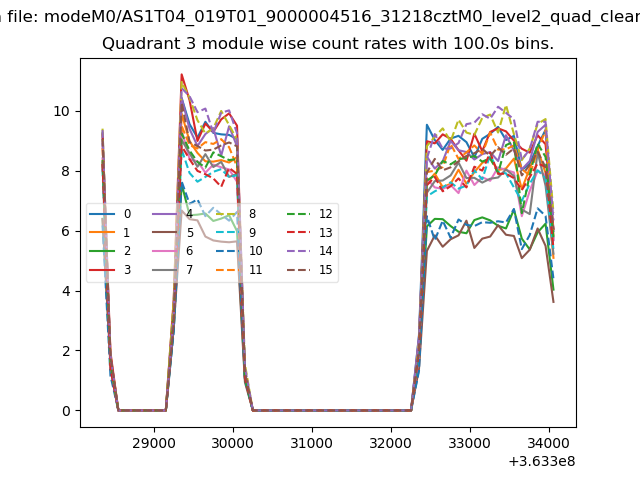 |
 |
| Parameter | Plot |
|---|---|
| CZT HV Monitor | 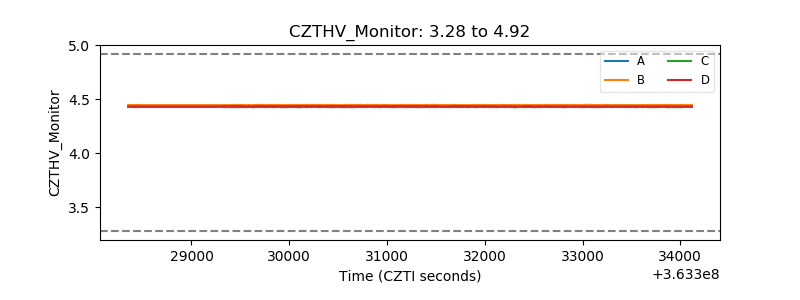 |
| D_VDD | 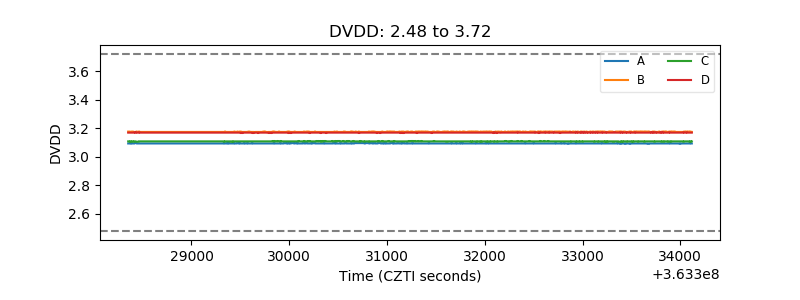 |
| Temperature 1 | 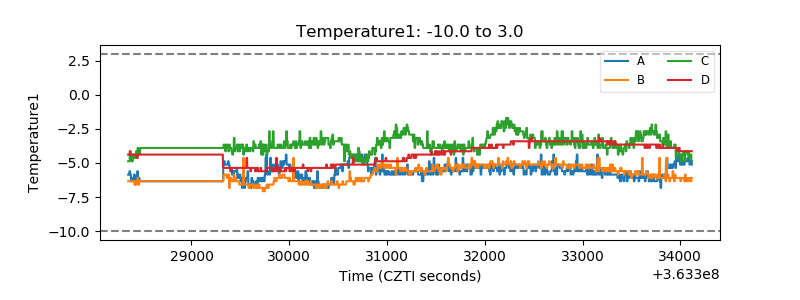 |
| Veto HV Monitor | 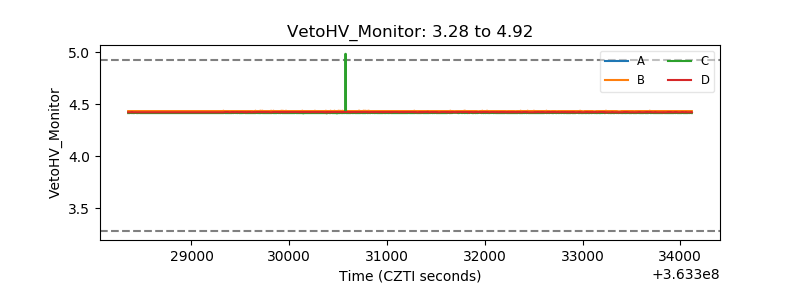 |
| Veto LLD | 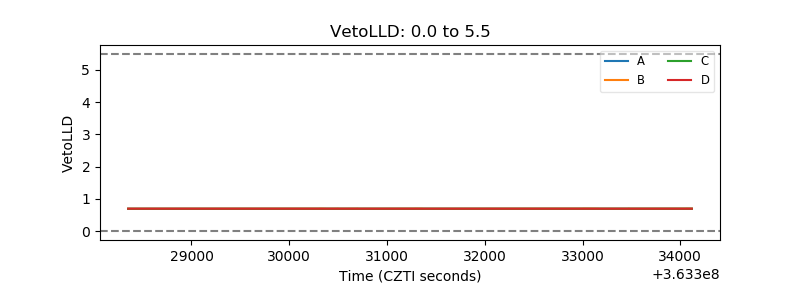 |
| Alpha Counter | 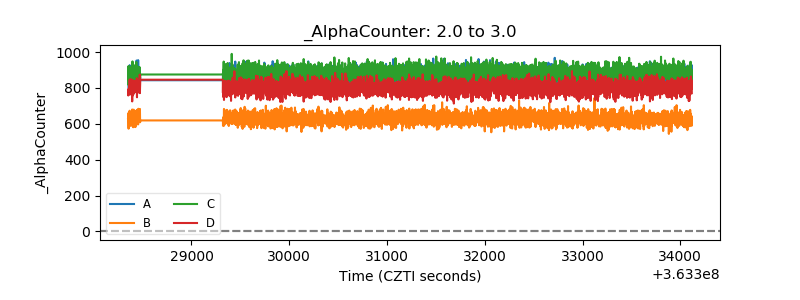 |
| _CPM_Rate | 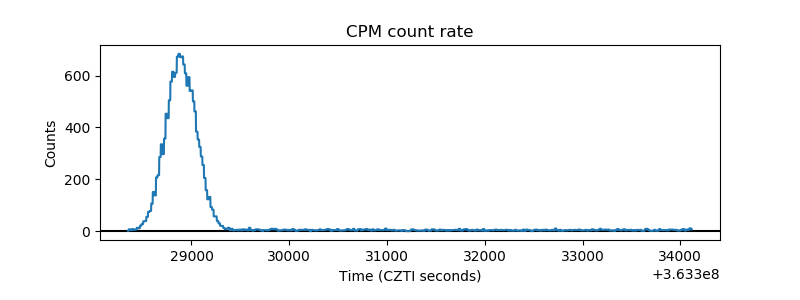 |
| CZT Counter | 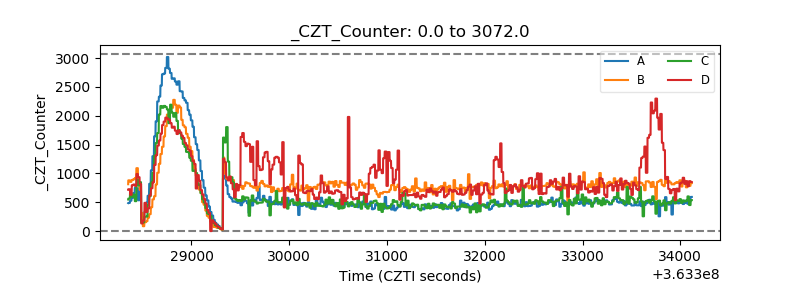 |
| +2.5 Volts monitor |  |
| +5 Volts monitor |  |
| _ROLL_ROT | 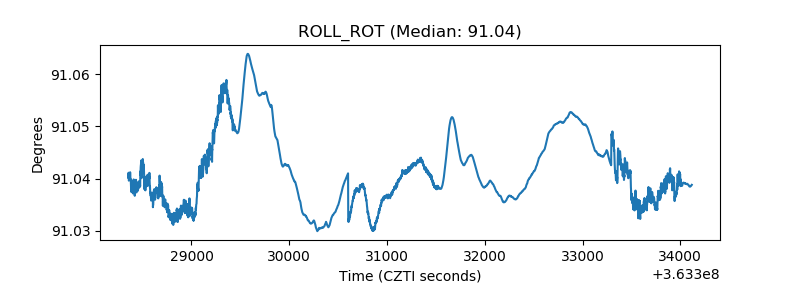 |
| _Roll_DEC | 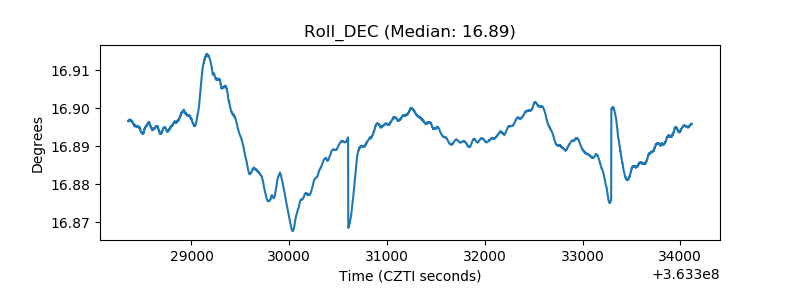 |
| _Roll_RA | 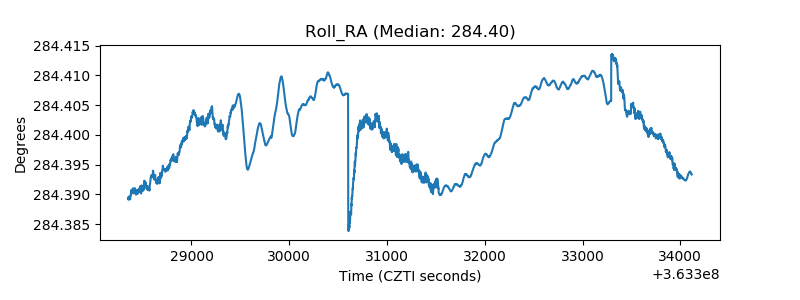 |
| Veto Counter | 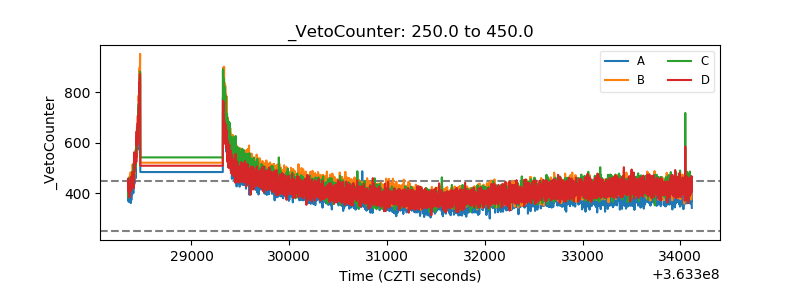 |