| Param | Original file | Final file |
|---|---|---|
| Filename | modeM0/AS1C06_002T02_9000004518cztM0_level2.fits | modeM0/AS1C06_002T02_9000004518cztM0_level2_quad_clean.evt |
| Size (bytes) | 724,449,600 | 713,678,400 |
| Size | 690.9 MB | 680.6 MB |
| Events in quadrant A | 4,610,212 | 4,466,768 |
| Events in quadrant B | 4,132,010 | 4,166,871 |
| Events in quadrant C | 4,351,272 | 4,186,605 |
| Events in quadrant D | 3,797,220 | 3,747,064 |
| Mode SS | |||
|---|---|---|---|
| Quadrant | BADHDUFLAG | Total packets | Discarded packets |
| A | 0 | 1506 | 0 |
| B | 0 | 1506 | 0 |
| C | 0 | 1506 | 0 |
| D | 0 | 1508 | 0 |
| Mode M9 | |||
|---|---|---|---|
| Quadrant | BADHDUFLAG | Total packets | Discarded packets |
| A | 0 | 131 | 0 |
| B | 0 | 131 | 0 |
| C | 0 | 131 | 0 |
| D | 0 | 131 | 0 |
| Mode M0 | |||
|---|---|---|---|
| Quadrant | BADHDUFLAG | Total packets | Discarded packets |
| A | 0 | 153588 | 0 |
| B | 0 | 250290 | 0 |
| C | 0 | 168838 | 0 |
| D | 0 | 259146 | 0 |
| Quadrant | Total seconds | Saturated seconds | Saturation percentage |
|---|---|---|---|
| A | 73606 | 697 | 0.946934% |
| B | 73499 | 5084 | 6.917101% |
| C | 73574 | 2477 | 3.366678% |
| D | 73563 | 4223 | 5.740658% |
Noise dominated data is calculated using 1-second bins in cleaned event files. If a bin has >2000 counts, and if more than 50% of those come from <1% of pixels, then it is considered to be noise-dominated and hence unusable.
| Quadrant | # 1 sec bins | Bins with >0 counts | Bins with >2000 counts | High rate bins dominated by noise | Noise dominated (total time) | Noise dominated (detector-on time) | Marked lightcurve |
|---|---|---|---|---|---|---|---|
| A | 82889 | 72194 | 0 | 0 | 0.00% | 0.00% |  |
| B | 82889 | 72179 | 0 | 0 | 0.00% | 0.00% |  |
| C | 82889 | 72192 | 0 | 0 | 0.00% | 0.00% |  |
| D | 82889 | 72172 | 0 | 0 | 0.00% | 0.00% |  |
Top three noisy pixels from each quadrant. If the there are fewer than three noisy pixels in the level2.evt file, extra rows are filled as -1
| Pixel properties | Quadrant properties | ||||||
|---|---|---|---|---|---|---|---|
| Quadrant | DetID | PixID | Counts | Sigma | Mean | Median | Sigma |
| A | 0 | 29 | 4571 | 12.02 | 1202 | 1140 | 285.3 |
| A | 7 | 110 | 3709 | 9.0 | 1202 | 1140 | 285.3 |
| A | 0 | 30 | 3546 | 8.43 | 1202 | 1140 | 285.3 |
| B | 2 | 9 | 3335 | 10.58 | 1098 | 1054 | 215.5 |
| B | 2 | 8 | 2782 | 8.02 | 1098 | 1054 | 215.5 |
| B | 3 | 80 | 2781 | 8.01 | 1098 | 1054 | 215.5 |
| C | 12 | 241 | 3038 | 6.72 | 1154 | 1087 | 290.4 |
| C | 3 | 187 | 3020 | 6.66 | 1154 | 1087 | 290.4 |
| C | 9 | 209 | 2917 | 6.3 | 1154 | 1087 | 290.4 |
| D | 3 | 14 | 2708 | 6.0 | 1086 | 998 | 284.8 |
| D | 10 | 189 | 2704 | 5.99 | 1086 | 998 | 284.8 |
| D | 6 | 38 | 2668 | 5.86 | 1086 | 998 | 284.8 |
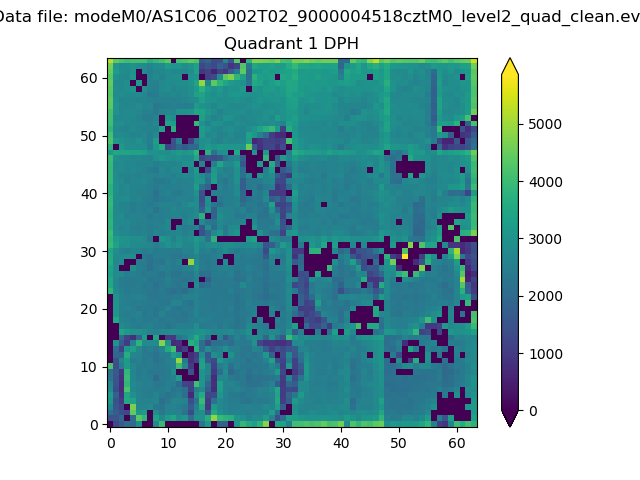
Histogram calculated using DETX and DETY for each event in the final _common_clean file
| Quadrant A |  |
 |
Quadrant B |
|---|---|---|---|
| Quadrant D |  |
 |
Quadrant C |
| Plot type | Count rate plots | Images |
|---|---|---|
| Comparison with Poisson distribution Blue bars denote a histogram of data divided into 1 sec bins. Red curve is a Poisson curve with rate = median count rate of data. |
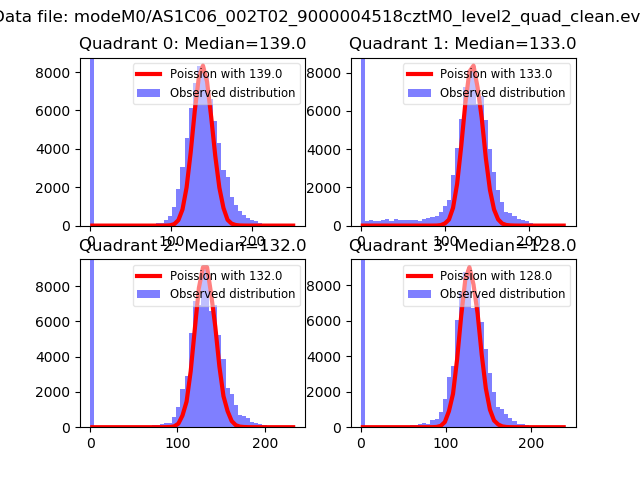 |
 |
| Quadrant-wise count rates Data is divided into 100 sec bins |
 |
|
| Module-wise count rates for Quadrant A Data is divided into 100 sec bins |
 |
 |
| Module-wise count rates for Quadrant B Data is divided into 100 sec bins |
 |
 |
| Module-wise count rates for Quadrant C Data is divided into 100 sec bins |
 |
 |
| Module-wise count rates for Quadrant D Data is divided into 100 sec bins |
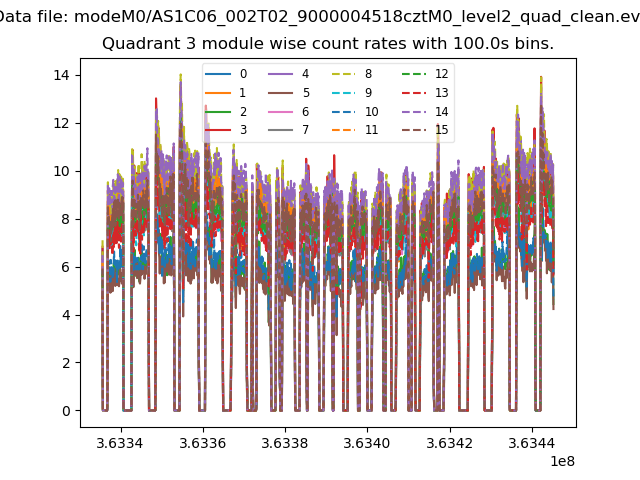 |
 |
| Parameter | Plot |
|---|---|
| CZT HV Monitor |  |
| D_VDD |  |
| Temperature 1 |  |
| Veto HV Monitor |  |
| Veto LLD |  |
| Alpha Counter |  |
| _CPM_Rate |  |
| CZT Counter |  |
| +2.5 Volts monitor |  |
| +5 Volts monitor |  |
| _ROLL_ROT |  |
| _Roll_DEC |  |
| _Roll_RA |  |
| Veto Counter |  |