| Param | Original file | Final file |
|---|---|---|
| Filename | modeM0/AS1C06_002T02_9000004518_31222cztM0_level2.evt | modeM0/AS1C06_002T02_9000004518_31222cztM0_level2_quad_clean.evt |
| Size (bytes) | 763,165,440 | 133,822,080 |
| Size | 727.8 MB | 127.6 MB |
| Events in quadrant A | 3,555,253 | 968,801 |
| Events in quadrant B | 7,983,375 | 861,424 |
| Events in quadrant C | 4,084,840 | 900,813 |
| Events in quadrant D | 7,047,794 | 864,998 |
| Mode SS | |||
|---|---|---|---|
| Quadrant | BADHDUFLAG | Total packets | Discarded packets |
| A | 0 | 134 | 0 |
| B | 0 | 134 | 0 |
| C | 0 | 134 | 0 |
| D | 0 | 134 | 0 |
| Mode M9 | |||
|---|---|---|---|
| Quadrant | BADHDUFLAG | Total packets | Discarded packets |
| A | 0 | 13 | 0 |
| B | 0 | 13 | 0 |
| C | 0 | 13 | 0 |
| D | 0 | 13 | 0 |
| Mode M0 | |||
|---|---|---|---|
| Quadrant | BADHDUFLAG | Total packets | Discarded packets |
| A | 0 | 14668 | 2 |
| B | 0 | 28066 | 2 |
| C | 0 | 16196 | 2 |
| D | 0 | 25441 | 2 |
| Quadrant | Total seconds | Saturated seconds | Saturation percentage |
|---|---|---|---|
| A | 6541 | 109 | 1.666412% |
| B | 6542 | 1395 | 21.323754% |
| C | 6542 | 300 | 4.585754% |
| D | 6542 | 608 | 9.293794% |
Noise dominated data is calculated using 1-second bins in cleaned event files. If a bin has >2000 counts, and if more than 50% of those come from <1% of pixels, then it is considered to be noise-dominated and hence unusable.
| Quadrant | # 1 sec bins | Bins with >0 counts | Bins with >2000 counts | High rate bins dominated by noise | Noise dominated (total time) | Noise dominated (detector-on time) | Marked lightcurve |
|---|---|---|---|---|---|---|---|
| A | 7816 | 6542 | 0 | 0 | 0.00% | 0.00% | 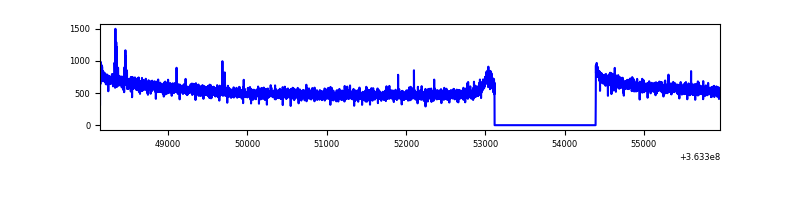 |
| B | 7817 | 6543 | 835 | 835 | 10.68% | 12.76% | 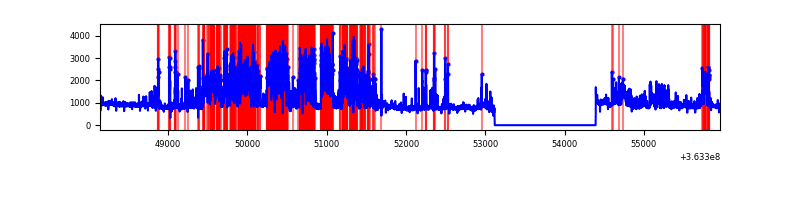 |
| C | 7817 | 6543 | 91 | 91 | 1.16% | 1.39% | 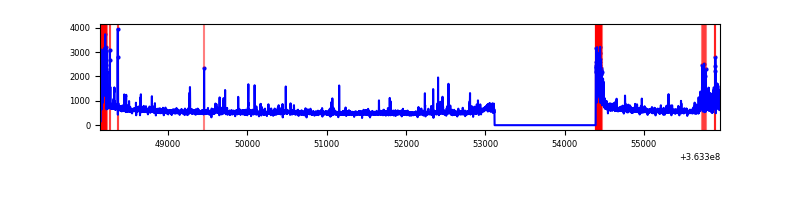 |
| D | 7817 | 6543 | 504 | 504 | 6.45% | 7.70% | 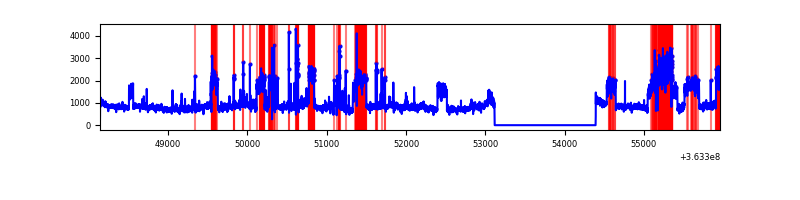 |
Top three noisy pixels from each quadrant. If the there are fewer than three noisy pixels in the level2.evt file, extra rows are filled as -1
| Pixel properties | Quadrant properties | ||||||
|---|---|---|---|---|---|---|---|
| Quadrant | DetID | PixID | Counts | Sigma | Mean | Median | Sigma |
| A | 5 | 16 | 16428 | 85.88 | 918 | 901 | 180.8 |
| A | 13 | 254 | 12768 | 65.64 | 918 | 901 | 180.8 |
| A | 0 | 226 | 8047 | 39.53 | 918 | 901 | 180.8 |
| B | 4 | 80 | 2620873 | 17226.3 | 829 | 811 | 152.1 |
| B | 6 | 159 | 1665727 | 10946.44 | 829 | 811 | 152.1 |
| B | 0 | 190 | 255759 | 1676.22 | 829 | 811 | 152.1 |
| C | 0 | 10 | 403212 | 2082.67 | 843 | 850 | 193.2 |
| C | 14 | 238 | 140597 | 723.35 | 843 | 850 | 193.2 |
| C | 15 | 208 | 116869 | 600.53 | 843 | 850 | 193.2 |
| D | 8 | 195 | 3471707 | 15803.41 | 855 | 843 | 219.6 |
| D | 13 | 249 | 158437 | 717.55 | 855 | 843 | 219.6 |
| D | 2 | 250 | 94669 | 427.21 | 855 | 843 | 219.6 |
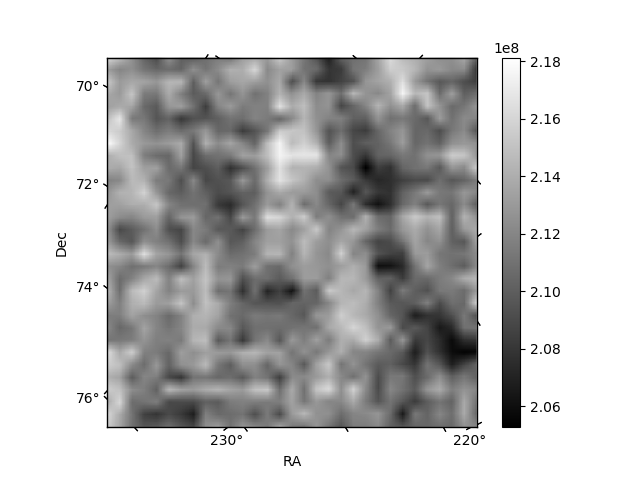
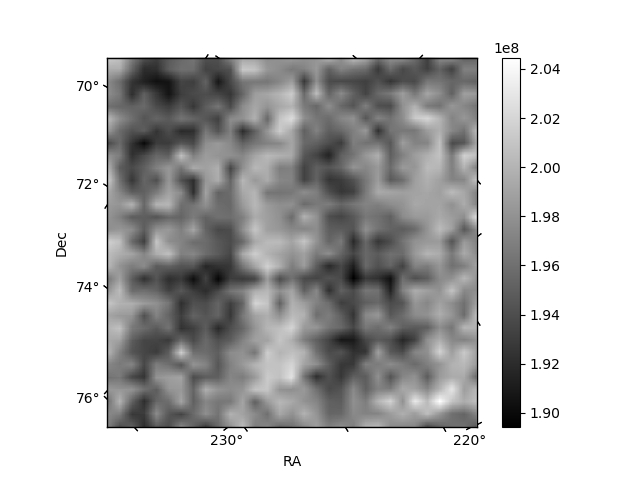
Histogram calculated using DETX and DETY for each event in the final _common_clean file
| Quadrant A | 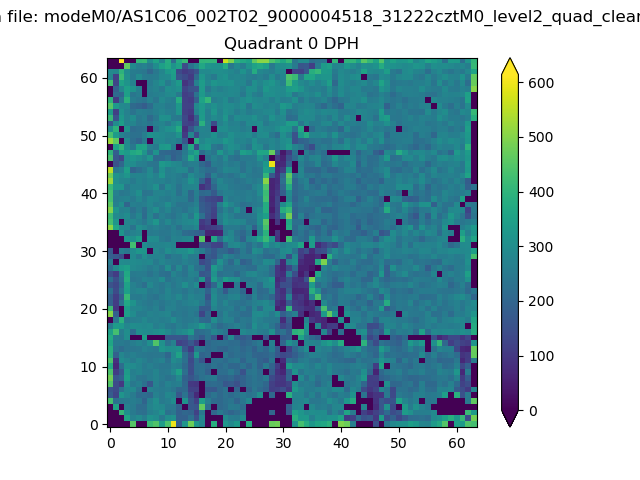 |
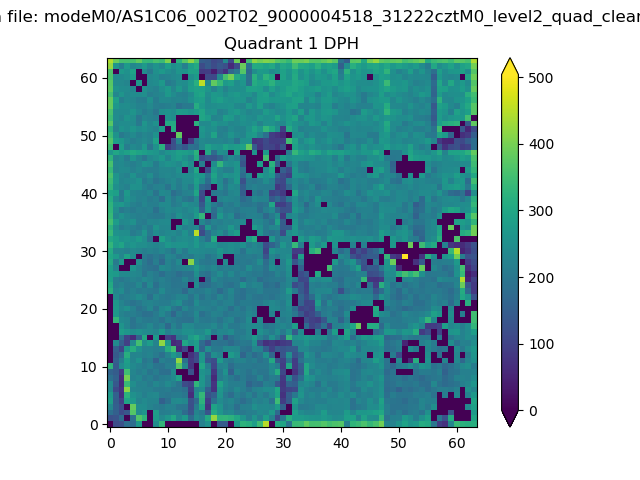 |
Quadrant B |
|---|---|---|---|
| Quadrant D | 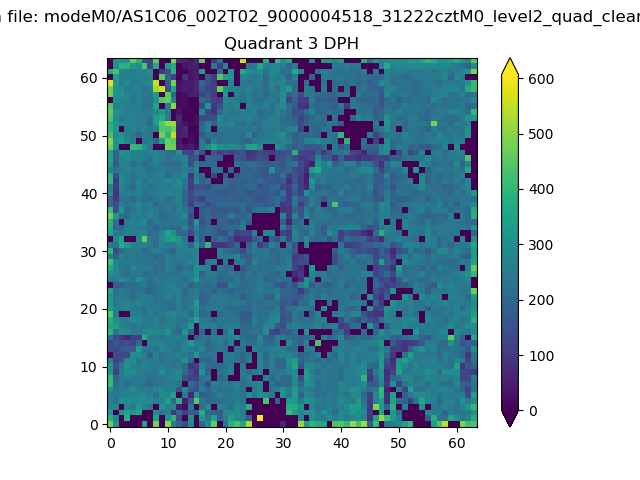 |
 |
Quadrant C |
| Plot type | Count rate plots | Images |
|---|---|---|
| Comparison with Poisson distribution Blue bars denote a histogram of data divided into 1 sec bins. Red curve is a Poisson curve with rate = median count rate of data. |
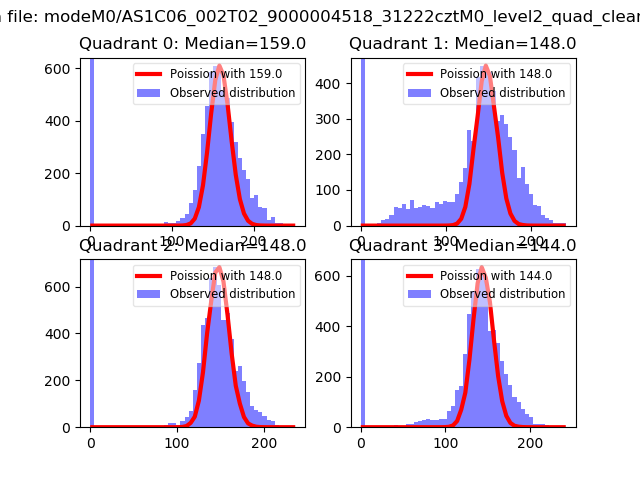 |
 |
| Quadrant-wise count rates Data is divided into 100 sec bins |
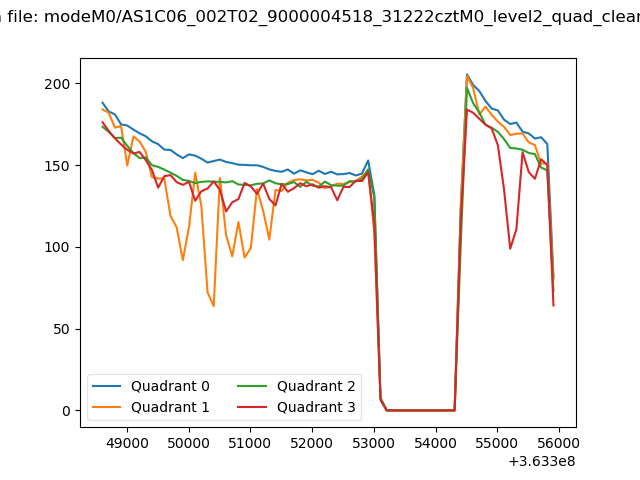 |
|
| Module-wise count rates for Quadrant A Data is divided into 100 sec bins |
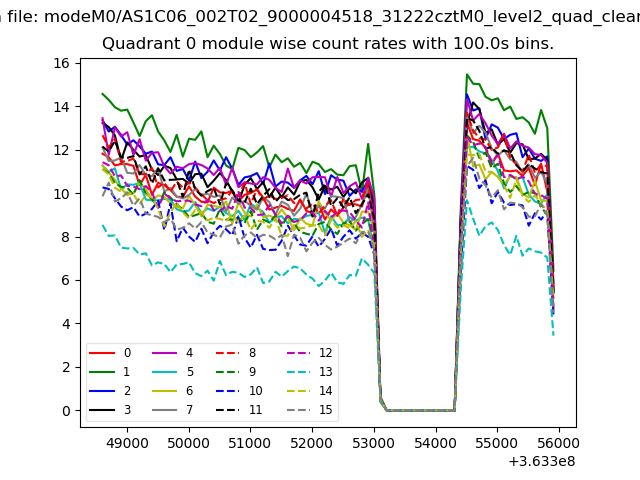 |
 |
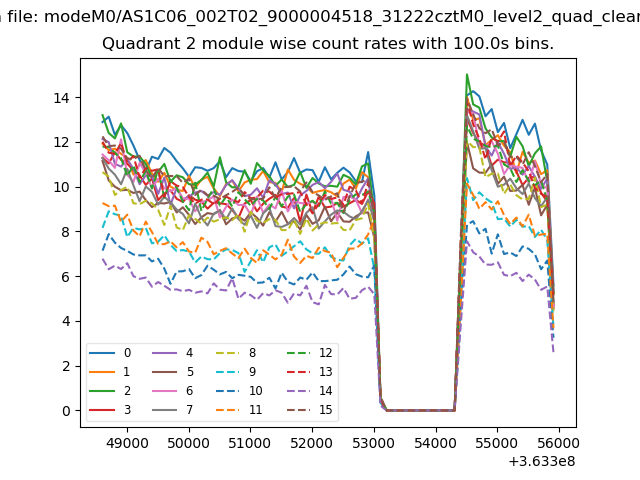
| Module-wise count rates for Quadrant B Data is divided into 100 sec bins |
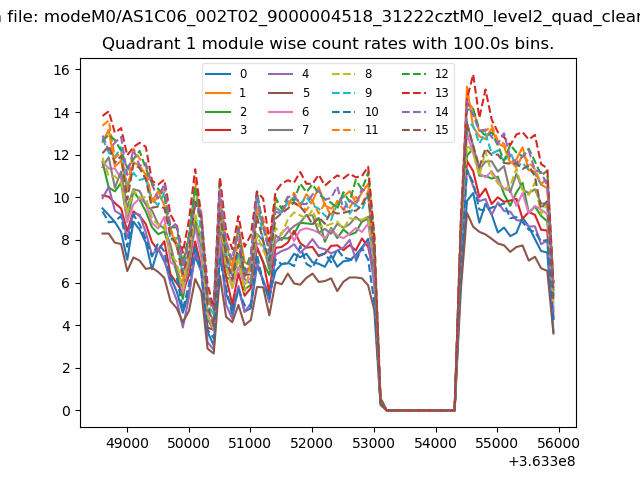 |
 |
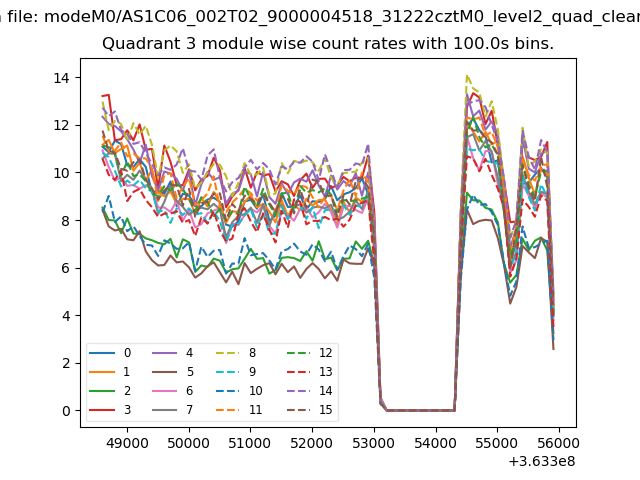
| Module-wise count rates for Quadrant C Data is divided into 100 sec bins |
 |
 |
| Module-wise count rates for Quadrant D Data is divided into 100 sec bins |
 |
 |
| Parameter | Plot |
|---|---|
| CZT HV Monitor | 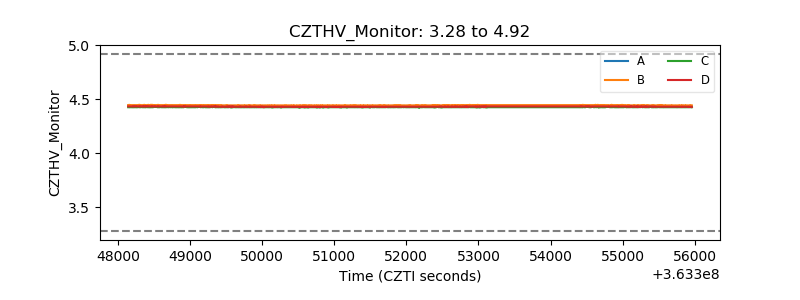 |
| D_VDD | 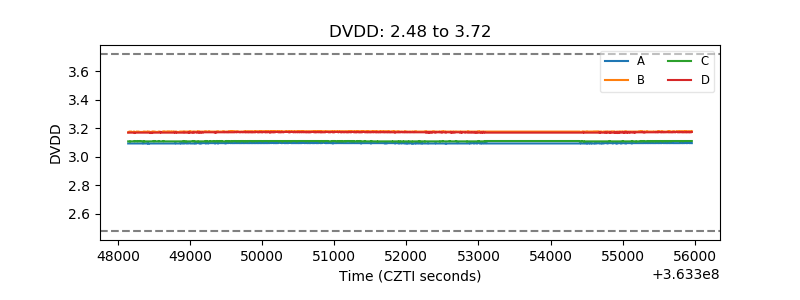 |
| Temperature 1 | 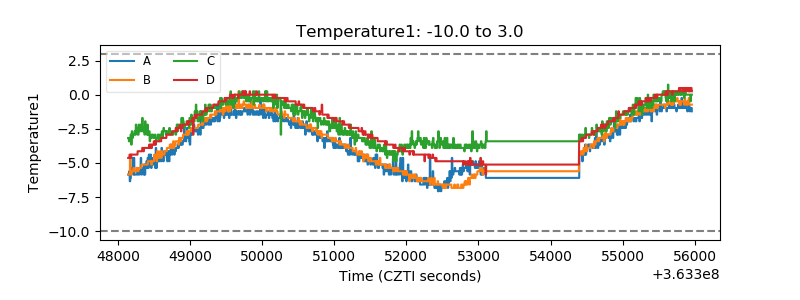 |
| Veto HV Monitor | 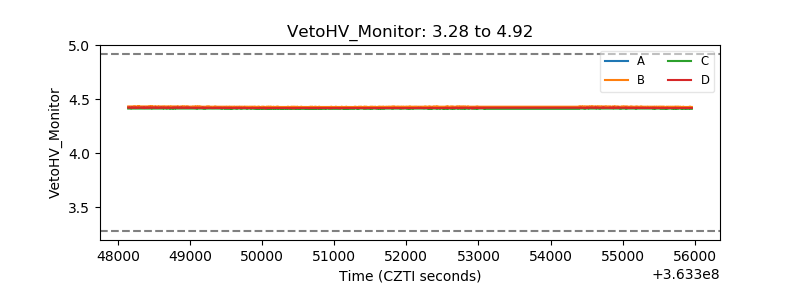 |
| Veto LLD | 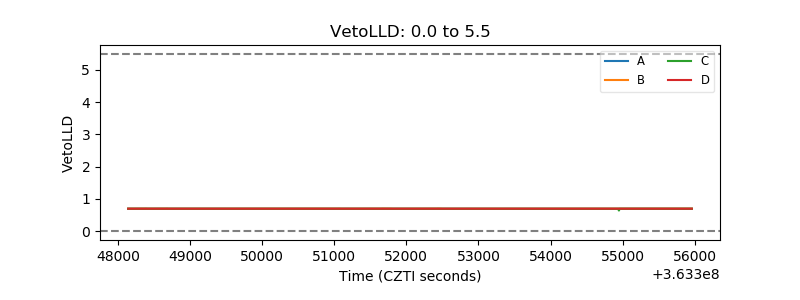 |
| Alpha Counter | 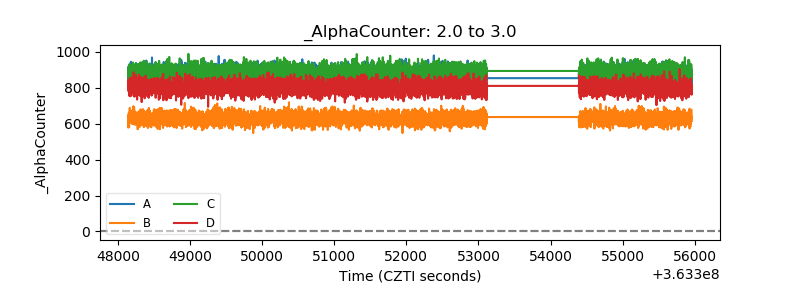 |
| _CPM_Rate | 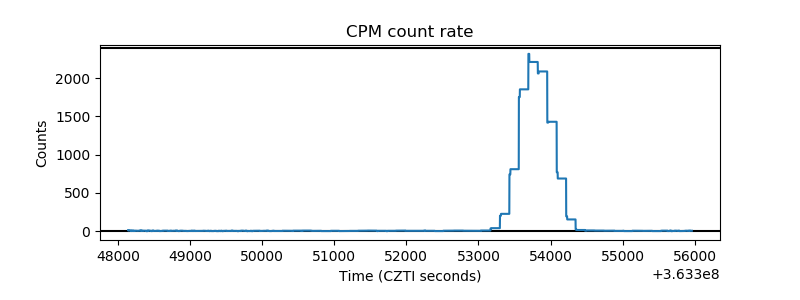 |
| CZT Counter | 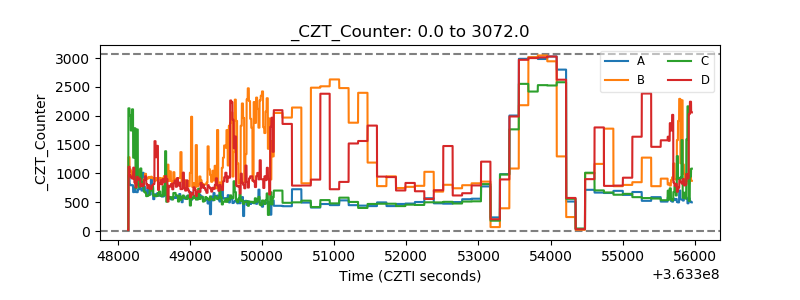 |
| +2.5 Volts monitor |  |
| +5 Volts monitor | 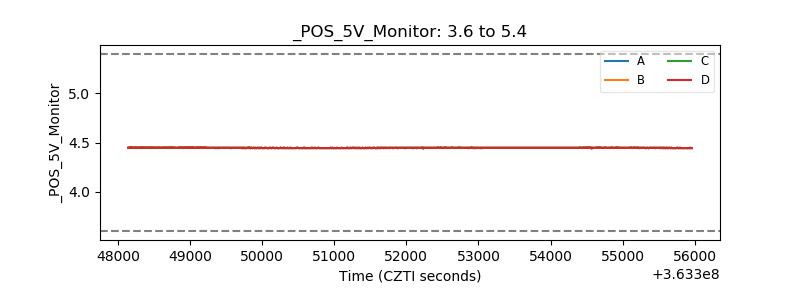 |
| _ROLL_ROT | 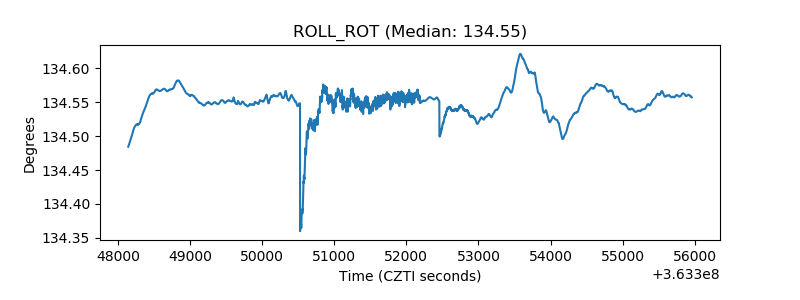 |
| _Roll_DEC |  |
| _Roll_RA |  |
| Veto Counter | 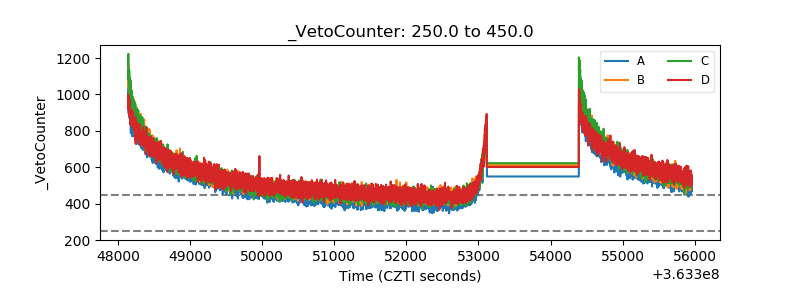 |