| Param | Original file | Final file |
|---|---|---|
| Filename | modeM0/AS1C06_002T02_9000004518_31224cztM0_level2.evt | modeM0/AS1C06_002T02_9000004518_31224cztM0_level2_quad_clean.evt |
| Size (bytes) | 680,929,920 | 113,362,560 |
| Size | 649.4 MB | 108.1 MB |
| Events in quadrant A | 3,072,004 | 805,655 |
| Events in quadrant B | 6,038,713 | 732,934 |
| Events in quadrant C | 3,505,843 | 764,053 |
| Events in quadrant D | 7,592,891 | 703,500 |
| Mode SS | |||
|---|---|---|---|
| Quadrant | BADHDUFLAG | Total packets | Discarded packets |
| A | 0 | 124 | 0 |
| B | 0 | 124 | 0 |
| C | 0 | 124 | 0 |
| D | 0 | 124 | 0 |
| Mode M9 | |||
|---|---|---|---|
| Quadrant | BADHDUFLAG | Total packets | Discarded packets |
| A | 0 | 13 | 0 |
| B | 0 | 13 | 0 |
| C | 0 | 13 | 0 |
| D | 0 | 13 | 0 |
| Mode M0 | |||
|---|---|---|---|
| Quadrant | BADHDUFLAG | Total packets | Discarded packets |
| A | 0 | 12844 | 1 |
| B | 0 | 21969 | 1 |
| C | 0 | 14298 | 1 |
| D | 0 | 26943 | 1 |
| Quadrant | Total seconds | Saturated seconds | Saturation percentage |
|---|---|---|---|
| A | 6120 | 78 | 1.274510% |
| B | 6120 | 783 | 12.794118% |
| C | 6120 | 206 | 3.366013% |
| D | 6120 | 911 | 14.885621% |
Noise dominated data is calculated using 1-second bins in cleaned event files. If a bin has >2000 counts, and if more than 50% of those come from <1% of pixels, then it is considered to be noise-dominated and hence unusable.
| Quadrant | # 1 sec bins | Bins with >0 counts | Bins with >2000 counts | High rate bins dominated by noise | Noise dominated (total time) | Noise dominated (detector-on time) | Marked lightcurve |
|---|---|---|---|---|---|---|---|
| A | 7340 | 6122 | 1 | 1 | 0.01% | 0.02% | 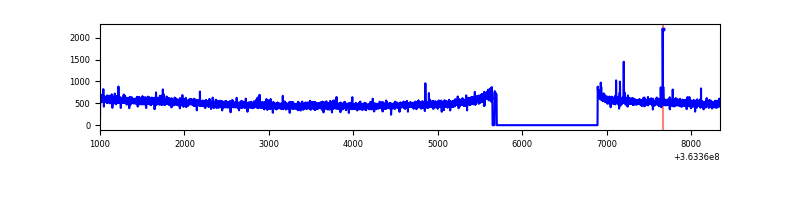 |
| B | 7340 | 6122 | 405 | 405 | 5.52% | 6.62% | 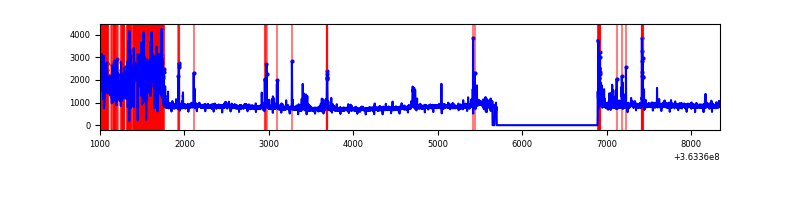 |
| C | 7340 | 6122 | 47 | 47 | 0.64% | 0.77% | 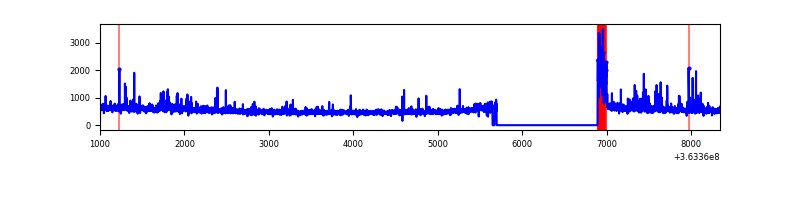 |
| D | 7340 | 6122 | 847 | 847 | 11.54% | 13.84% | 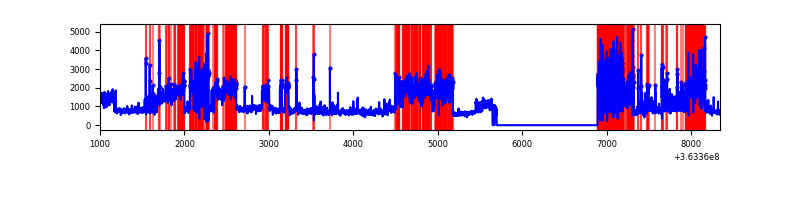 |
Top three noisy pixels from each quadrant. If the there are fewer than three noisy pixels in the level2.evt file, extra rows are filled as -1
| Pixel properties | Quadrant properties | ||||||
|---|---|---|---|---|---|---|---|
| Quadrant | DetID | PixID | Counts | Sigma | Mean | Median | Sigma |
| A | 13 | 254 | 11950 | 70.82 | 792 | 777 | 157.8 |
| A | 5 | 16 | 8821 | 50.99 | 792 | 777 | 157.8 |
| A | 3 | 137 | 7089 | 40.01 | 792 | 777 | 157.8 |
| B | 6 | 159 | 1764311 | 12975.52 | 730 | 713 | 135.9 |
| B | 4 | 80 | 1240947 | 9124.91 | 730 | 713 | 135.9 |
| B | 0 | 190 | 60850 | 442.45 | 730 | 713 | 135.9 |
| C | 0 | 10 | 294231 | 1678.6 | 754 | 760 | 174.8 |
| C | 14 | 238 | 128096 | 728.34 | 754 | 760 | 174.8 |
| C | 4 | 175 | 64877 | 366.74 | 754 | 760 | 174.8 |
| D | 8 | 195 | 2684518 | 14246.8 | 729 | 714 | 188.4 |
| D | 12 | 218 | 810824 | 4300.42 | 729 | 714 | 188.4 |
| D | 12 | 79 | 798709 | 4236.11 | 729 | 714 | 188.4 |
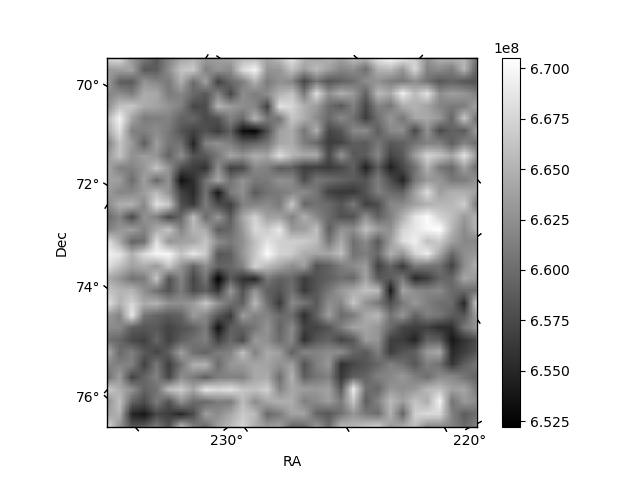
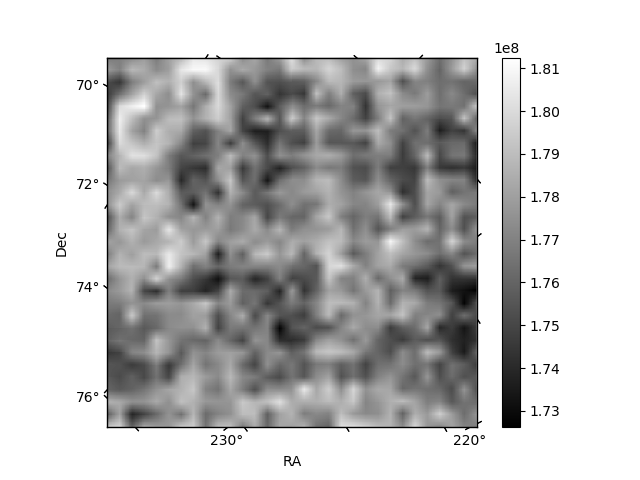
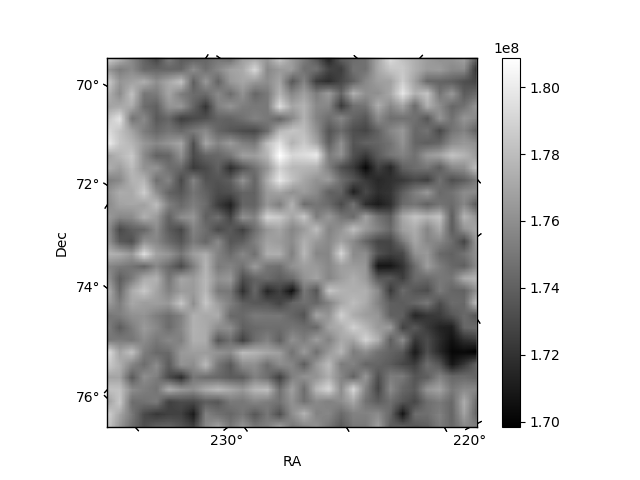
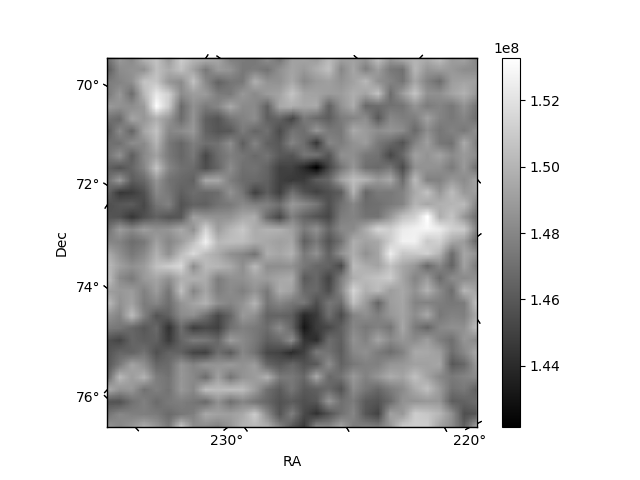
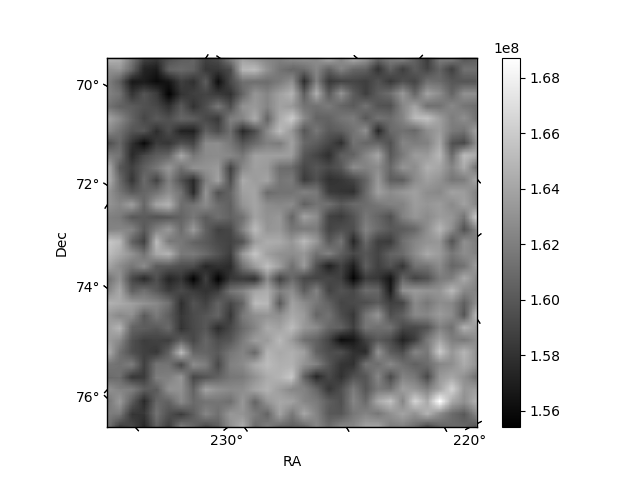
Histogram calculated using DETX and DETY for each event in the final _common_clean file
| Quadrant A | 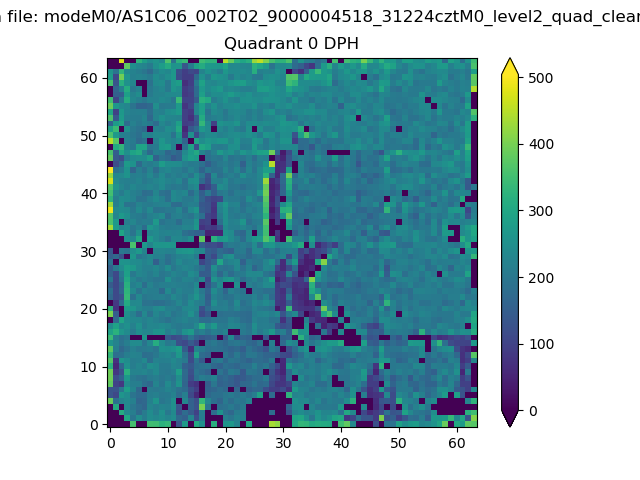 |
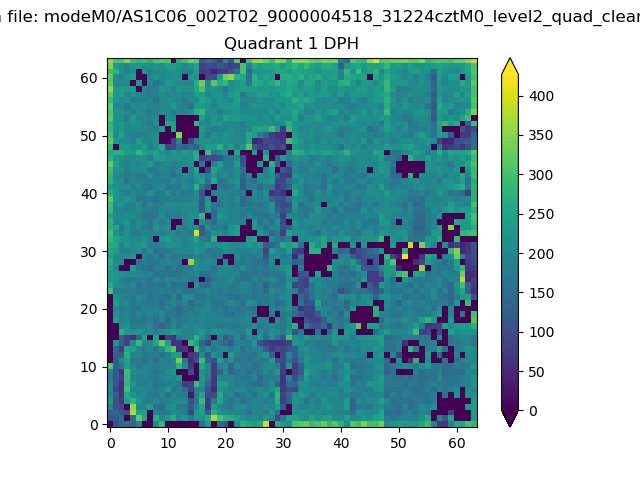 |
Quadrant B |
|---|---|---|---|
| Quadrant D | 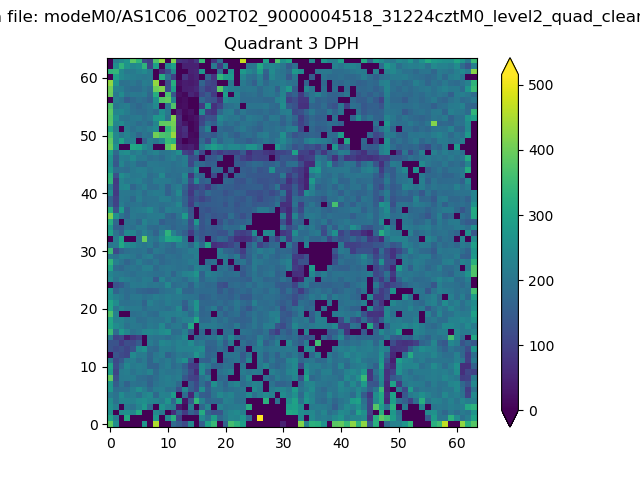 |
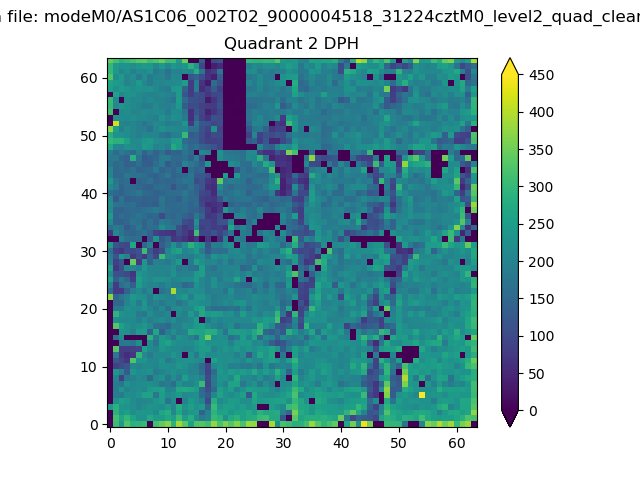 |
Quadrant C |
| Plot type | Count rate plots | Images |
|---|---|---|
| Comparison with Poisson distribution Blue bars denote a histogram of data divided into 1 sec bins. Red curve is a Poisson curve with rate = median count rate of data. |
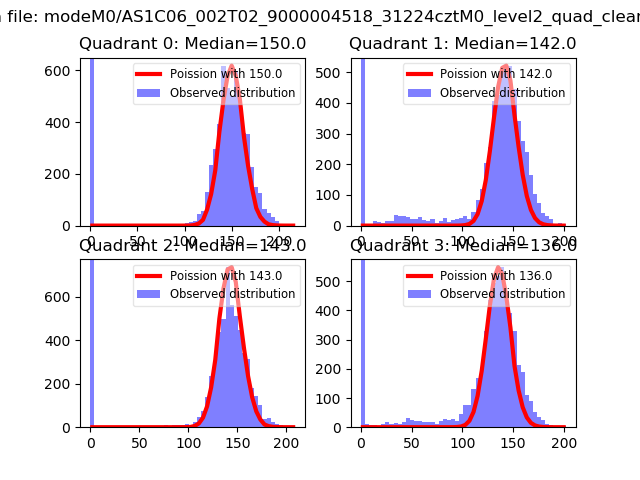 |
 |
| Quadrant-wise count rates Data is divided into 100 sec bins |
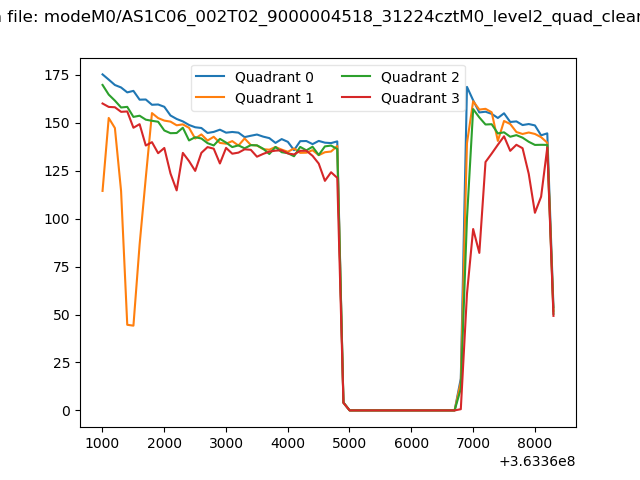 |
|
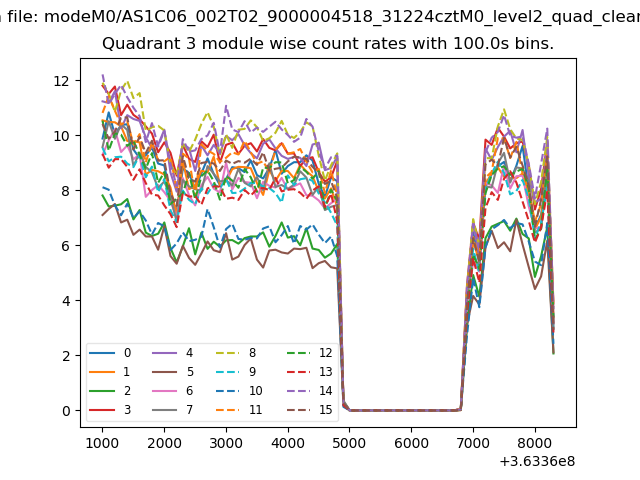
| Module-wise count rates for Quadrant A Data is divided into 100 sec bins |
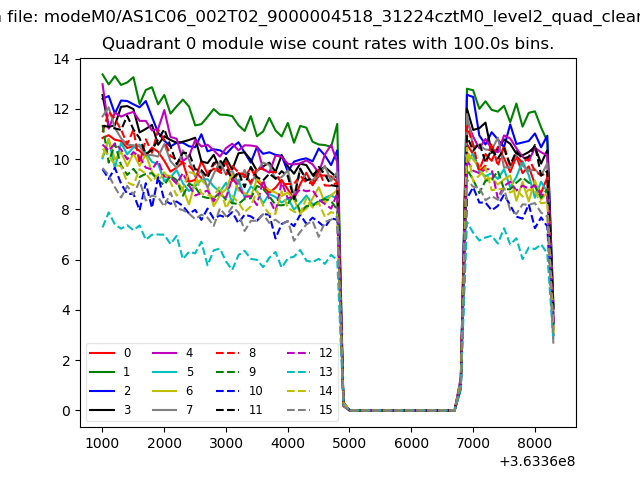 |
 |
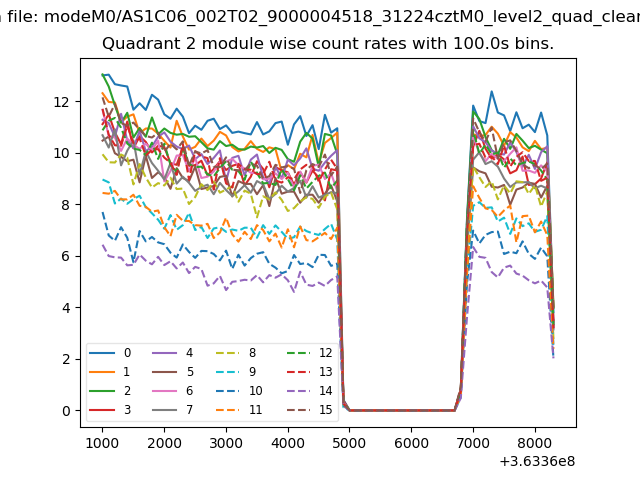
| Module-wise count rates for Quadrant B Data is divided into 100 sec bins |
 |
 |
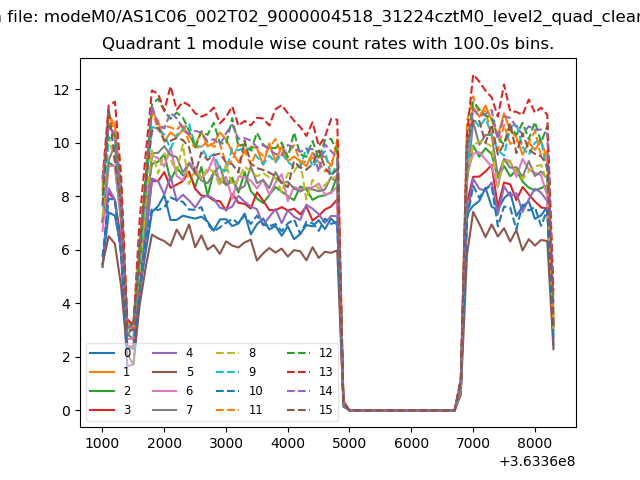
| Module-wise count rates for Quadrant C Data is divided into 100 sec bins |
 |
 |
| Module-wise count rates for Quadrant D Data is divided into 100 sec bins |
 |
 |
| Parameter | Plot |
|---|---|
| CZT HV Monitor | 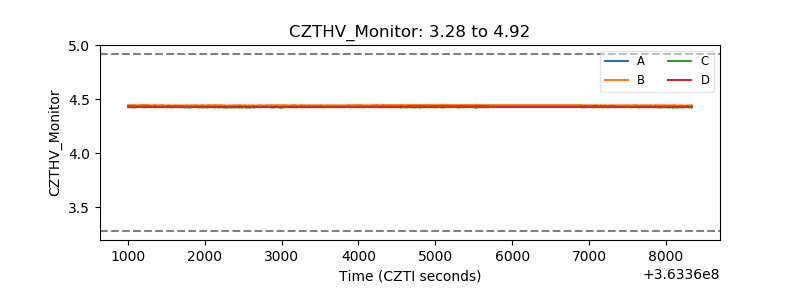 |
| D_VDD | 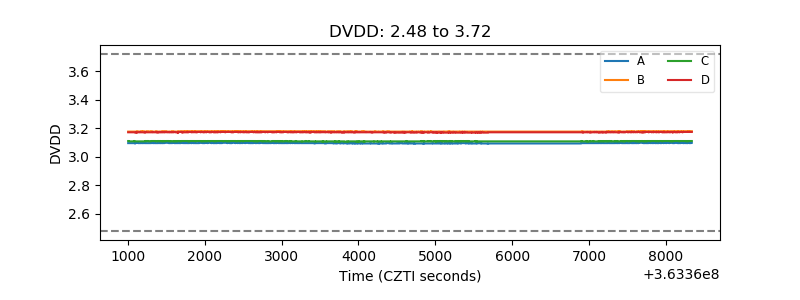 |
| Temperature 1 | 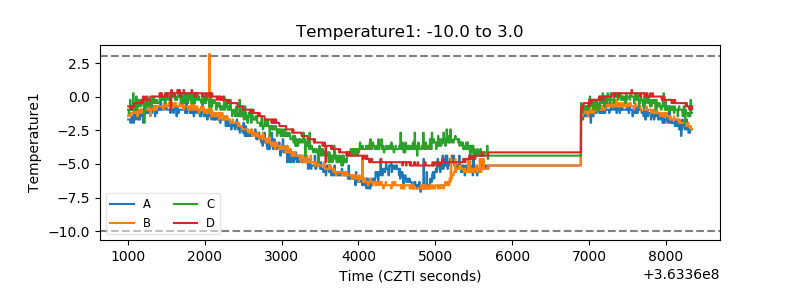 |
| Veto HV Monitor | 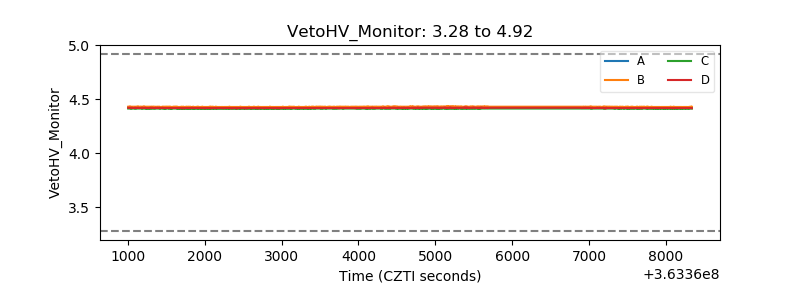 |
| Veto LLD | 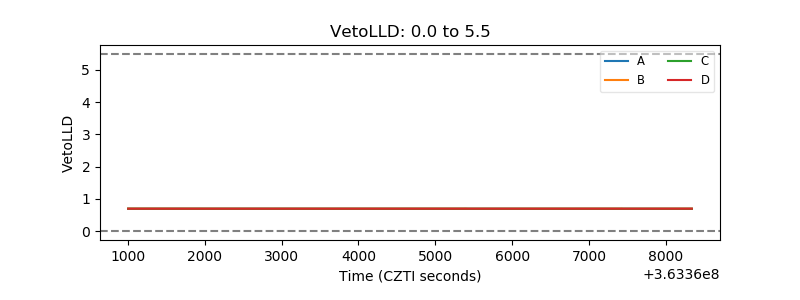 |
| Alpha Counter | 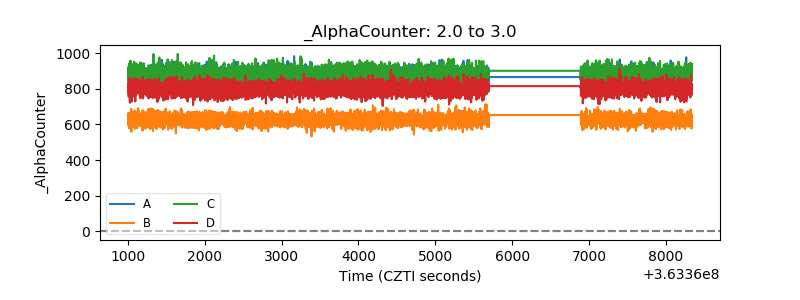 |
| _CPM_Rate | 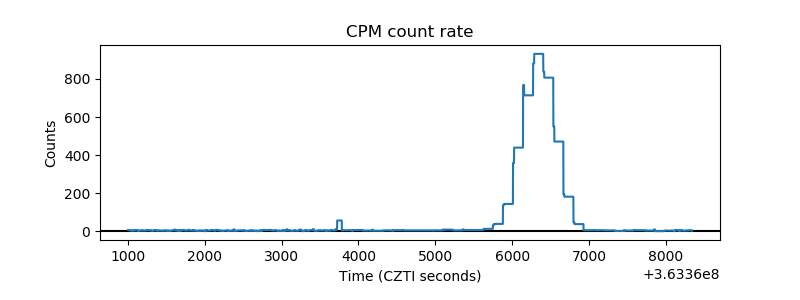 |
| CZT Counter | 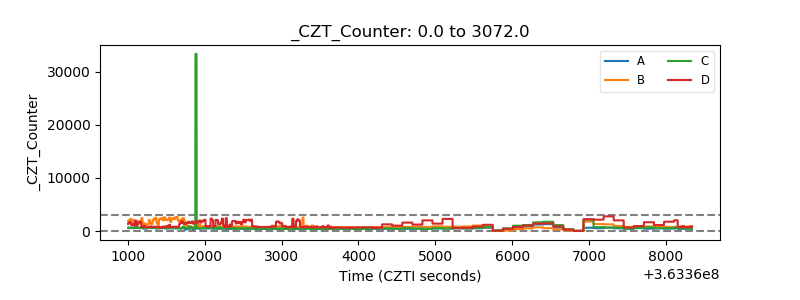 |
| +2.5 Volts monitor |  |
| +5 Volts monitor |  |
| _ROLL_ROT | 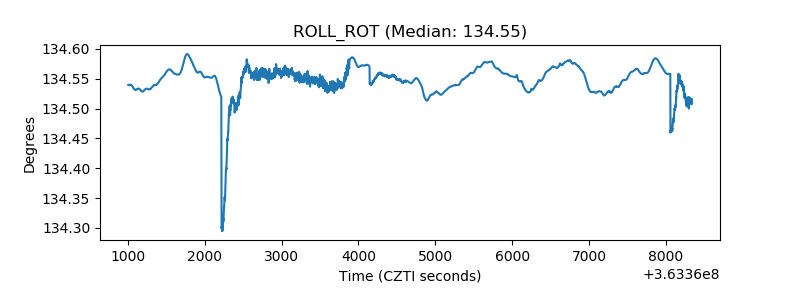 |
| _Roll_DEC | 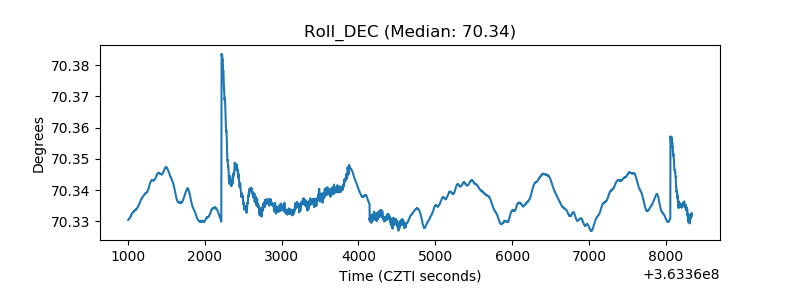 |
| _Roll_RA | 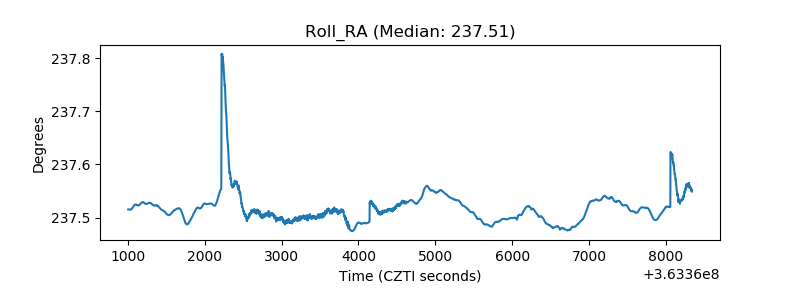 |
| Veto Counter | 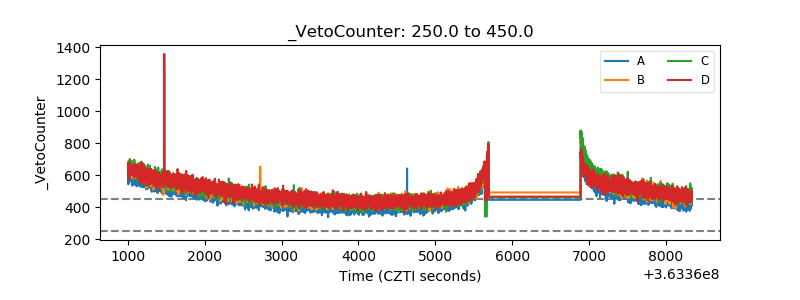 |