| Param | Original file | Final file |
|---|---|---|
| Filename | modeM0/AS1C06_002T02_9000004518_31225cztM0_level2.evt | modeM0/AS1C06_002T02_9000004518_31225cztM0_level2_quad_clean.evt |
| Size (bytes) | 658,941,120 | 108,305,280 |
| Size | 628.4 MB | 103.3 MB |
| Events in quadrant A | 3,160,122 | 744,470 |
| Events in quadrant B | 5,478,694 | 721,365 |
| Events in quadrant C | 3,860,865 | 699,482 |
| Events in quadrant D | 7,019,029 | 662,539 |
| Mode SS | |||
|---|---|---|---|
| Quadrant | BADHDUFLAG | Total packets | Discarded packets |
| A | 0 | 132 | 0 |
| B | 0 | 132 | 0 |
| C | 0 | 132 | 0 |
| D | 0 | 132 | 0 |
| Mode M9 | |||
|---|---|---|---|
| Quadrant | BADHDUFLAG | Total packets | Discarded packets |
| A | 0 | 9 | 0 |
| B | 0 | 9 | 0 |
| C | 0 | 9 | 0 |
| D | 0 | 9 | 0 |
| Mode M0 | |||
|---|---|---|---|
| Quadrant | BADHDUFLAG | Total packets | Discarded packets |
| A | 0 | 13492 | 1 |
| B | 0 | 20654 | 1 |
| C | 0 | 15633 | 1 |
| D | 0 | 25497 | 1 |
| Quadrant | Total seconds | Saturated seconds | Saturation percentage |
|---|---|---|---|
| A | 6478 | 57 | 0.879901% |
| B | 6479 | 195 | 3.009724% |
| C | 6479 | 264 | 4.074703% |
| D | 6478 | 628 | 9.694350% |
Noise dominated data is calculated using 1-second bins in cleaned event files. If a bin has >2000 counts, and if more than 50% of those come from <1% of pixels, then it is considered to be noise-dominated and hence unusable.
| Quadrant | # 1 sec bins | Bins with >0 counts | Bins with >2000 counts | High rate bins dominated by noise | Noise dominated (total time) | Noise dominated (detector-on time) | Marked lightcurve |
|---|---|---|---|---|---|---|---|
| A | 7448 | 6479 | 9 | 9 | 0.12% | 0.14% | 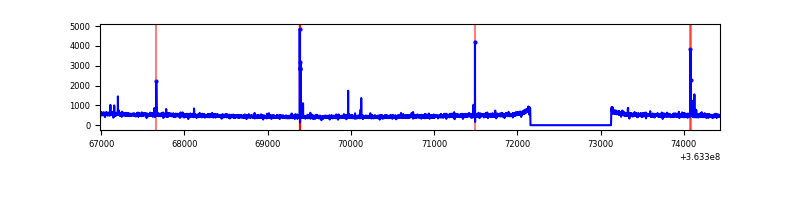 |
| B | 7449 | 6480 | 33 | 33 | 0.44% | 0.51% | 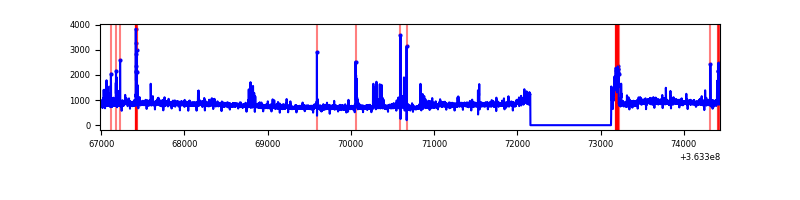 |
| C | 7449 | 6480 | 72 | 72 | 0.97% | 1.11% | 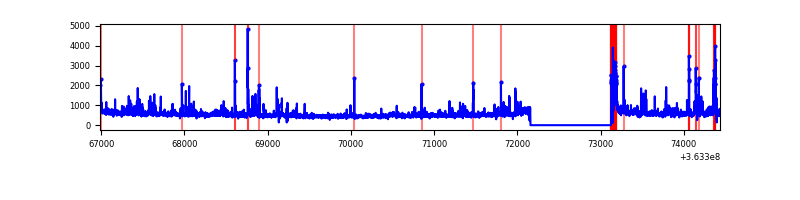 |
| D | 7448 | 6479 | 455 | 455 | 6.11% | 7.02% | 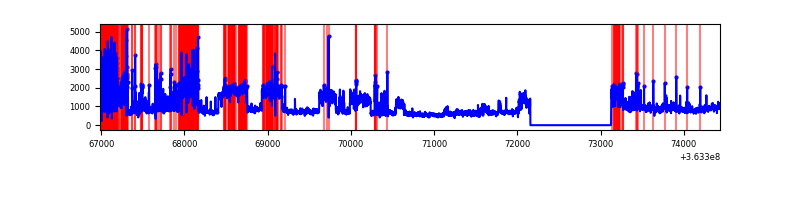 |
Top three noisy pixels from each quadrant. If the there are fewer than three noisy pixels in the level2.evt file, extra rows are filled as -1
| Pixel properties | Quadrant properties | ||||||
|---|---|---|---|---|---|---|---|
| Quadrant | DetID | PixID | Counts | Sigma | Mean | Median | Sigma |
| A | 15 | 174 | 27936 | 170.26 | 803 | 789 | 159.4 |
| A | 12 | 96 | 16855 | 100.76 | 803 | 789 | 159.4 |
| A | 5 | 16 | 16832 | 100.62 | 803 | 789 | 159.4 |
| B | 6 | 159 | 2034534 | 13862.2 | 786 | 768 | 146.7 |
| B | 4 | 80 | 145882 | 989.1 | 786 | 768 | 146.7 |
| B | 4 | 171 | 50639 | 339.92 | 786 | 768 | 146.7 |
| C | 0 | 10 | 466389 | 2614.23 | 764 | 768 | 178.1 |
| C | 14 | 238 | 143218 | 799.79 | 764 | 768 | 178.1 |
| C | 3 | 233 | 113974 | 635.59 | 764 | 768 | 178.1 |
| D | 8 | 195 | 3140468 | 15998.28 | 754 | 743 | 196.3 |
| D | 12 | 218 | 574780 | 2924.97 | 754 | 743 | 196.3 |
| D | 13 | 249 | 137269 | 695.66 | 754 | 743 | 196.3 |
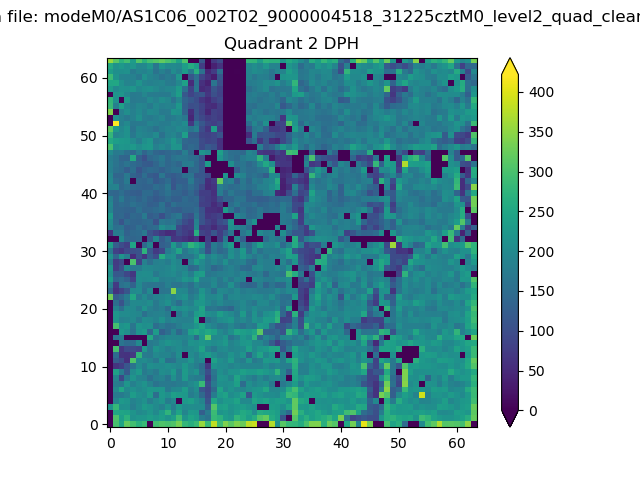
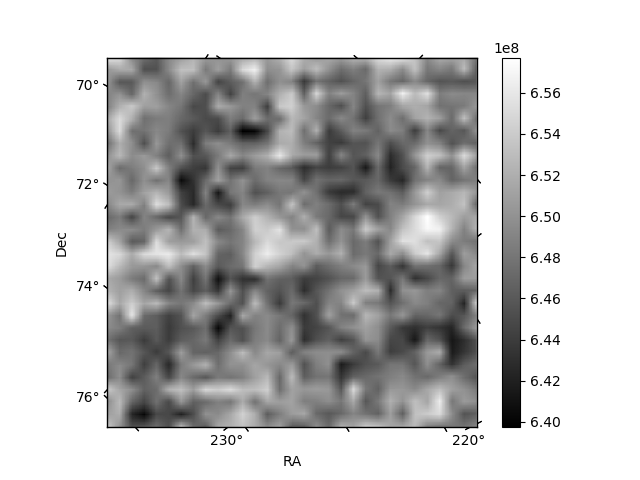
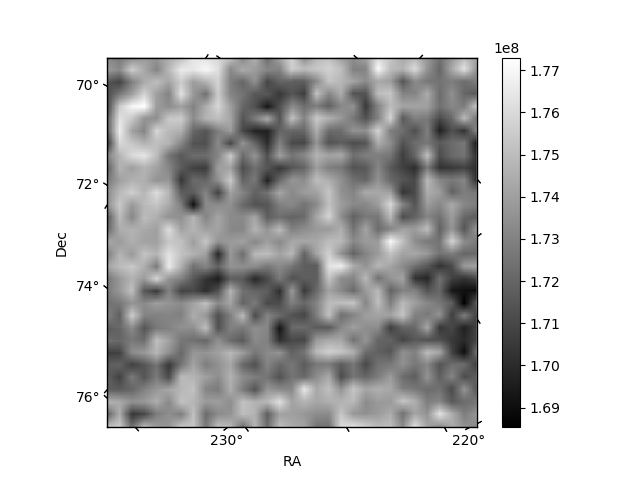
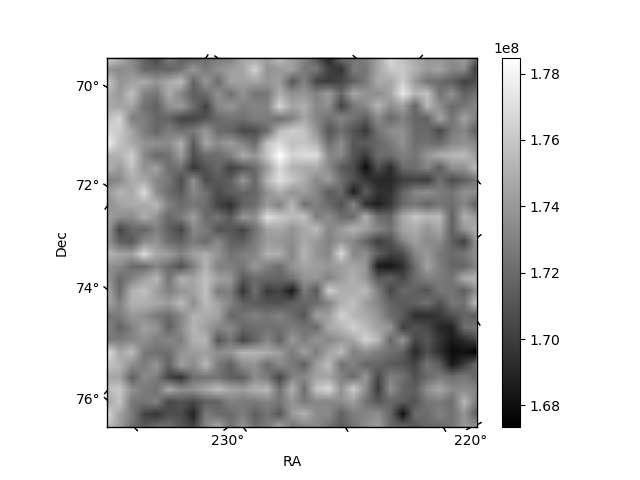
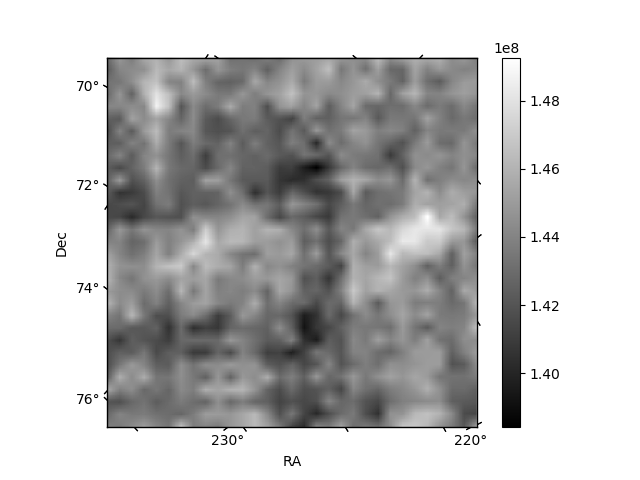
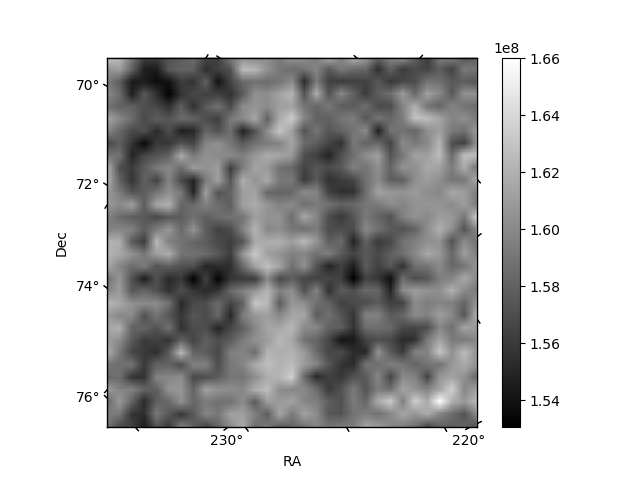
Histogram calculated using DETX and DETY for each event in the final _common_clean file
| Quadrant A | 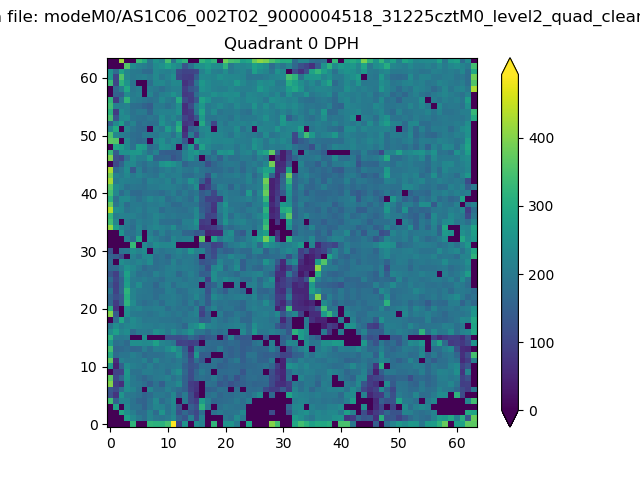 |
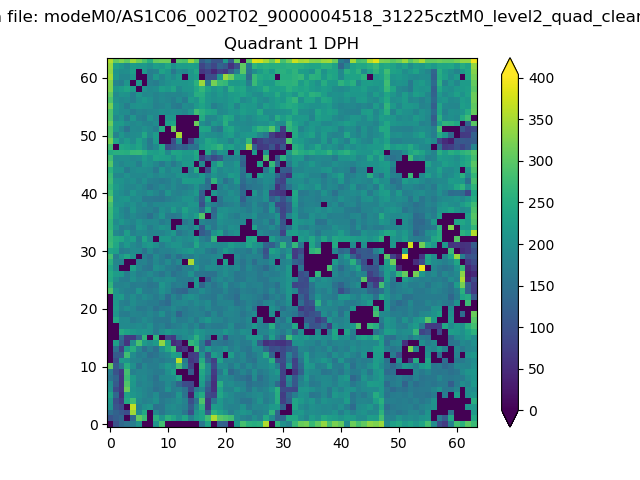 |
Quadrant B |
|---|---|---|---|
| Quadrant D | 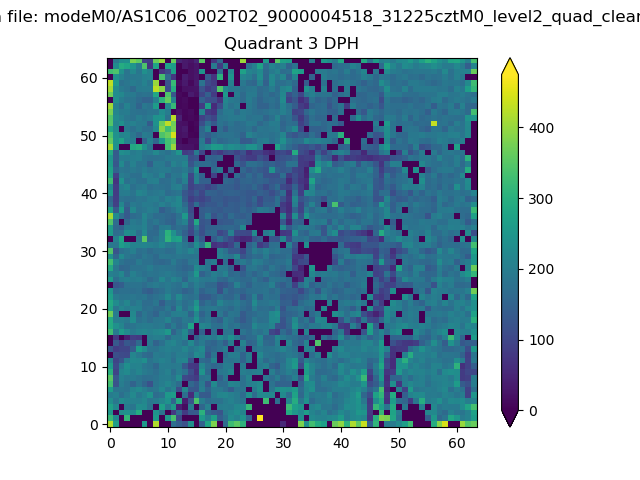 |
 |
Quadrant C |
| Plot type | Count rate plots | Images |
|---|---|---|
| Comparison with Poisson distribution Blue bars denote a histogram of data divided into 1 sec bins. Red curve is a Poisson curve with rate = median count rate of data. |
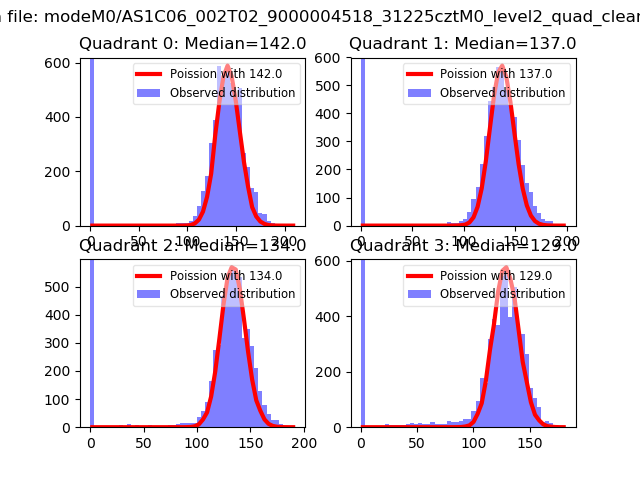 |
 |
| Quadrant-wise count rates Data is divided into 100 sec bins |
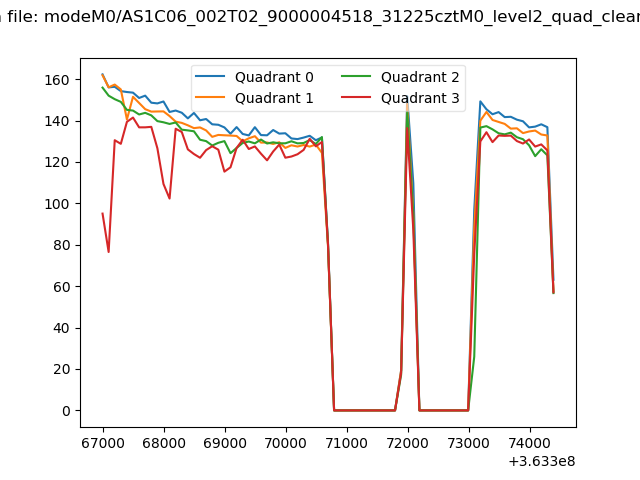 |
|
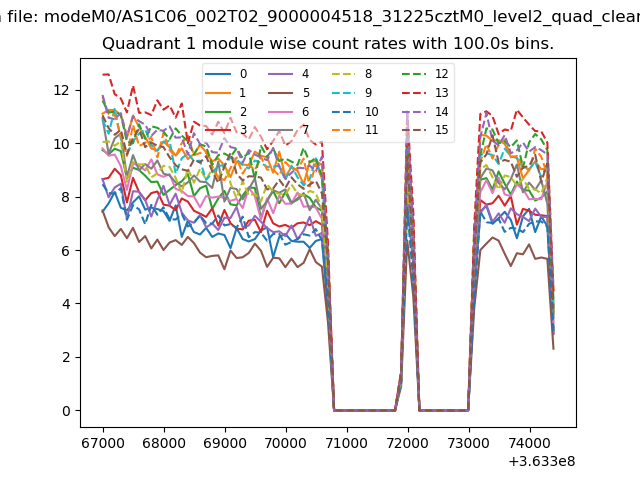
| Module-wise count rates for Quadrant A Data is divided into 100 sec bins |
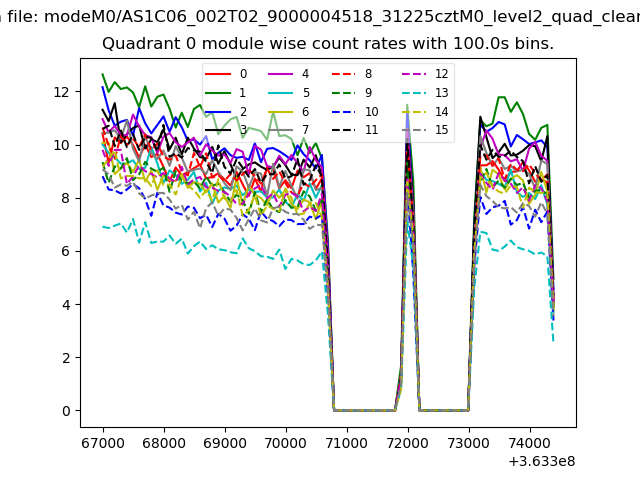 |
 |
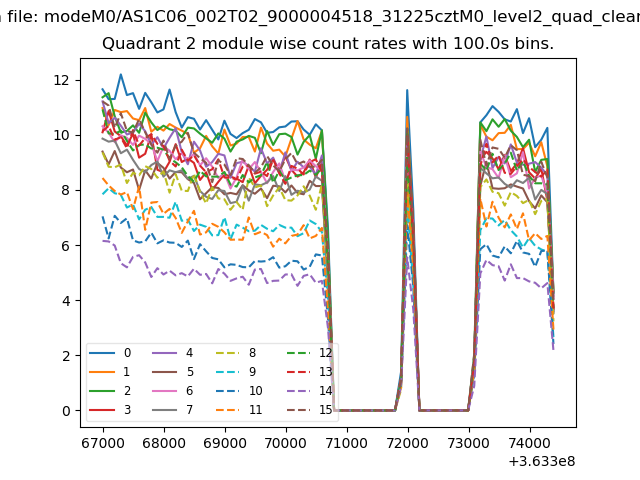
| Module-wise count rates for Quadrant B Data is divided into 100 sec bins |
 |
 |
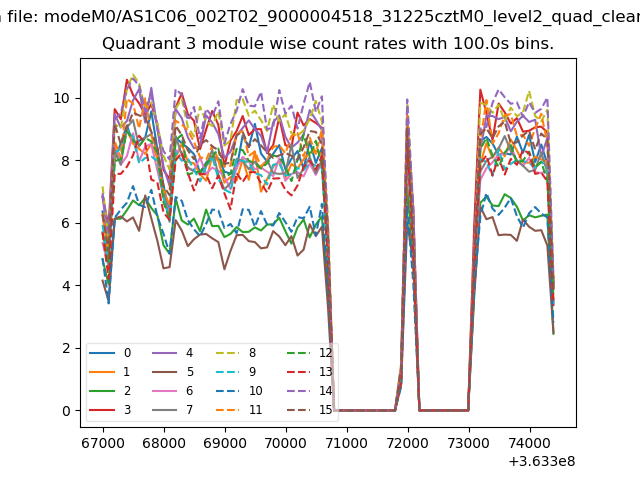
| Module-wise count rates for Quadrant C Data is divided into 100 sec bins |
 |
 |
| Module-wise count rates for Quadrant D Data is divided into 100 sec bins |
 |
 |
| Parameter | Plot |
|---|---|
| CZT HV Monitor | 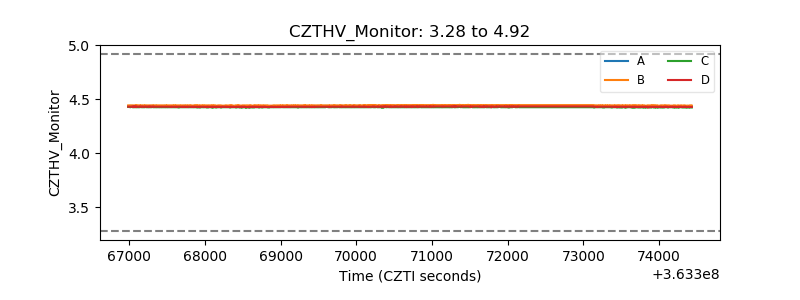 |
| D_VDD | 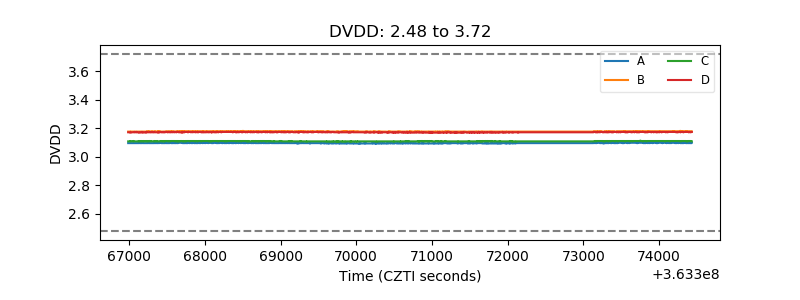 |
| Temperature 1 | 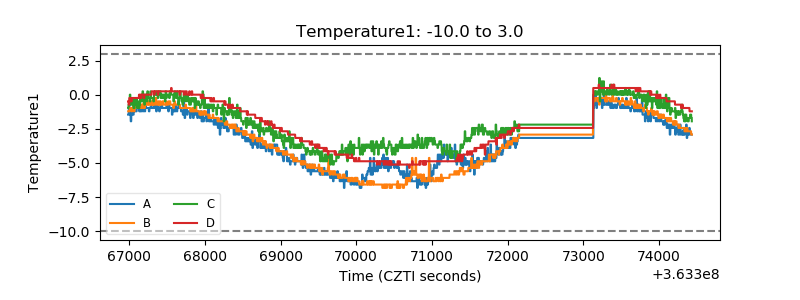 |
| Veto HV Monitor | 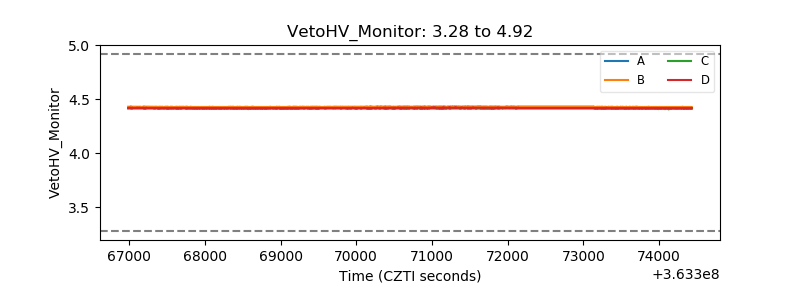 |
| Veto LLD | 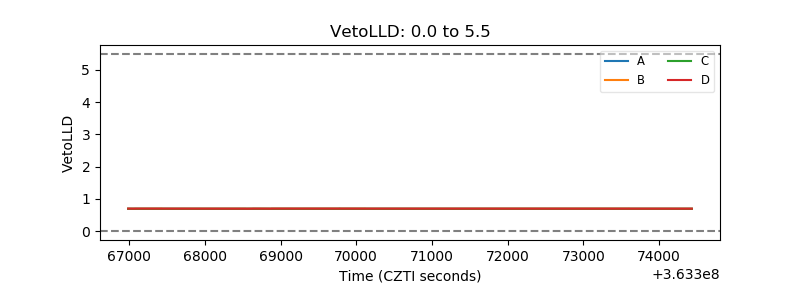 |
| Alpha Counter | 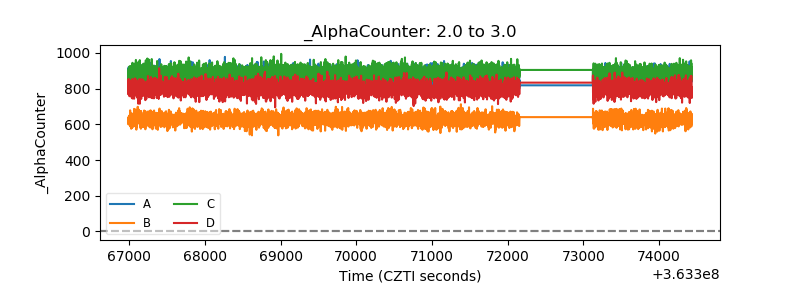 |
| _CPM_Rate | 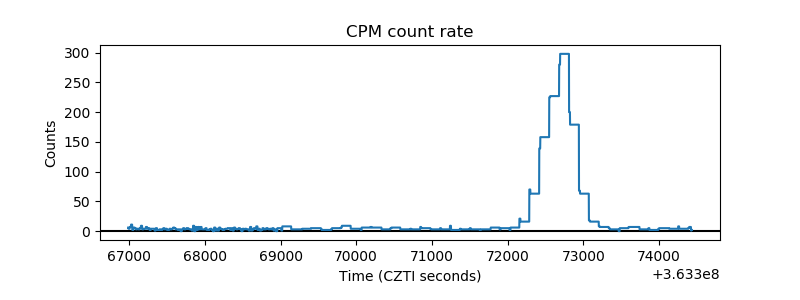 |
| CZT Counter | 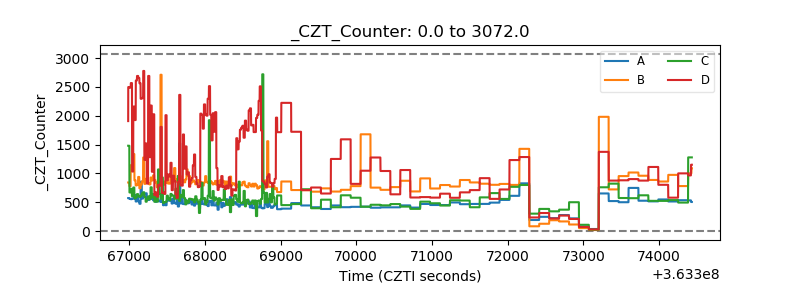 |
| +2.5 Volts monitor |  |
| +5 Volts monitor |  |
| _ROLL_ROT | 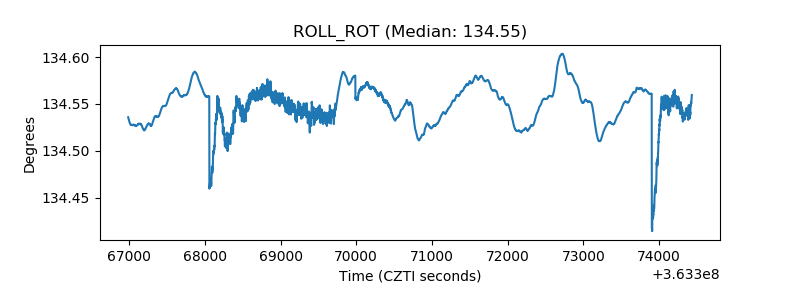 |
| _Roll_DEC | 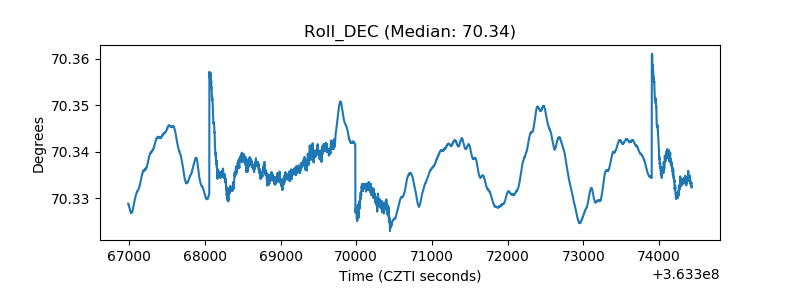 |
| _Roll_RA | 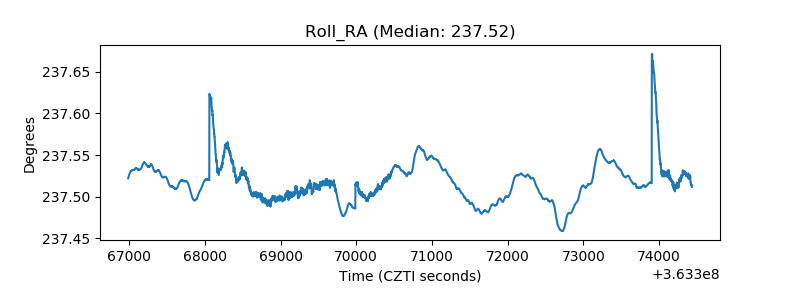 |
| Veto Counter | 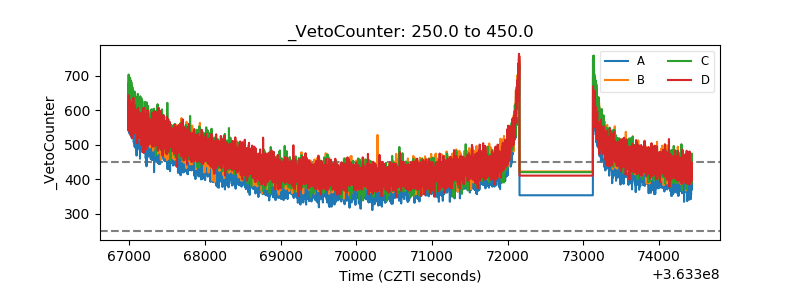 |