| Param | Original file | Final file |
|---|---|---|
| Filename | modeM0/AS1C06_002T02_9000004518_31227cztM0_level2.evt | modeM0/AS1C06_002T02_9000004518_31227cztM0_level2_quad_clean.evt |
| Size (bytes) | 703,848,960 | 114,102,720 |
| Size | 671.2 MB | 108.8 MB |
| Events in quadrant A | 3,320,376 | 773,560 |
| Events in quadrant B | 6,893,625 | 733,900 |
| Events in quadrant C | 3,739,446 | 740,938 |
| Events in quadrant D | 6,881,420 | 710,357 |
| Mode SS | |||
|---|---|---|---|
| Quadrant | BADHDUFLAG | Total packets | Discarded packets |
| A | 0 | 144 | 0 |
| B | 0 | 144 | 0 |
| C | 0 | 144 | 0 |
| D | 0 | 144 | 0 |
| Mode M9 | |||
|---|---|---|---|
| Quadrant | BADHDUFLAG | Total packets | Discarded packets |
| A | 0 | 3 | 0 |
| B | 0 | 3 | 0 |
| C | 0 | 3 | 0 |
| D | 0 | 3 | 0 |
| Mode M0 | |||
|---|---|---|---|
| Quadrant | BADHDUFLAG | Total packets | Discarded packets |
| A | 0 | 14681 | 1 |
| B | 0 | 25710 | 1 |
| C | 0 | 15712 | 1 |
| D | 0 | 25684 | 2 |
| Quadrant | Total seconds | Saturated seconds | Saturation percentage |
|---|---|---|---|
| A | 7134 | 22 | 0.308382% |
| B | 7135 | 547 | 7.666433% |
| C | 7135 | 146 | 2.046251% |
| D | 7134 | 411 | 5.761144% |
Noise dominated data is calculated using 1-second bins in cleaned event files. If a bin has >2000 counts, and if more than 50% of those come from <1% of pixels, then it is considered to be noise-dominated and hence unusable.
| Quadrant | # 1 sec bins | Bins with >0 counts | Bins with >2000 counts | High rate bins dominated by noise | Noise dominated (total time) | Noise dominated (detector-on time) | Marked lightcurve |
|---|---|---|---|---|---|---|---|
| A | 7464 | 7135 | 5 | 5 | 0.07% | 0.07% | 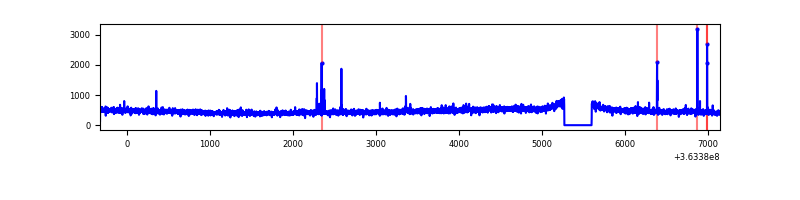 |
| B | 7465 | 7136 | 328 | 328 | 4.39% | 4.60% | 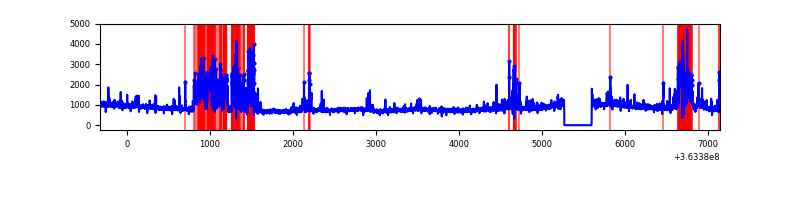 |
| C | 7465 | 7136 | 20 | 20 | 0.27% | 0.28% | 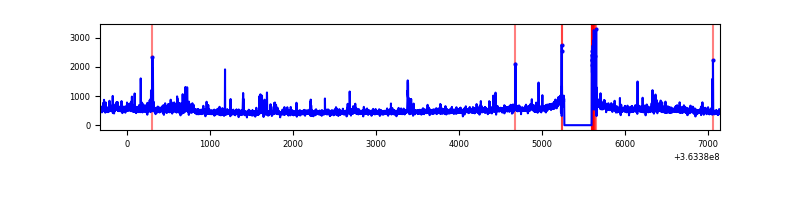 |
| D | 7464 | 7135 | 346 | 346 | 4.64% | 4.85% | 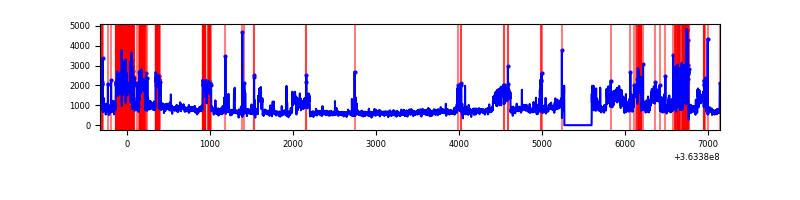 |
Top three noisy pixels from each quadrant. If the there are fewer than three noisy pixels in the level2.evt file, extra rows are filled as -1
| Pixel properties | Quadrant properties | ||||||
|---|---|---|---|---|---|---|---|
| Quadrant | DetID | PixID | Counts | Sigma | Mean | Median | Sigma |
| A | 12 | 96 | 31570 | 179.81 | 847 | 830 | 171.0 |
| A | 13 | 254 | 14990 | 82.83 | 847 | 830 | 171.0 |
| A | 15 | 174 | 9748 | 52.17 | 847 | 830 | 171.0 |
| B | 6 | 159 | 2215162 | 14367.65 | 819 | 798 | 154.1 |
| B | 4 | 80 | 1058371 | 6861.94 | 819 | 798 | 154.1 |
| B | 4 | 171 | 125535 | 809.34 | 819 | 798 | 154.1 |
| C | 14 | 238 | 142339 | 738.67 | 815 | 820 | 191.6 |
| C | 0 | 10 | 139971 | 726.31 | 815 | 820 | 191.6 |
| C | 10 | 22 | 106455 | 551.37 | 815 | 820 | 191.6 |
| D | 8 | 195 | 3176471 | 14989.82 | 808 | 793 | 211.9 |
| D | 12 | 6 | 147519 | 692.58 | 808 | 793 | 211.9 |
| D | 7 | 69 | 144584 | 678.72 | 808 | 793 | 211.9 |
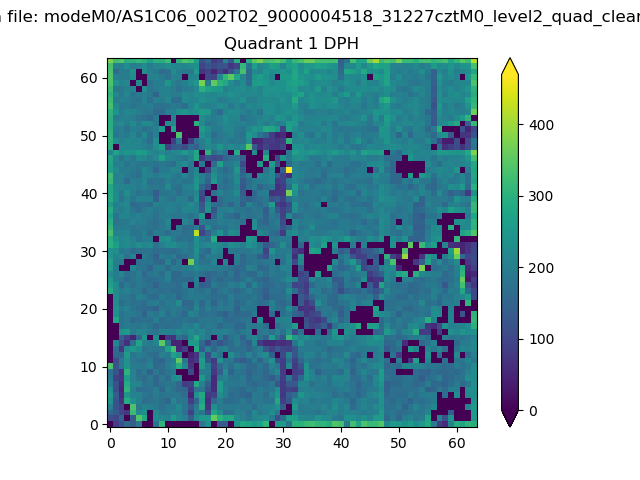
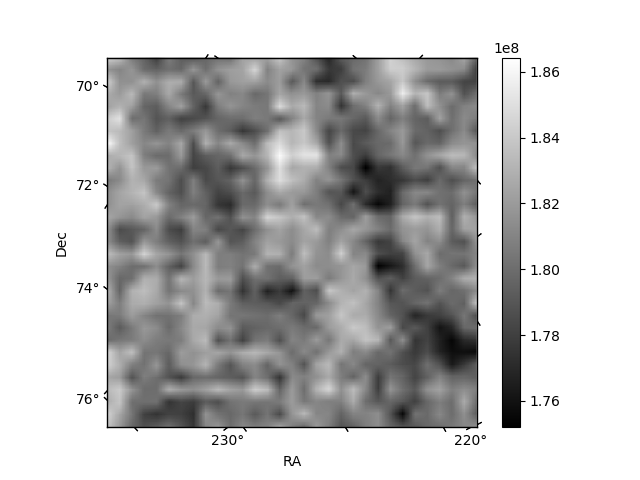
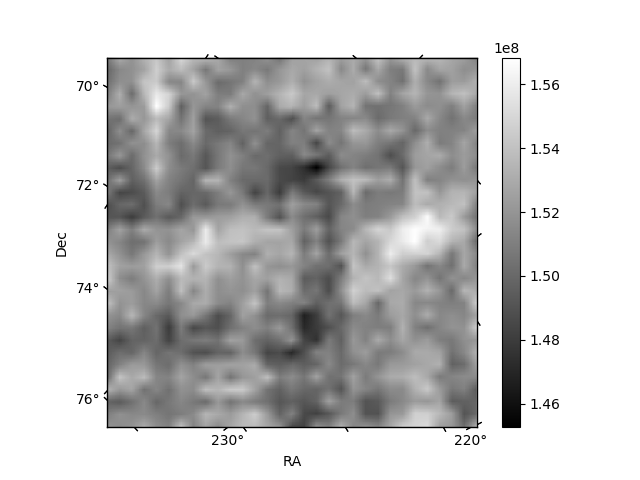
Histogram calculated using DETX and DETY for each event in the final _common_clean file
| Quadrant A |  |
 |
Quadrant B |
|---|---|---|---|
| Quadrant D | 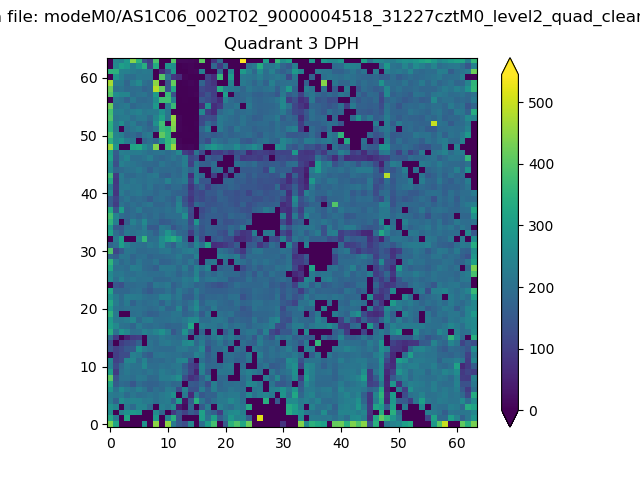 |
 |
Quadrant C |
| Plot type | Count rate plots | Images |
|---|---|---|
| Comparison with Poisson distribution Blue bars denote a histogram of data divided into 1 sec bins. Red curve is a Poisson curve with rate = median count rate of data. |
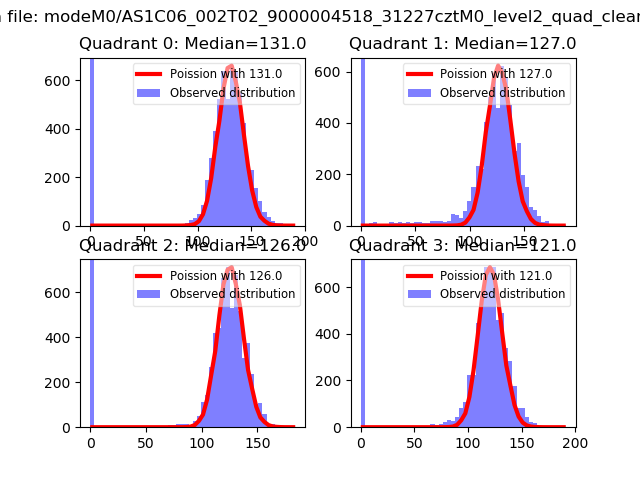 |
 |
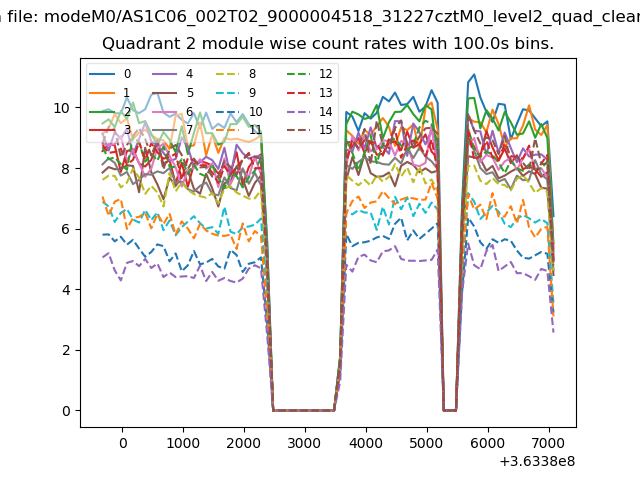
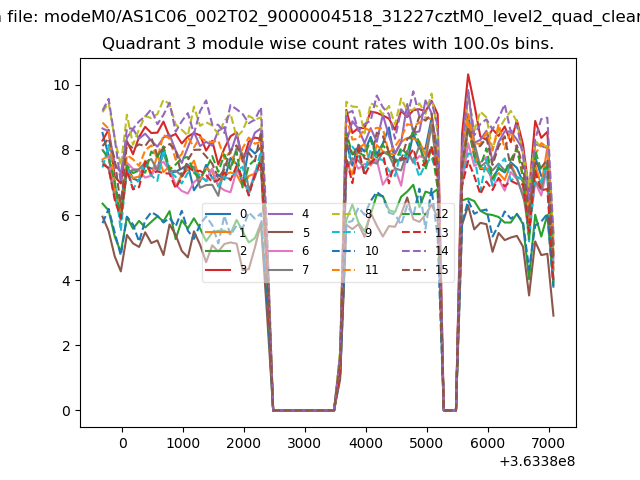
| Quadrant-wise count rates Data is divided into 100 sec bins |
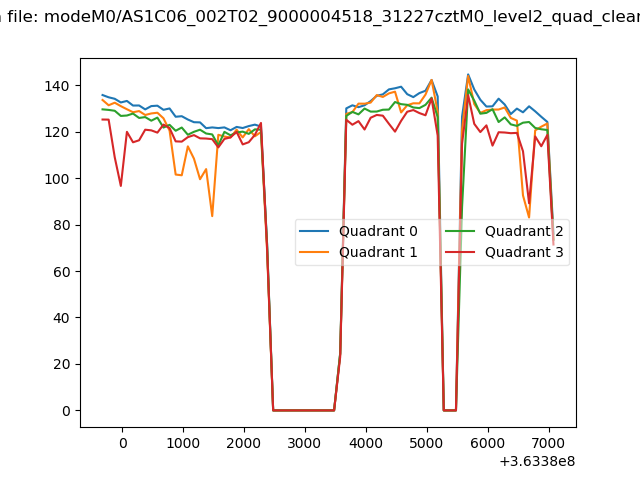 |
|
| Module-wise count rates for Quadrant A Data is divided into 100 sec bins |
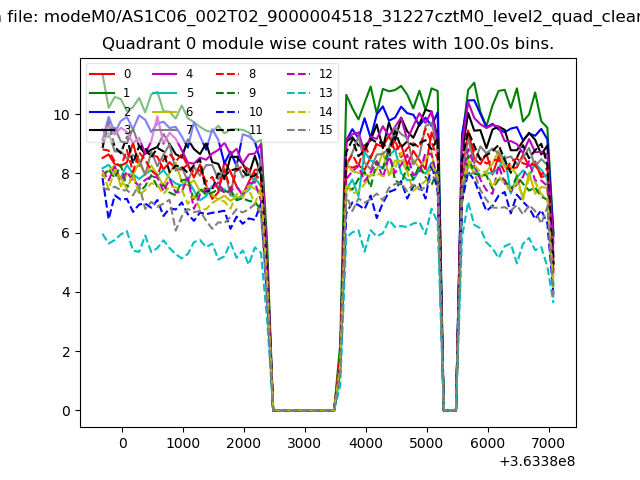 |
 |
| Module-wise count rates for Quadrant B Data is divided into 100 sec bins |
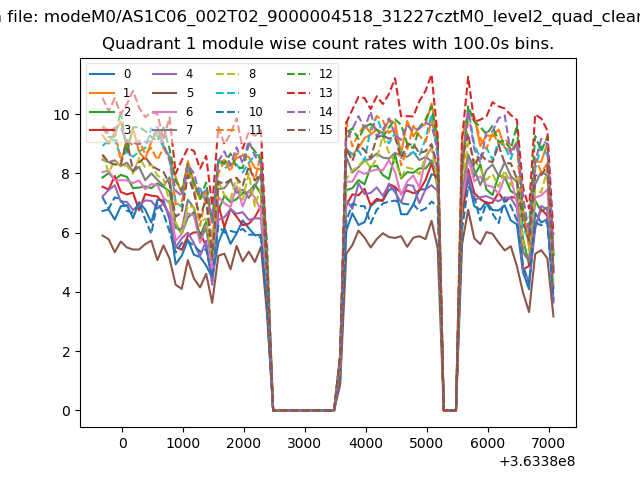 |
 |
| Module-wise count rates for Quadrant C Data is divided into 100 sec bins |
 |
 |
| Module-wise count rates for Quadrant D Data is divided into 100 sec bins |
 |
 |
| Parameter | Plot |
|---|---|
| CZT HV Monitor | 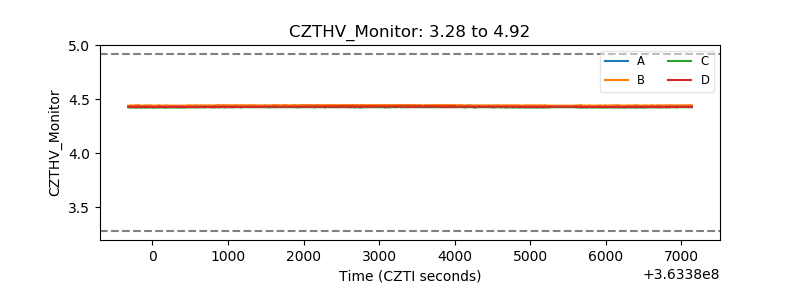 |
| D_VDD | 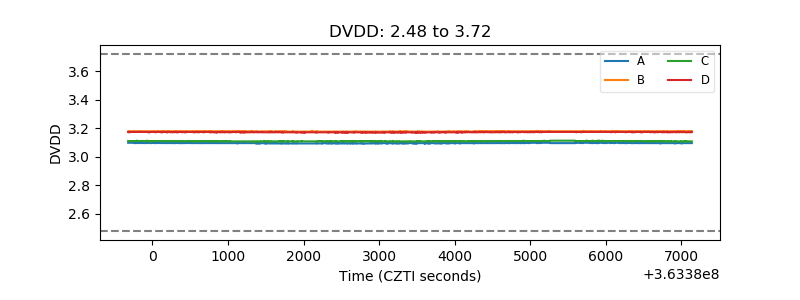 |
| Temperature 1 | 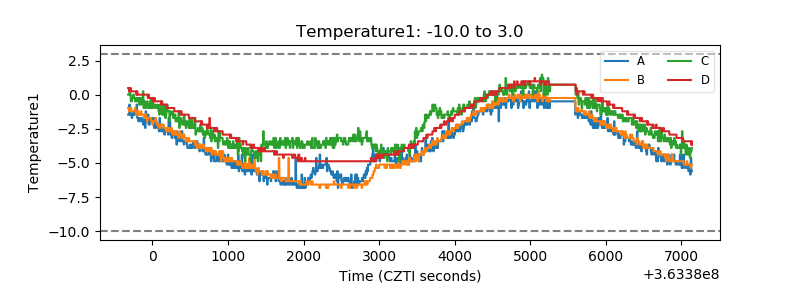 |
| Veto HV Monitor |  |
| Veto LLD | 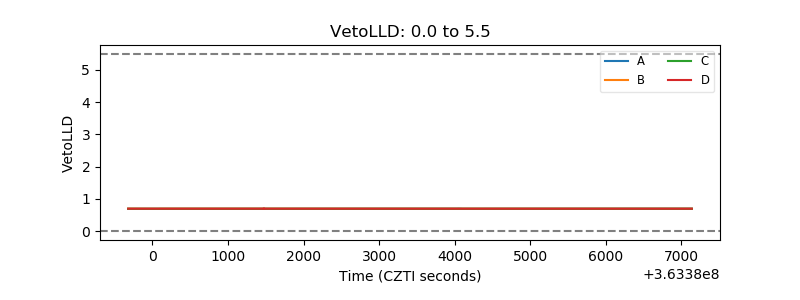 |
| Alpha Counter | 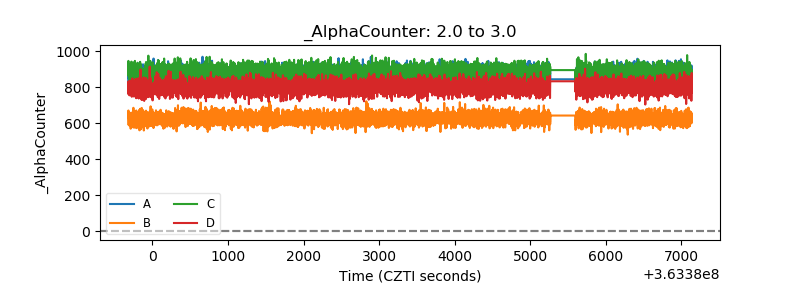 |
| _CPM_Rate | 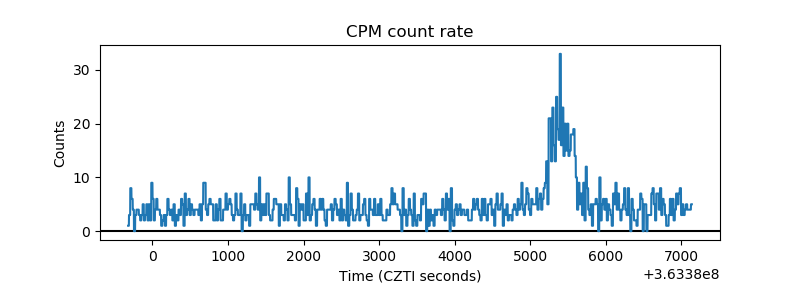 |
| CZT Counter | 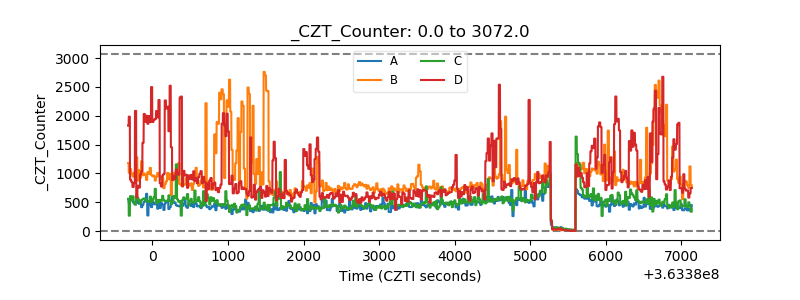 |
| +2.5 Volts monitor |  |
| +5 Volts monitor |  |
| _ROLL_ROT | 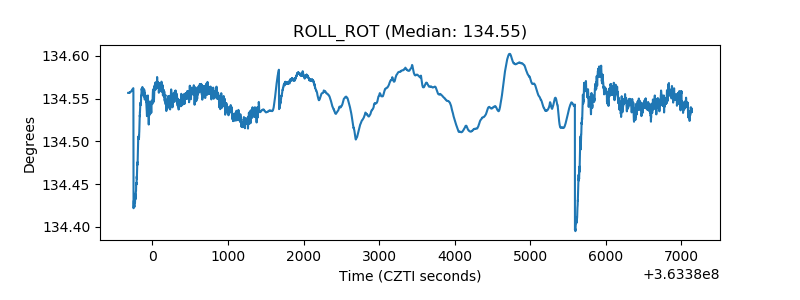 |
| _Roll_DEC | 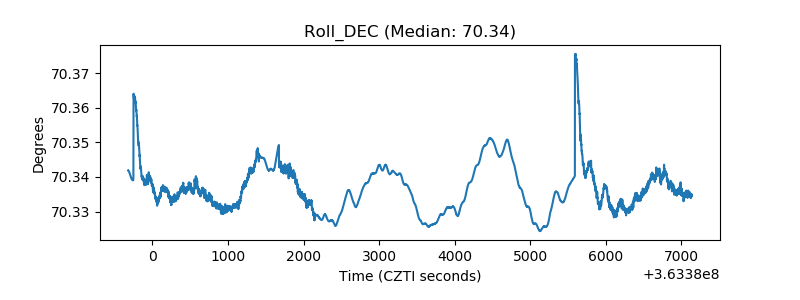 |
| _Roll_RA | 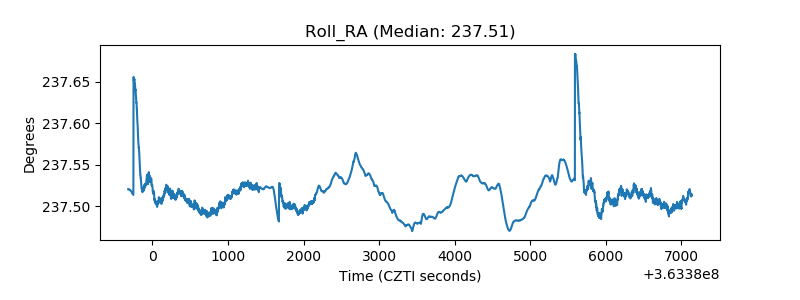 |
| Veto Counter | 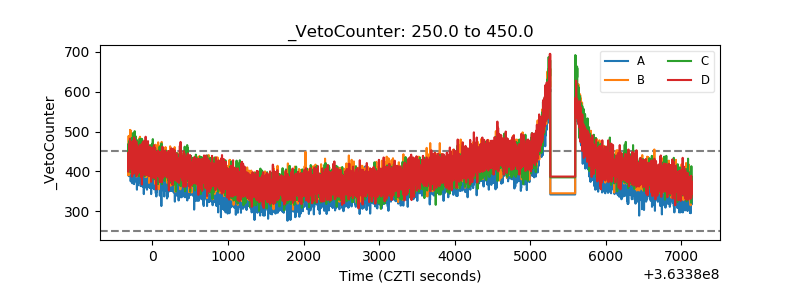 |