| Param | Original file | Final file |
|---|---|---|
| Filename | modeM0/AS1C06_002T02_9000004518_31231cztM0_level2.evt | modeM0/AS1C06_002T02_9000004518_31231cztM0_level2_quad_clean.evt |
| Size (bytes) | 1,696,832,640 | 277,914,240 |
| Size | 1.6 GB | 265.0 MB |
| Events in quadrant A | 8,629,778 | 1,847,363 |
| Events in quadrant B | 15,364,657 | 1,797,465 |
| Events in quadrant C | 9,470,507 | 1,775,292 |
| Events in quadrant D | 16,675,433 | 1,718,333 |
| Mode SS | |||
|---|---|---|---|
| Quadrant | BADHDUFLAG | Total packets | Discarded packets |
| A | 0 | 380 | 0 |
| B | 0 | 380 | 0 |
| C | 0 | 380 | 0 |
| D | 0 | 380 | 0 |
| Mode M9 | |||
|---|---|---|---|
| Quadrant | BADHDUFLAG | Total packets | Discarded packets |
| A | 0 | 23 | 0 |
| B | 0 | 23 | 0 |
| C | 0 | 23 | 0 |
| D | 0 | 23 | 0 |
| Mode M0 | |||
|---|---|---|---|
| Quadrant | BADHDUFLAG | Total packets | Discarded packets |
| A | 0 | 38171 | 4 |
| B | 0 | 59408 | 5 |
| C | 0 | 40282 | 4 |
| D | 0 | 62869 | 4 |
| Quadrant | Total seconds | Saturated seconds | Saturation percentage |
|---|---|---|---|
| A | 18559 | 82 | 0.441834% |
| B | 18558 | 595 | 3.206164% |
| C | 18559 | 462 | 2.489358% |
| D | 18559 | 760 | 4.095048% |
Noise dominated data is calculated using 1-second bins in cleaned event files. If a bin has >2000 counts, and if more than 50% of those come from <1% of pixels, then it is considered to be noise-dominated and hence unusable.
| Quadrant | # 1 sec bins | Bins with >0 counts | Bins with >2000 counts | High rate bins dominated by noise | Noise dominated (total time) | Noise dominated (detector-on time) | Marked lightcurve |
|---|---|---|---|---|---|---|---|
| A | 20904 | 18563 | 9 | 9 | 0.04% | 0.05% | 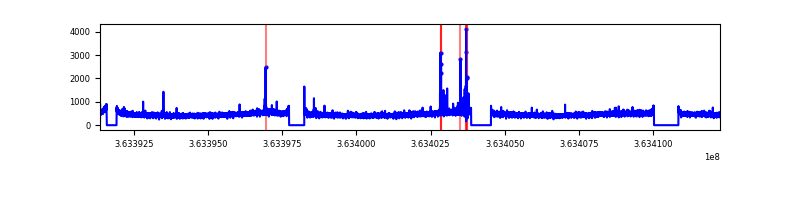 |
| B | 20903 | 18562 | 178 | 178 | 0.85% | 0.96% | 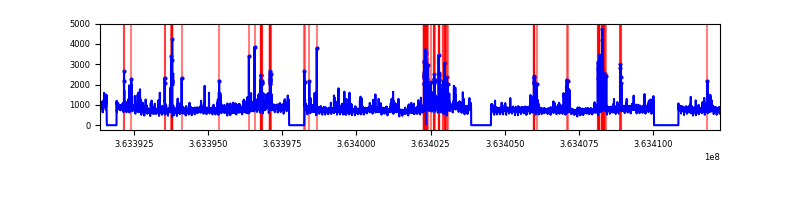 |
| C | 20904 | 18563 | 69 | 69 | 0.33% | 0.37% | 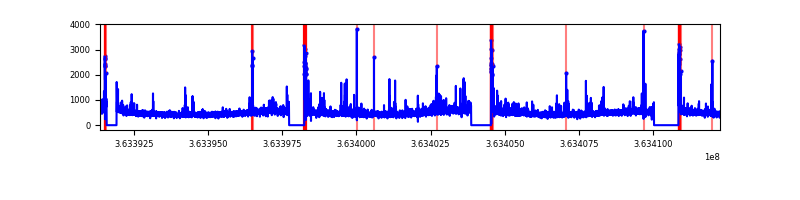 |
| D | 20904 | 18563 | 489 | 489 | 2.34% | 2.63% | 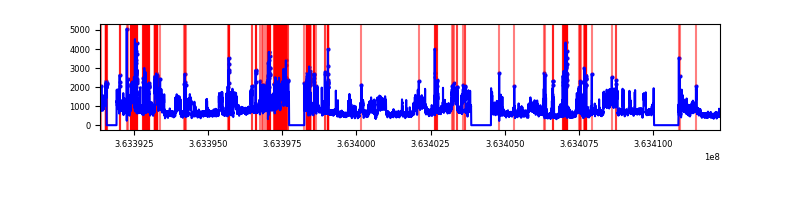 |
Top three noisy pixels from each quadrant. If the there are fewer than three noisy pixels in the level2.evt file, extra rows are filled as -1
| Pixel properties | Quadrant properties | ||||||
|---|---|---|---|---|---|---|---|
| Quadrant | DetID | PixID | Counts | Sigma | Mean | Median | Sigma |
| A | 12 | 96 | 115628 | 258.4 | 2196 | 2144 | 439.2 |
| A | 13 | 254 | 39661 | 85.42 | 2196 | 2144 | 439.2 |
| A | 3 | 137 | 21959 | 45.12 | 2196 | 2144 | 439.2 |
| B | 6 | 159 | 5391383 | 13125.61 | 2159 | 2103 | 410.6 |
| B | 4 | 80 | 327804 | 793.25 | 2159 | 2103 | 410.6 |
| B | 12 | 18 | 282585 | 683.11 | 2159 | 2103 | 410.6 |
| C | 0 | 10 | 679939 | 1373.74 | 2104 | 2115 | 493.4 |
| C | 14 | 238 | 364337 | 734.11 | 2104 | 2115 | 493.4 |
| C | 4 | 175 | 75584 | 148.9 | 2104 | 2115 | 493.4 |
| D | 8 | 195 | 7393937 | 13494.88 | 2093 | 2052 | 547.8 |
| D | 12 | 218 | 290698 | 526.96 | 2093 | 2052 | 547.8 |
| D | 15 | 0 | 219316 | 396.64 | 2093 | 2052 | 547.8 |
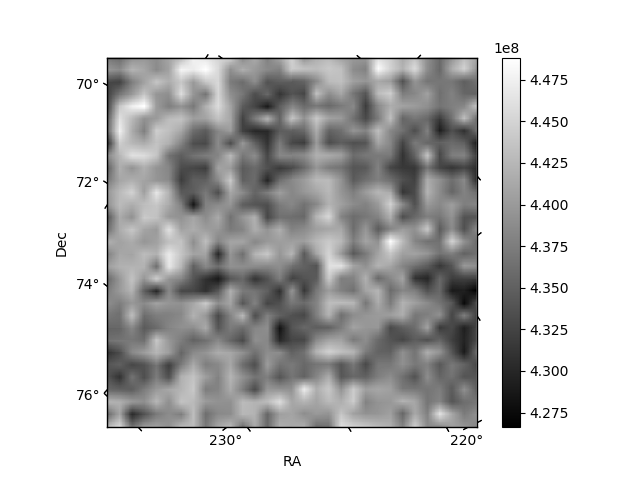
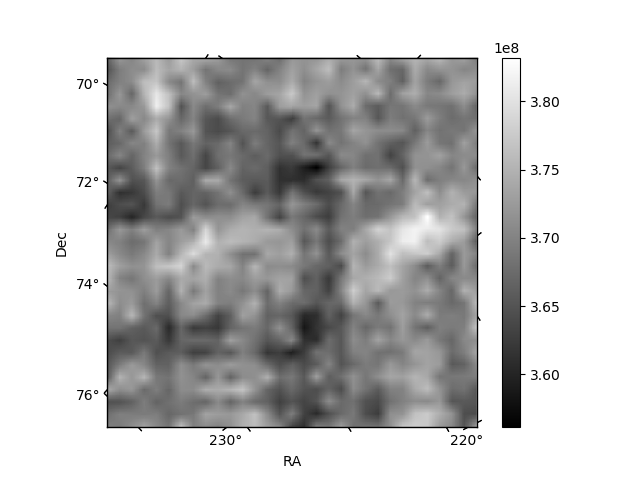
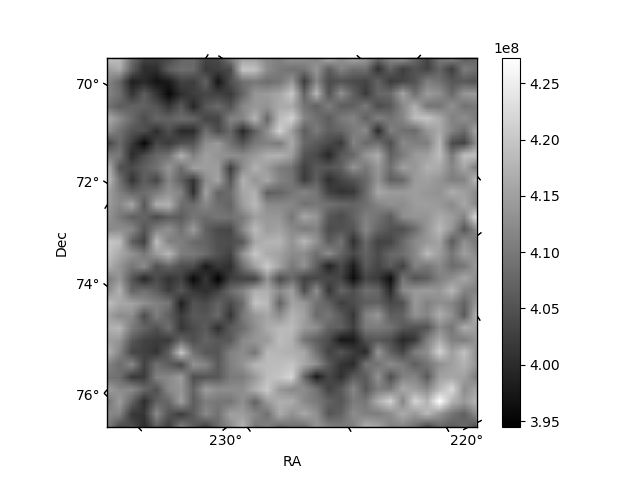
Histogram calculated using DETX and DETY for each event in the final _common_clean file
| Quadrant A | 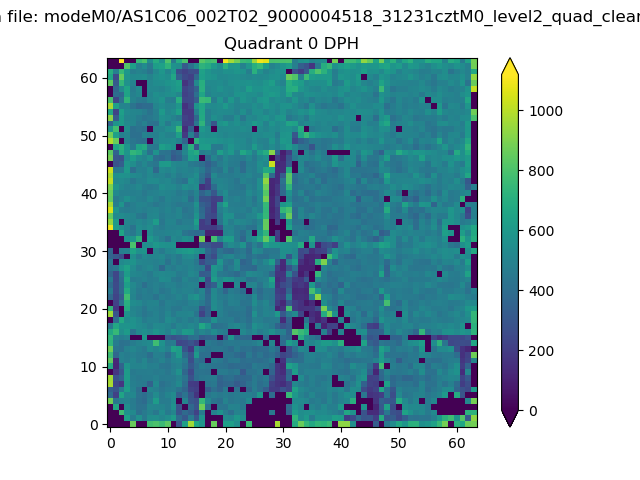 |
 |
Quadrant B |
|---|---|---|---|
| Quadrant D | 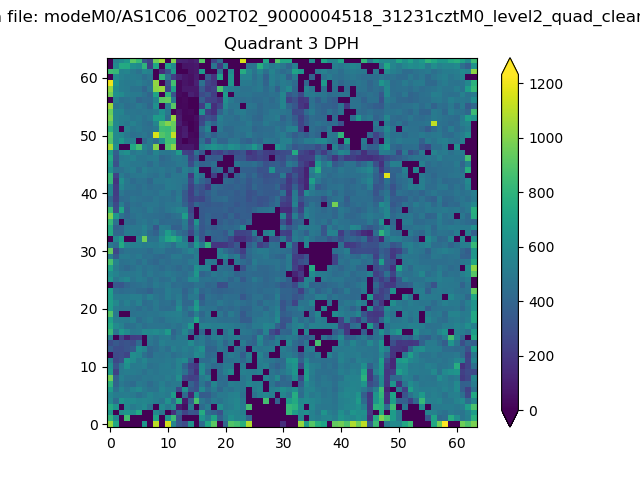 |
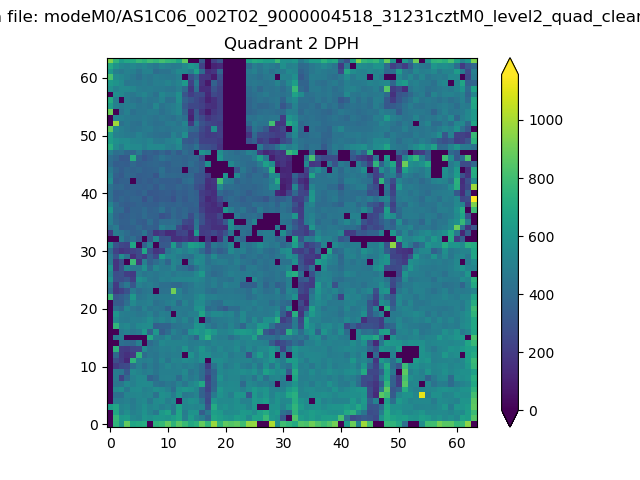 |
Quadrant C |
| Plot type | Count rate plots | Images |
|---|---|---|
| Comparison with Poisson distribution Blue bars denote a histogram of data divided into 1 sec bins. Red curve is a Poisson curve with rate = median count rate of data. |
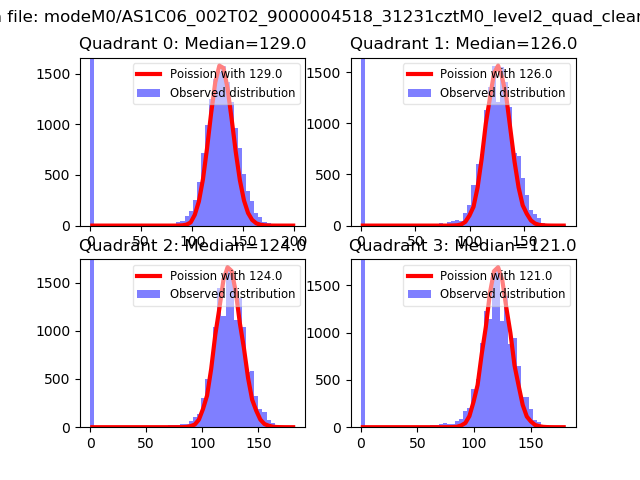 |
 |
| Quadrant-wise count rates Data is divided into 100 sec bins |
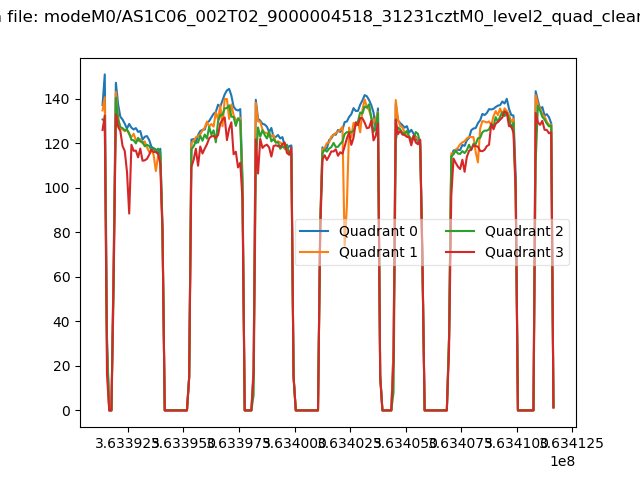 |
|
| Module-wise count rates for Quadrant A Data is divided into 100 sec bins |
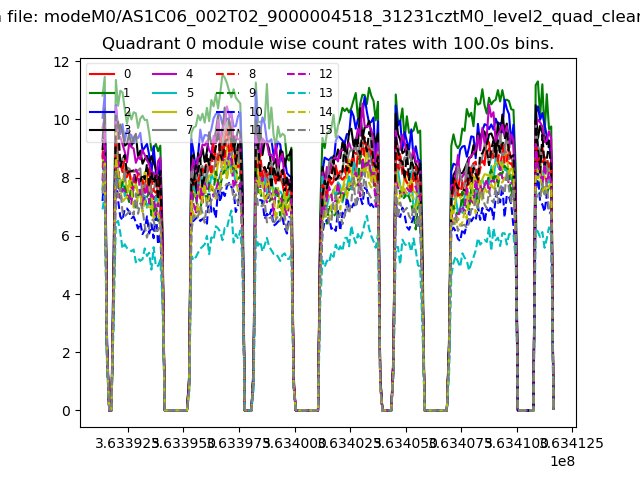 |
 |
| Module-wise count rates for Quadrant B Data is divided into 100 sec bins |
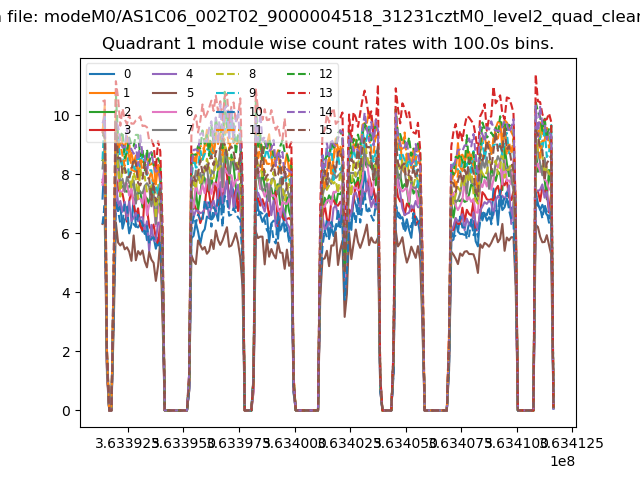 |
 |
| Module-wise count rates for Quadrant C Data is divided into 100 sec bins |
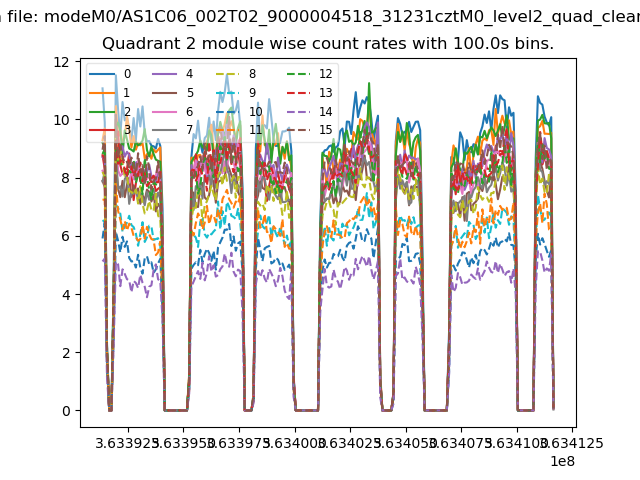 |
 |
| Module-wise count rates for Quadrant D Data is divided into 100 sec bins |
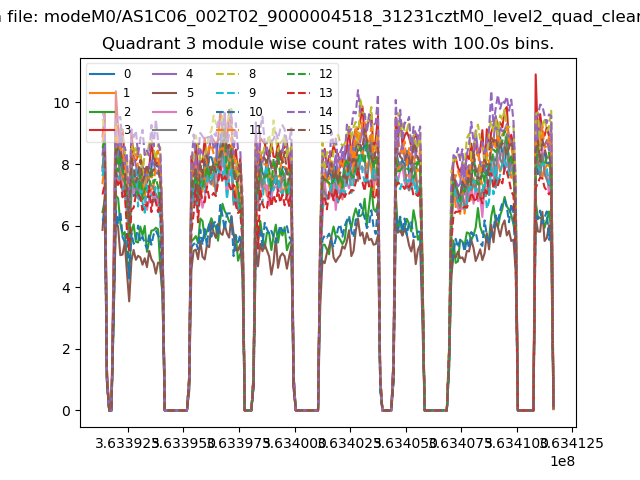 |
 |
| Parameter | Plot |
|---|---|
| CZT HV Monitor | 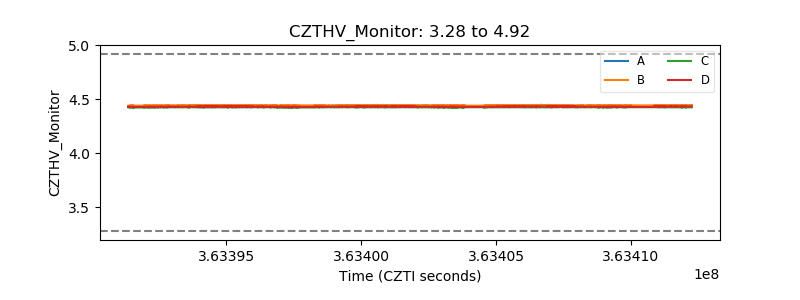 |
| D_VDD | 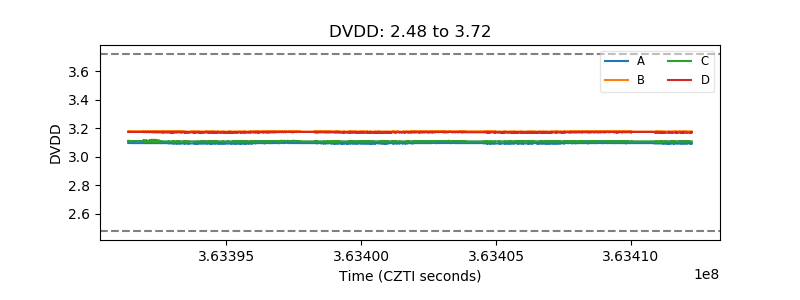 |
| Temperature 1 | 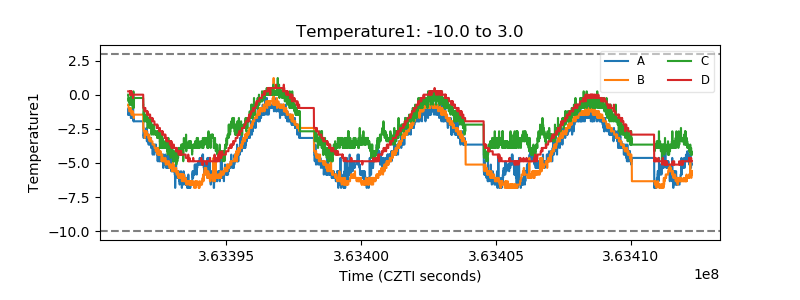 |
| Veto HV Monitor | 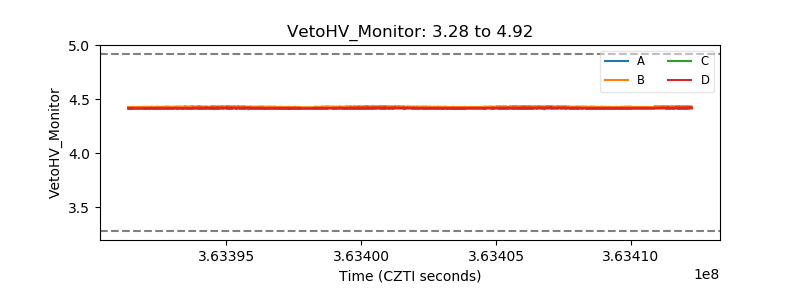 |
| Veto LLD | 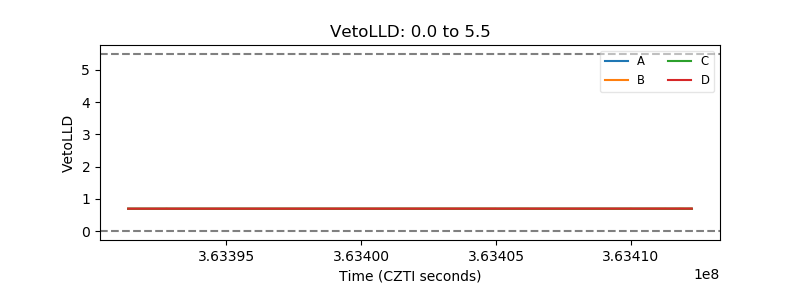 |
| Alpha Counter | 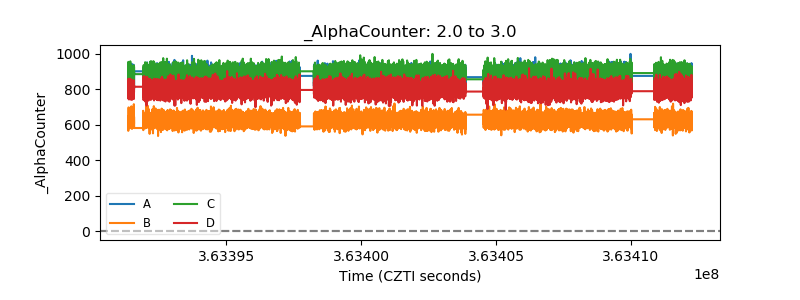 |
| _CPM_Rate | 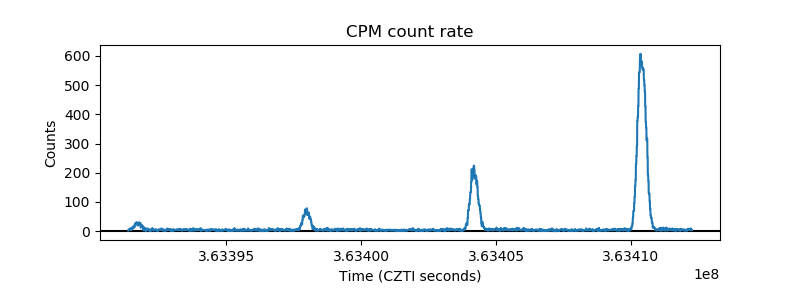 |
| CZT Counter |  |
| +2.5 Volts monitor |  |
| +5 Volts monitor |  |
| _ROLL_ROT | 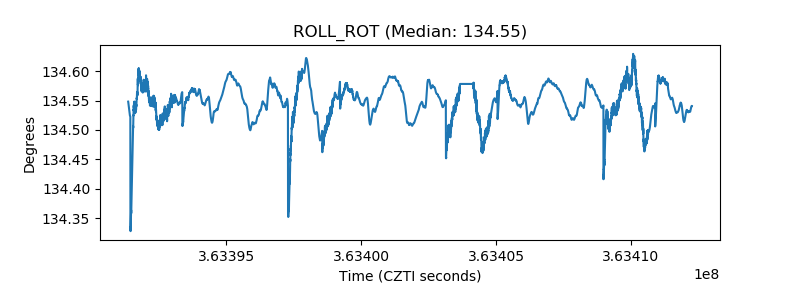 |
| _Roll_DEC | 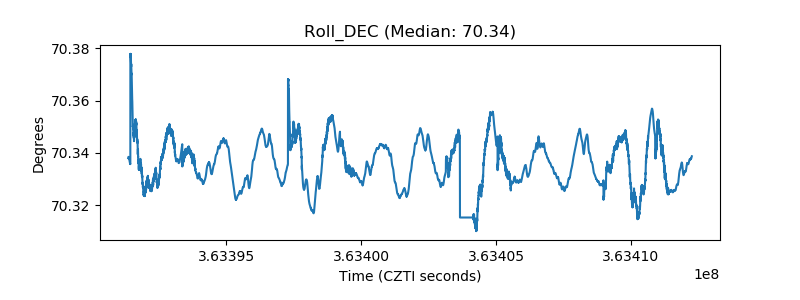 |
| _Roll_RA |  |
| Veto Counter | 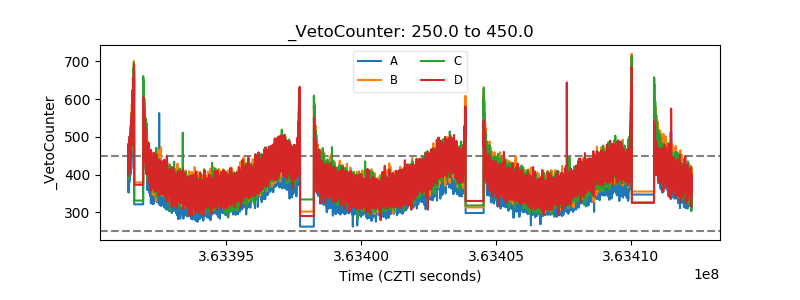 |