| Param | Original file | Final file |
|---|---|---|
| Filename | modeM0/AS1C06_002T02_9000004518_31232cztM0_level2.evt | modeM0/AS1C06_002T02_9000004518_31232cztM0_level2_quad_clean.evt |
| Size (bytes) | 580,671,360 | 89,565,120 |
| Size | 553.8 MB | 85.4 MB |
| Events in quadrant A | 3,095,876 | 582,745 |
| Events in quadrant B | 5,219,900 | 573,051 |
| Events in quadrant C | 3,814,754 | 553,304 |
| Events in quadrant D | 5,005,981 | 540,323 |
| Mode SS | |||
|---|---|---|---|
| Quadrant | BADHDUFLAG | Total packets | Discarded packets |
| A | 0 | 136 | 0 |
| B | 0 | 136 | 0 |
| C | 0 | 136 | 0 |
| D | 0 | 136 | 0 |
| Mode M9 | |||
|---|---|---|---|
| Quadrant | BADHDUFLAG | Total packets | Discarded packets |
| A | 0 | 9 | 0 |
| B | 0 | 9 | 0 |
| C | 0 | 9 | 0 |
| D | 0 | 9 | 0 |
| Mode M0 | |||
|---|---|---|---|
| Quadrant | BADHDUFLAG | Total packets | Discarded packets |
| A | 0 | 13429 | 2 |
| B | 0 | 20289 | 2 |
| C | 0 | 15512 | 2 |
| D | 0 | 19416 | 2 |
| Quadrant | Total seconds | Saturated seconds | Saturation percentage |
|---|---|---|---|
| A | 6634 | 28 | 0.422068% |
| B | 6634 | 97 | 1.462165% |
| C | 6635 | 182 | 2.743029% |
| D | 6635 | 129 | 1.944235% |
Noise dominated data is calculated using 1-second bins in cleaned event files. If a bin has >2000 counts, and if more than 50% of those come from <1% of pixels, then it is considered to be noise-dominated and hence unusable.
| Quadrant | # 1 sec bins | Bins with >0 counts | Bins with >2000 counts | High rate bins dominated by noise | Noise dominated (total time) | Noise dominated (detector-on time) | Marked lightcurve |
|---|---|---|---|---|---|---|---|
| A | 7614 | 6635 | 0 | 0 | 0.00% | 0.00% | 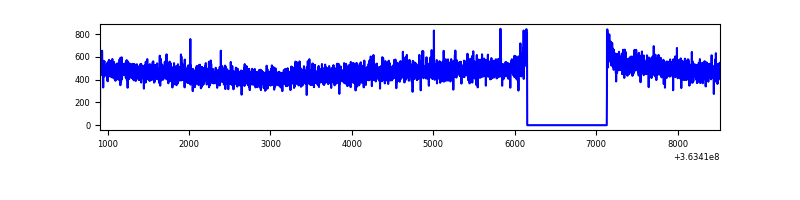 |
| B | 7614 | 6635 | 11 | 11 | 0.14% | 0.17% | 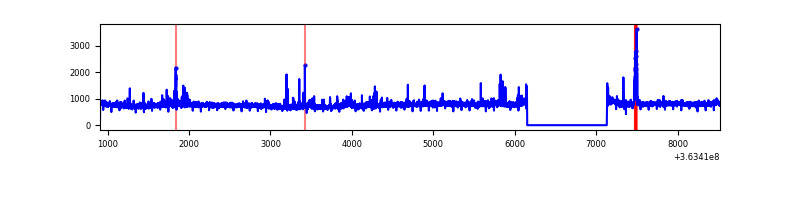 |
| C | 7615 | 6636 | 53 | 53 | 0.70% | 0.80% | 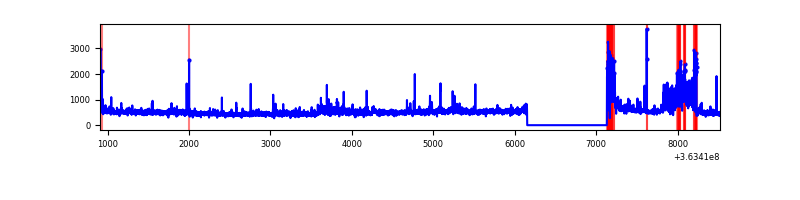 |
| D | 7615 | 6636 | 71 | 71 | 0.93% | 1.07% | 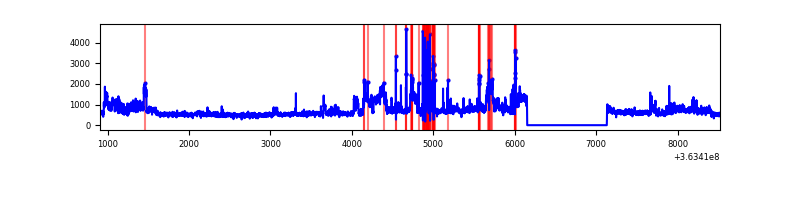 |
Top three noisy pixels from each quadrant. If the there are fewer than three noisy pixels in the level2.evt file, extra rows are filled as -1
| Pixel properties | Quadrant properties | ||||||
|---|---|---|---|---|---|---|---|
| Quadrant | DetID | PixID | Counts | Sigma | Mean | Median | Sigma |
| A | 13 | 254 | 13537 | 78.9 | 801 | 785 | 161.6 |
| A | 3 | 137 | 8112 | 45.33 | 801 | 785 | 161.6 |
| A | 0 | 226 | 6702 | 36.61 | 801 | 785 | 161.6 |
| B | 6 | 159 | 1871037 | 12405.02 | 789 | 769 | 150.8 |
| B | 4 | 171 | 90141 | 592.78 | 789 | 769 | 150.8 |
| B | 4 | 80 | 69988 | 459.11 | 789 | 769 | 150.8 |
| C | 0 | 10 | 274724 | 1543.89 | 758 | 762 | 177.4 |
| C | 3 | 233 | 245290 | 1378.01 | 758 | 762 | 177.4 |
| C | 10 | 22 | 187937 | 1054.81 | 758 | 762 | 177.4 |
| D | 8 | 195 | 1735104 | 8695.37 | 757 | 742 | 199.5 |
| D | 13 | 249 | 232484 | 1161.86 | 757 | 742 | 199.5 |
| D | 12 | 79 | 88503 | 440.0 | 757 | 742 | 199.5 |
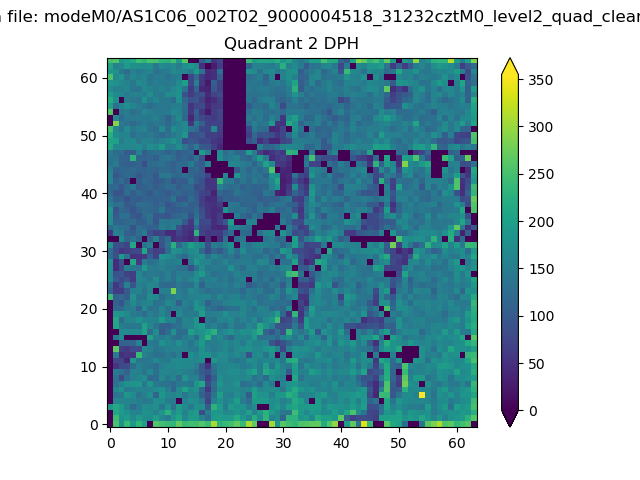
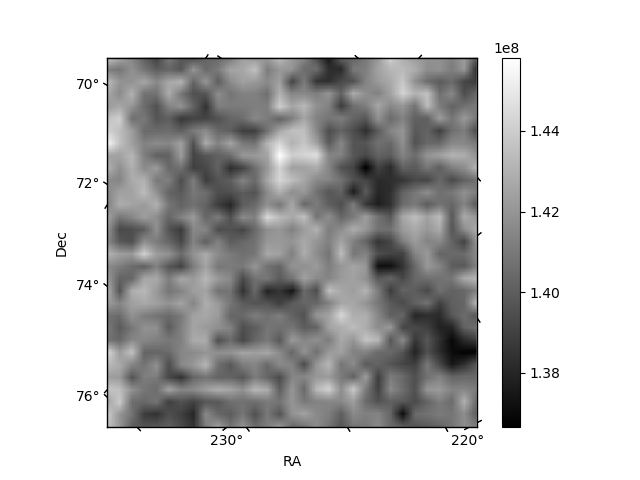
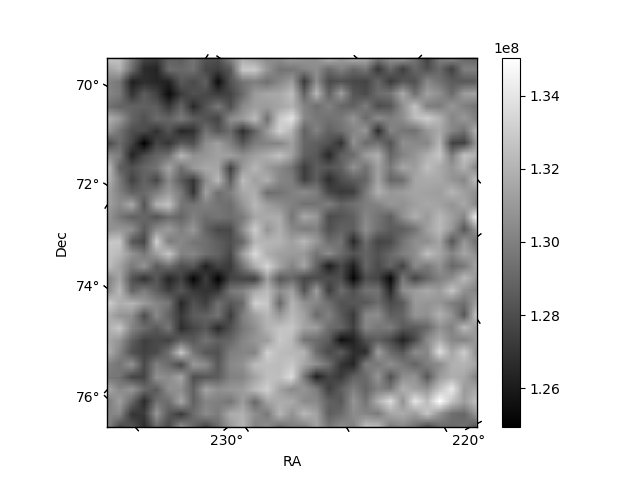
Histogram calculated using DETX and DETY for each event in the final _common_clean file
| Quadrant A | 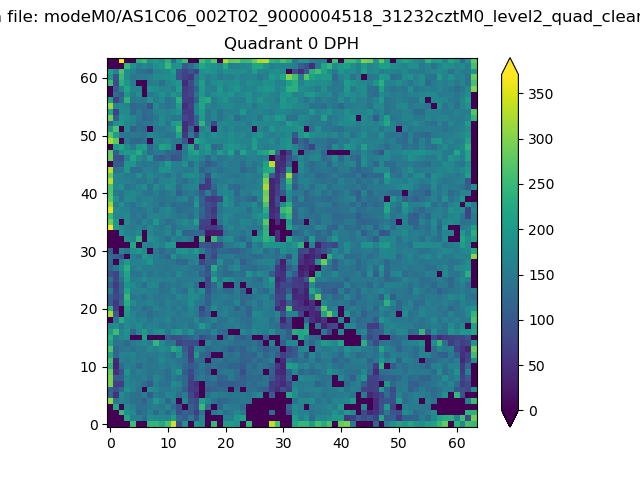 |
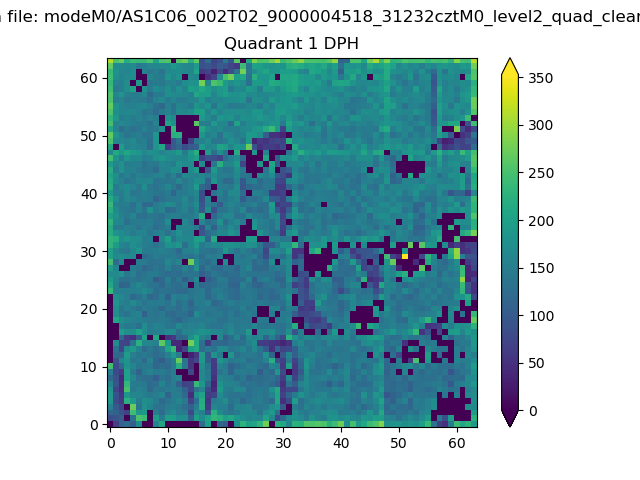 |
Quadrant B |
|---|---|---|---|
| Quadrant D | 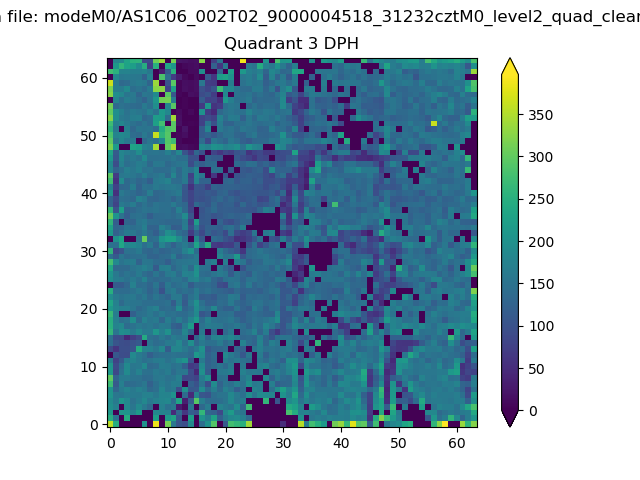 |
 |
Quadrant C |
| Plot type | Count rate plots | Images |
|---|---|---|
| Comparison with Poisson distribution Blue bars denote a histogram of data divided into 1 sec bins. Red curve is a Poisson curve with rate = median count rate of data. |
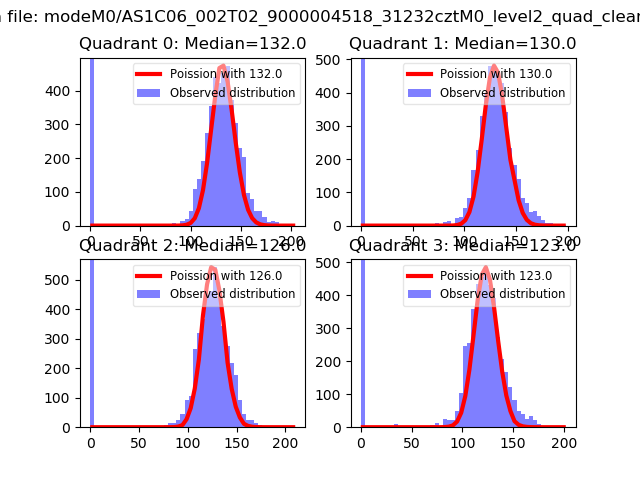 |
 |
| Quadrant-wise count rates Data is divided into 100 sec bins |
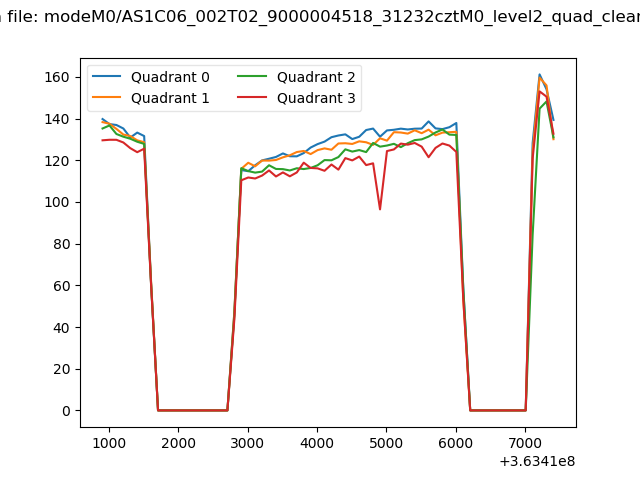 |
|
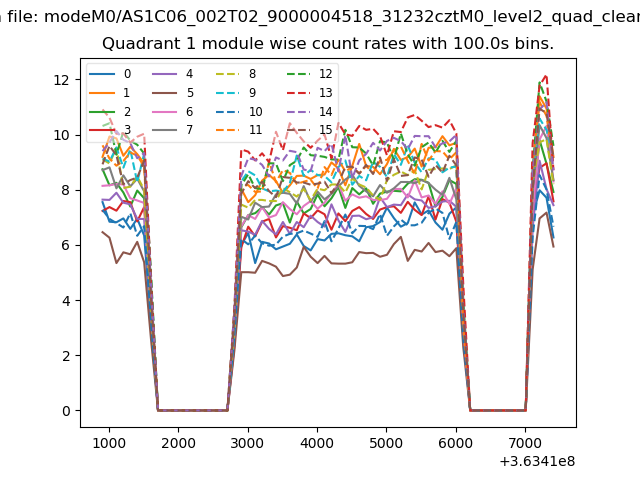
| Module-wise count rates for Quadrant A Data is divided into 100 sec bins |
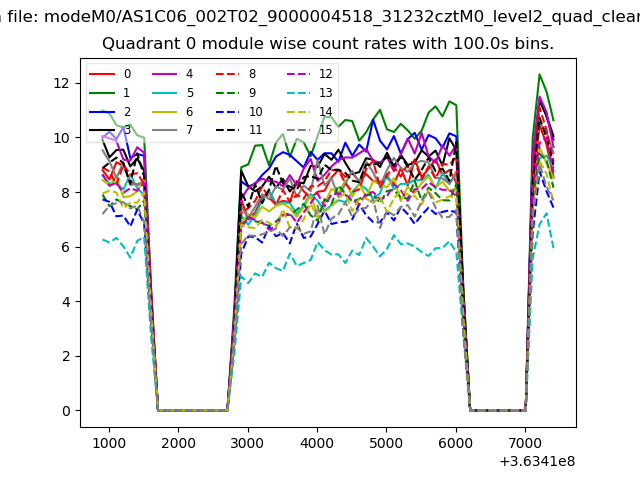 |
 |
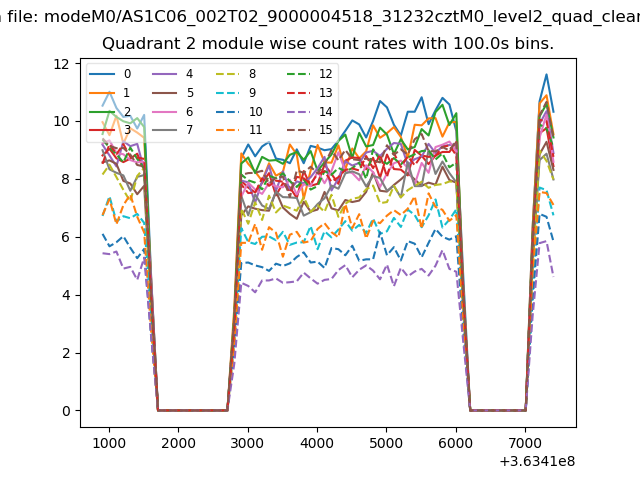
| Module-wise count rates for Quadrant B Data is divided into 100 sec bins |
 |
 |
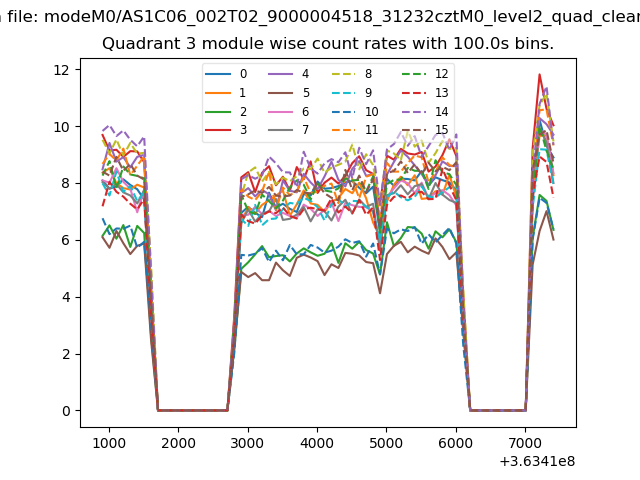
| Module-wise count rates for Quadrant C Data is divided into 100 sec bins |
 |
 |
| Module-wise count rates for Quadrant D Data is divided into 100 sec bins |
 |
 |
| Parameter | Plot |
|---|---|
| CZT HV Monitor | 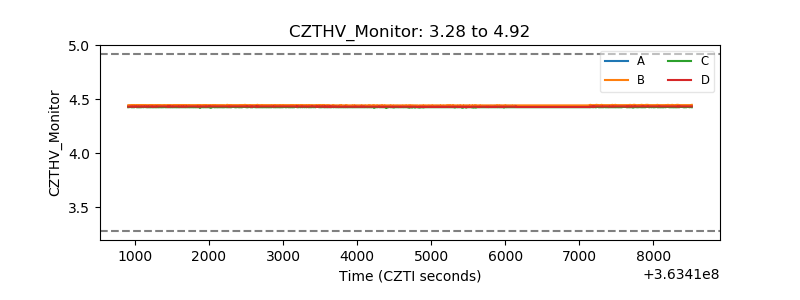 |
| D_VDD | 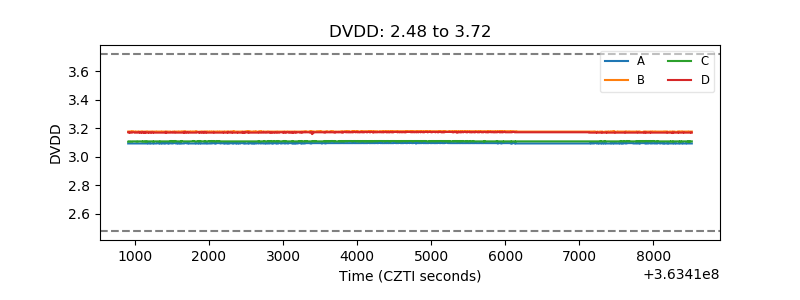 |
| Temperature 1 | 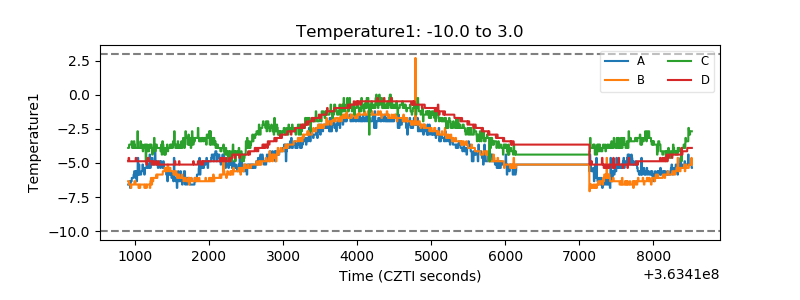 |
| Veto HV Monitor | 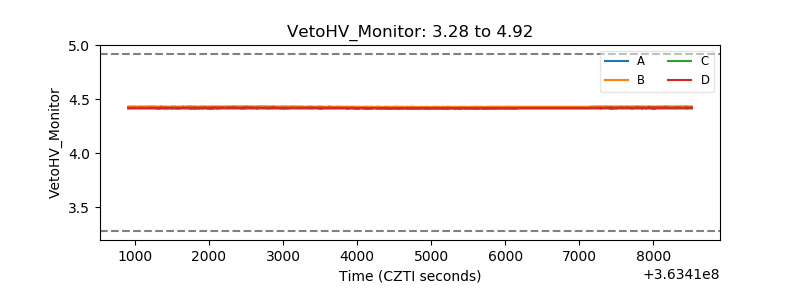 |
| Veto LLD | 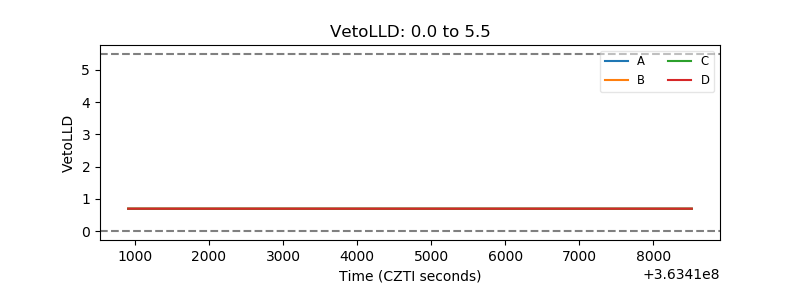 |
| Alpha Counter | 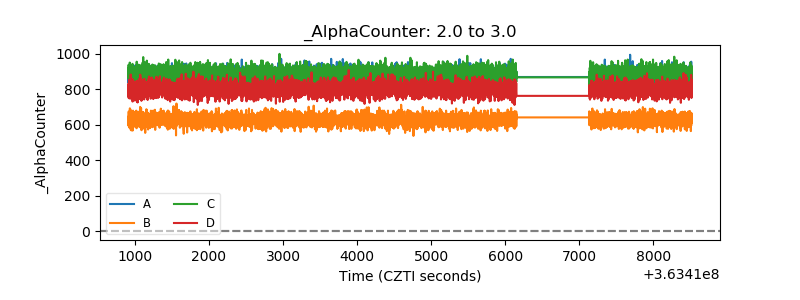 |
| _CPM_Rate | 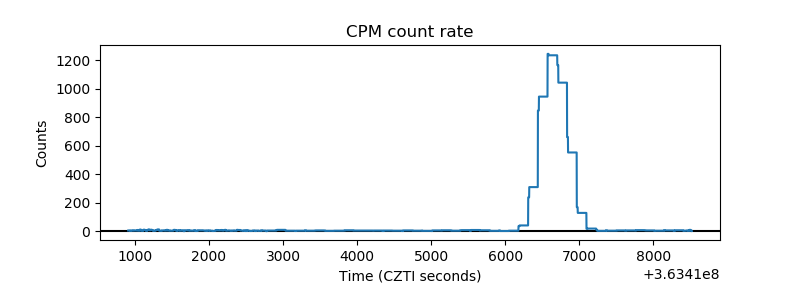 |
| CZT Counter | 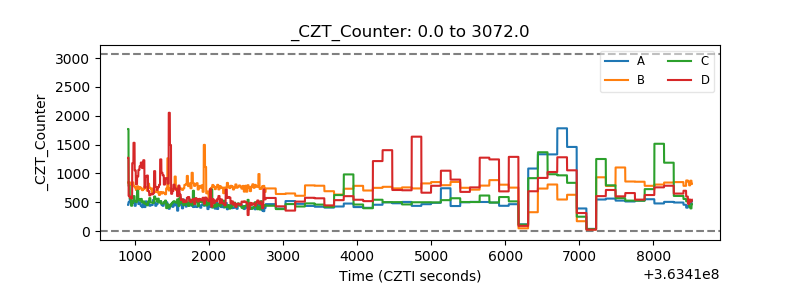 |
| +2.5 Volts monitor |  |
| +5 Volts monitor |  |
| _ROLL_ROT | 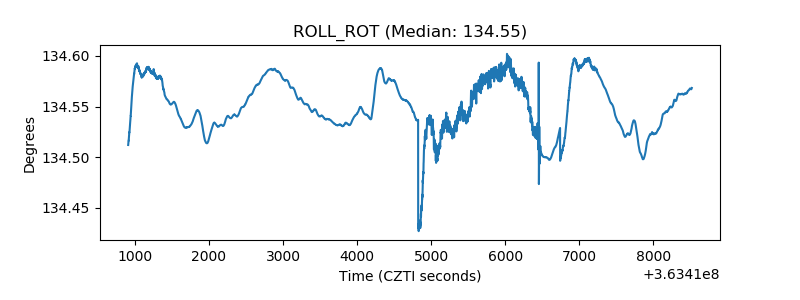 |
| _Roll_DEC | 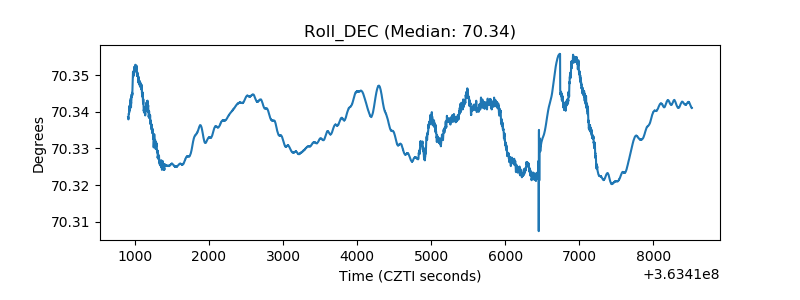 |
| _Roll_RA | 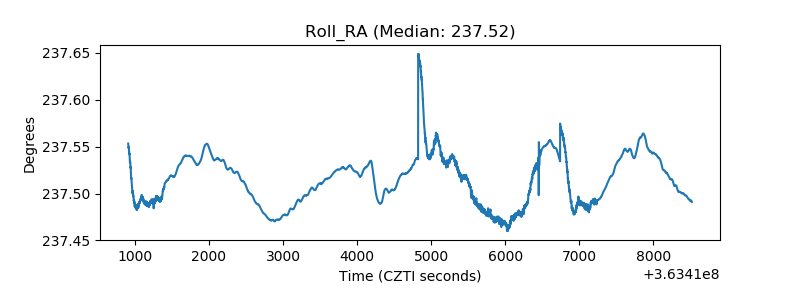 |
| Veto Counter | 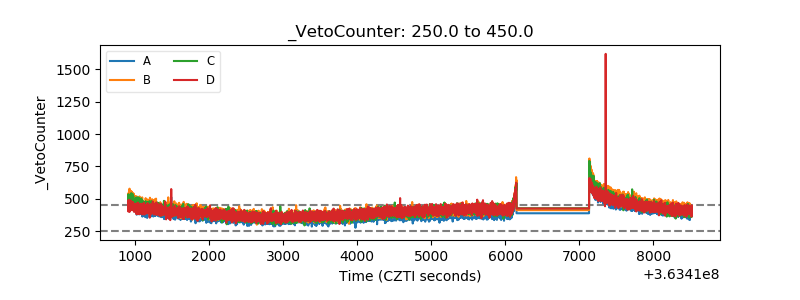 |