| Param | Original file | Final file |
|---|---|---|
| Filename | modeM0/AS1C06_002T02_9000004518_31234cztM0_level2.evt | modeM0/AS1C06_002T02_9000004518_31234cztM0_level2_quad_clean.evt |
| Size (bytes) | 645,776,640 | 85,933,440 |
| Size | 615.9 MB | 82.0 MB |
| Events in quadrant A | 3,197,882 | 562,361 |
| Events in quadrant B | 6,742,023 | 535,307 |
| Events in quadrant C | 4,008,575 | 529,008 |
| Events in quadrant D | 5,168,359 | 520,588 |
| Mode SS | |||
|---|---|---|---|
| Quadrant | BADHDUFLAG | Total packets | Discarded packets |
| A | 0 | 134 | 0 |
| B | 0 | 134 | 0 |
| C | 0 | 134 | 0 |
| D | 0 | 134 | 0 |
| Mode M9 | |||
|---|---|---|---|
| Quadrant | BADHDUFLAG | Total packets | Discarded packets |
| A | 0 | 12 | 0 |
| B | 0 | 13 | 0 |
| C | 0 | 13 | 0 |
| D | 0 | 13 | 0 |
| Mode M0 | |||
|---|---|---|---|
| Quadrant | BADHDUFLAG | Total packets | Discarded packets |
| A | 0 | 13576 | 2 |
| B | 0 | 24491 | 2 |
| C | 0 | 16002 | 2 |
| D | 0 | 20157 | 4 |
| Quadrant | Total seconds | Saturated seconds | Saturation percentage |
|---|---|---|---|
| A | 6515 | 42 | 0.644666% |
| B | 6515 | 778 | 11.941673% |
| C | 6515 | 259 | 3.975441% |
| D | 6514 | 119 | 1.826835% |
Noise dominated data is calculated using 1-second bins in cleaned event files. If a bin has >2000 counts, and if more than 50% of those come from <1% of pixels, then it is considered to be noise-dominated and hence unusable.
| Quadrant | # 1 sec bins | Bins with >0 counts | Bins with >2000 counts | High rate bins dominated by noise | Noise dominated (total time) | Noise dominated (detector-on time) | Marked lightcurve |
|---|---|---|---|---|---|---|---|
| A | 7625 | 6516 | 1 | 1 | 0.01% | 0.02% | 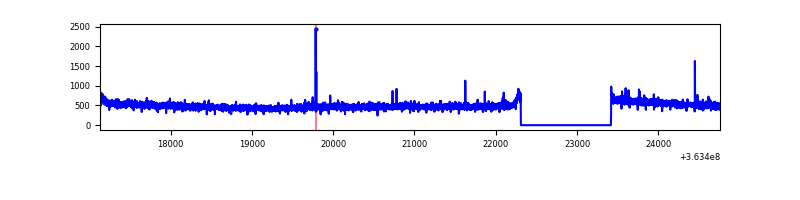 |
| B | 7625 | 6516 | 446 | 446 | 5.85% | 6.84% | 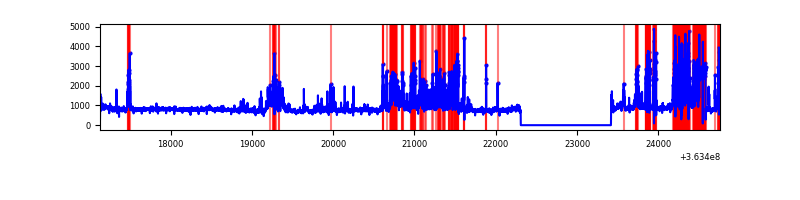 |
| C | 7625 | 6516 | 68 | 68 | 0.89% | 1.04% | 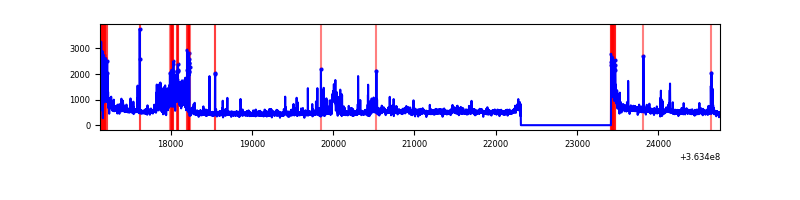 |
| D | 7624 | 6515 | 35 | 35 | 0.46% | 0.54% | 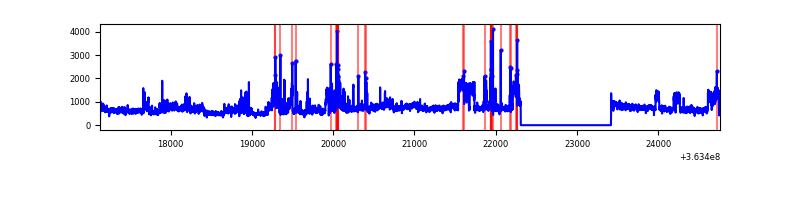 |
Top three noisy pixels from each quadrant. If the there are fewer than three noisy pixels in the level2.evt file, extra rows are filled as -1
| Pixel properties | Quadrant properties | ||||||
|---|---|---|---|---|---|---|---|
| Quadrant | DetID | PixID | Counts | Sigma | Mean | Median | Sigma |
| A | 12 | 96 | 16678 | 96.55 | 824 | 808 | 164.4 |
| A | 13 | 254 | 12451 | 70.83 | 824 | 808 | 164.4 |
| A | 3 | 137 | 7831 | 42.73 | 824 | 808 | 164.4 |
| B | 6 | 159 | 1758051 | 12063.89 | 775 | 756 | 145.7 |
| B | 14 | 167 | 864434 | 5929.18 | 775 | 756 | 145.7 |
| B | 4 | 80 | 838669 | 5752.3 | 775 | 756 | 145.7 |
| C | 0 | 10 | 323873 | 1812.88 | 767 | 770 | 178.2 |
| C | 3 | 233 | 296164 | 1657.41 | 767 | 770 | 178.2 |
| C | 10 | 22 | 212384 | 1187.33 | 767 | 770 | 178.2 |
| D | 8 | 195 | 1905815 | 9583.55 | 780 | 764 | 198.8 |
| D | 2 | 250 | 174264 | 872.81 | 780 | 764 | 198.8 |
| D | 13 | 249 | 41131 | 203.07 | 780 | 764 | 198.8 |
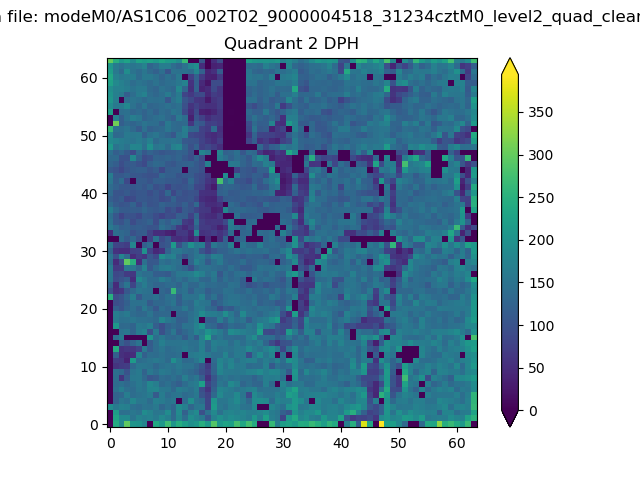
Histogram calculated using DETX and DETY for each event in the final _common_clean file
| Quadrant A | 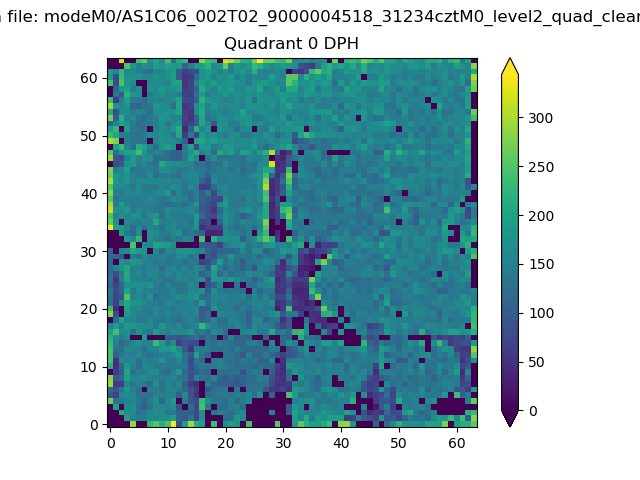 |
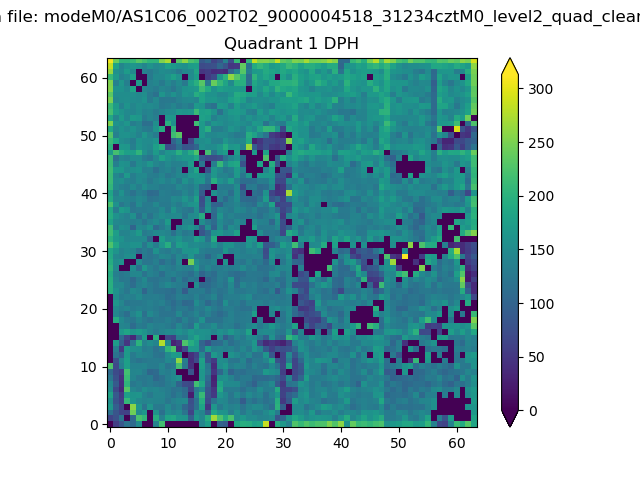 |
Quadrant B |
|---|---|---|---|
| Quadrant D | 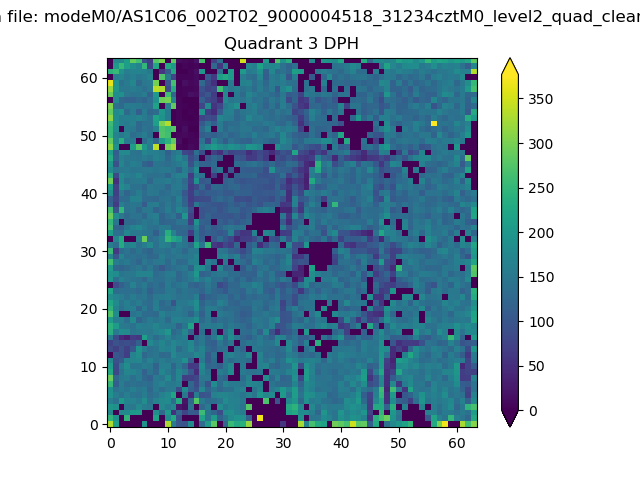 |
 |
Quadrant C |
| Plot type | Count rate plots | Images |
|---|---|---|
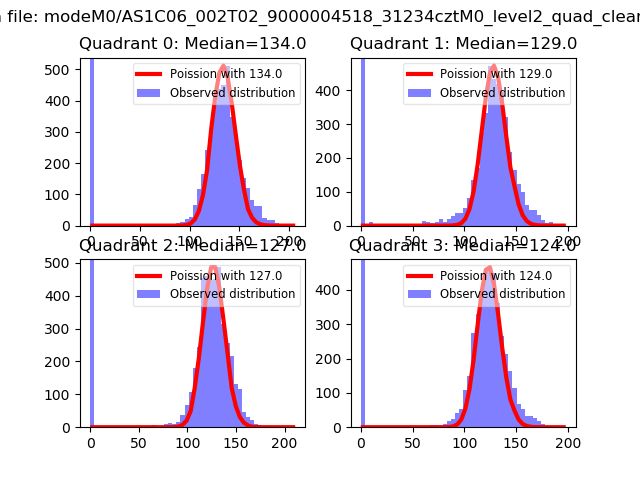
| Comparison with Poisson distribution Blue bars denote a histogram of data divided into 1 sec bins. Red curve is a Poisson curve with rate = median count rate of data. |
 |
 |
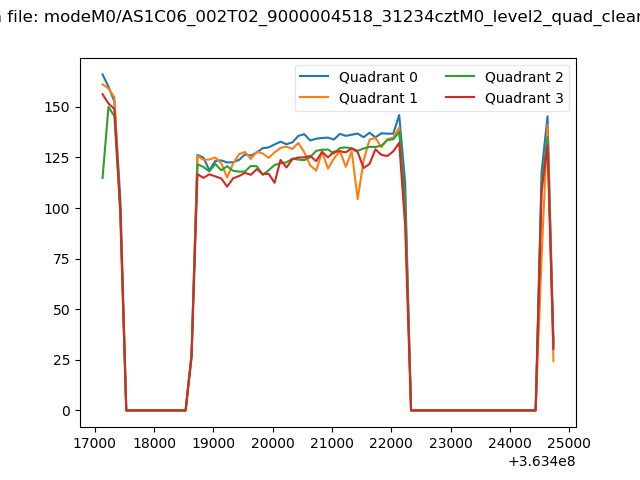
| Quadrant-wise count rates Data is divided into 100 sec bins |
 |
|
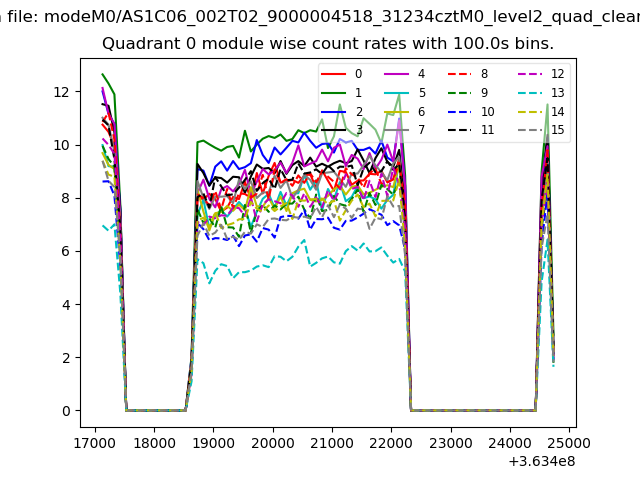
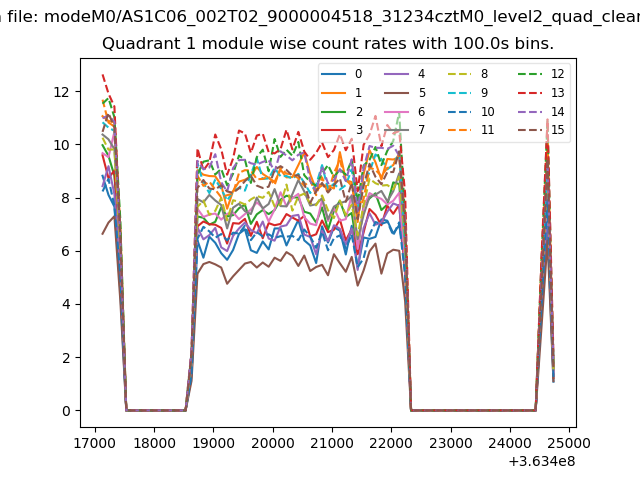
| Module-wise count rates for Quadrant A Data is divided into 100 sec bins |
 |
 |
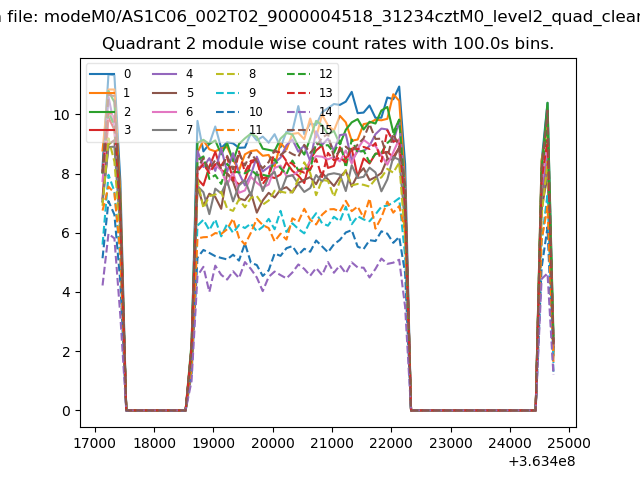
| Module-wise count rates for Quadrant B Data is divided into 100 sec bins |
 |
 |
| Module-wise count rates for Quadrant C Data is divided into 100 sec bins |
 |
 |
| Module-wise count rates for Quadrant D Data is divided into 100 sec bins |
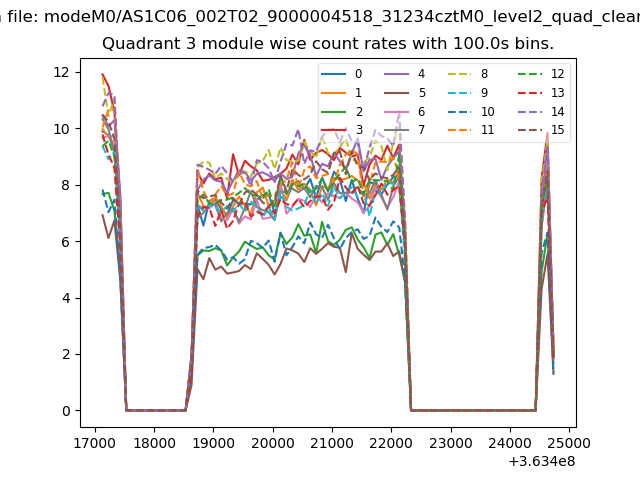 |
 |
| Parameter | Plot |
|---|---|
| CZT HV Monitor | 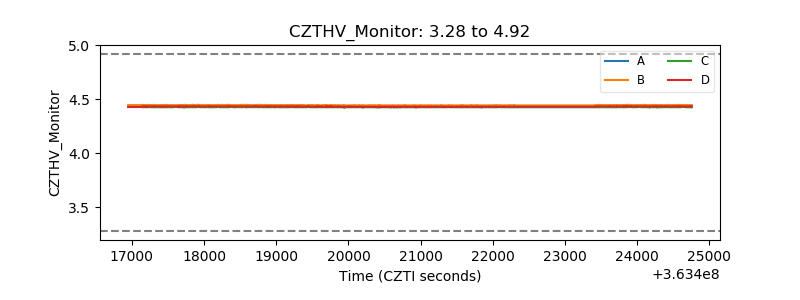 |
| D_VDD | 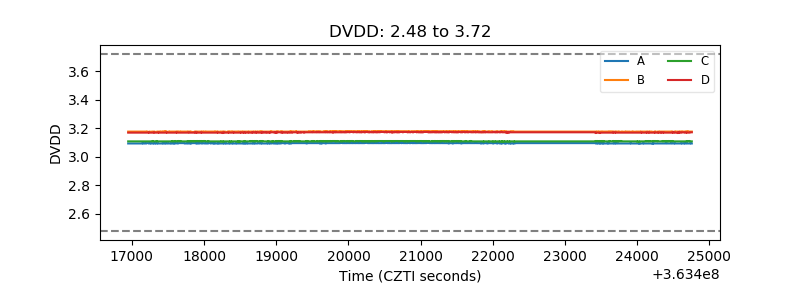 |
| Temperature 1 | 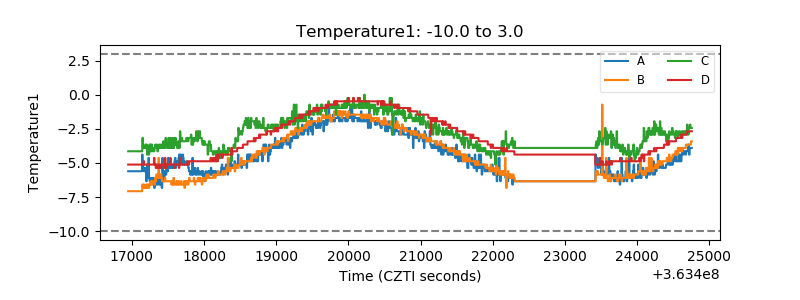 |
| Veto HV Monitor | 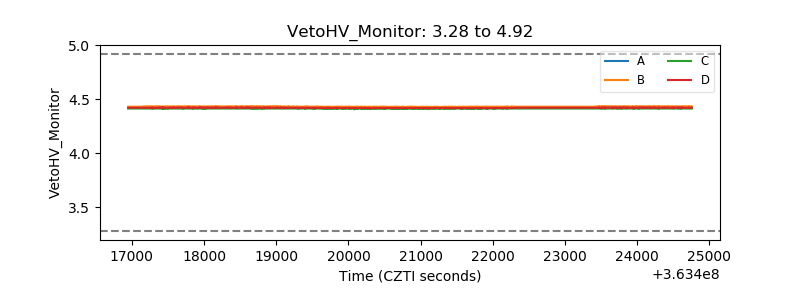 |
| Veto LLD | 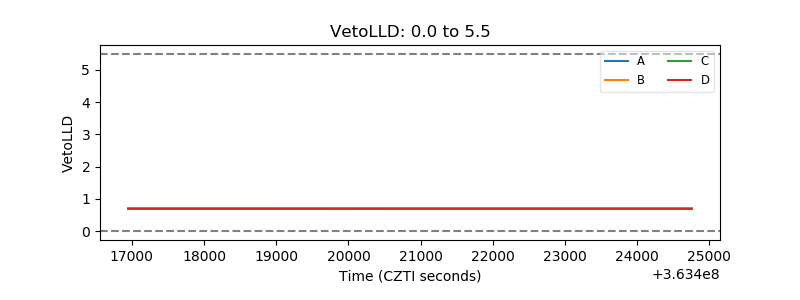 |
| Alpha Counter | 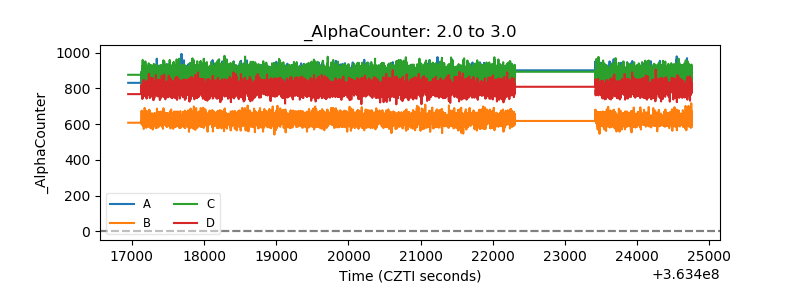 |
| _CPM_Rate | 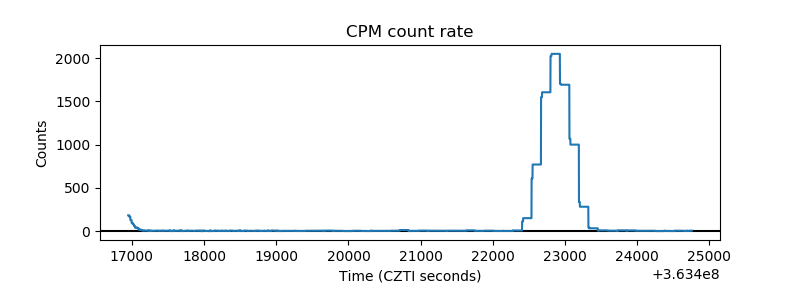 |
| CZT Counter | 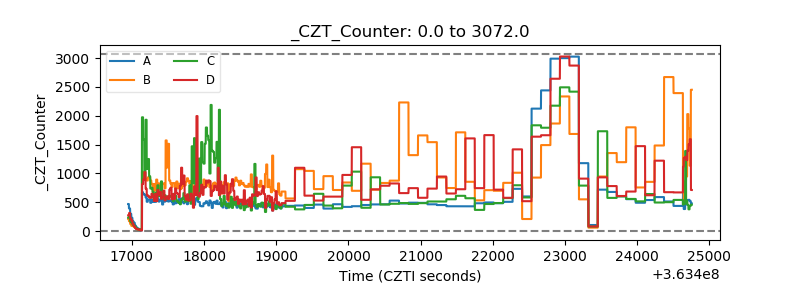 |
| +2.5 Volts monitor |  |
| +5 Volts monitor |  |
| _ROLL_ROT | 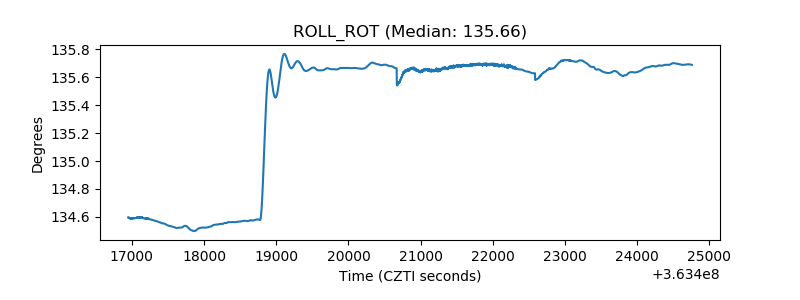 |
| _Roll_DEC | 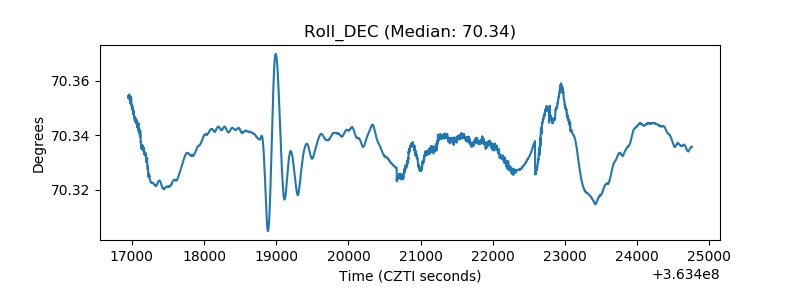 |
| _Roll_RA | 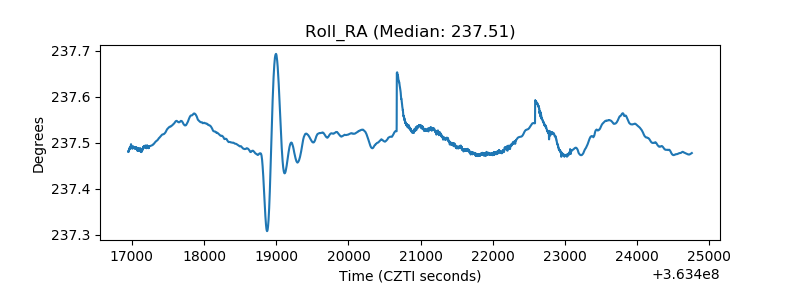 |
| Veto Counter | 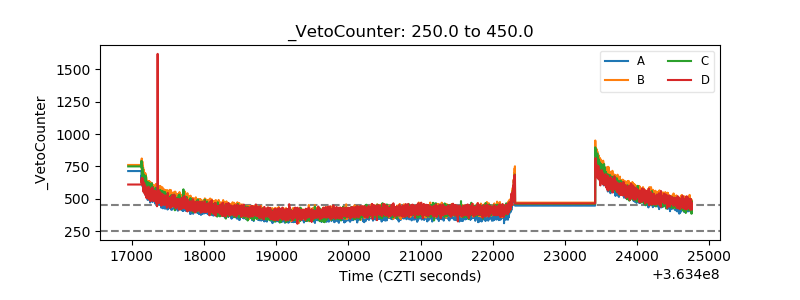 |