| Param | Original file | Final file |
|---|---|---|
| Filename | modeM0/AS1C06_002T02_9000004518_31235cztM0_level2.evt | modeM0/AS1C06_002T02_9000004518_31235cztM0_level2_quad_clean.evt |
| Size (bytes) | 527,328,000 | 91,163,520 |
| Size | 502.9 MB | 86.9 MB |
| Events in quadrant A | 2,742,424 | 629,354 |
| Events in quadrant B | 5,434,315 | 586,965 |
| Events in quadrant C | 3,029,930 | 590,582 |
| Events in quadrant D | 4,399,573 | 577,180 |
| Mode SS | |||
|---|---|---|---|
| Quadrant | BADHDUFLAG | Total packets | Discarded packets |
| A | 0 | 120 | 12 |
| B | 0 | 120 | 12 |
| C | 0 | 120 | 14 |
| D | 0 | 120 | 10 |
| Mode M9 | |||
|---|---|---|---|
| Quadrant | BADHDUFLAG | Total packets | Discarded packets |
| A | 0 | 12 | 0 |
| B | 0 | 12 | 0 |
| C | 0 | 12 | 0 |
| D | 0 | 12 | 0 |
| Mode M0 | |||
|---|---|---|---|
| Quadrant | BADHDUFLAG | Total packets | Discarded packets |
| A | 0 | 12641 | 1114 |
| B | 0 | 23107 | 3079 |
| C | 0 | 13430 | 1200 |
| D | 0 | 19140 | 1822 |
| Quadrant | Total seconds | Saturated seconds | Saturation percentage |
|---|---|---|---|
| A | 5405 | 40 | 0.740056% |
| B | 5371 | 632 | 11.766896% |
| C | 5396 | 167 | 3.094885% |
| D | 5360 | 94 | 1.753731% |
Noise dominated data is calculated using 1-second bins in cleaned event files. If a bin has >2000 counts, and if more than 50% of those come from <1% of pixels, then it is considered to be noise-dominated and hence unusable.
| Quadrant | # 1 sec bins | Bins with >0 counts | Bins with >2000 counts | High rate bins dominated by noise | Noise dominated (total time) | Noise dominated (detector-on time) | Marked lightcurve |
|---|---|---|---|---|---|---|---|
| A | 7150 | 5449 | 0 | 0 | 0.00% | 0.00% | 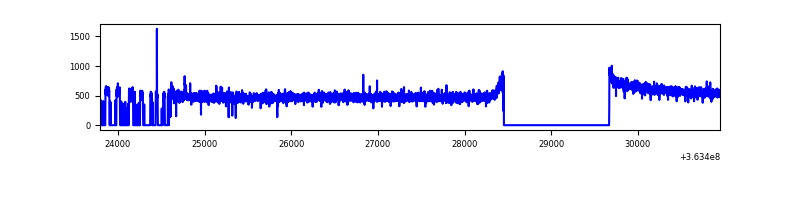 |
| B | 7153 | 5396 | 379 | 379 | 5.30% | 7.02% | 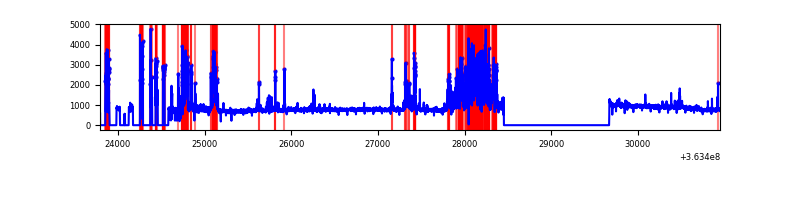 |
| C | 7153 | 5441 | 47 | 47 | 0.66% | 0.86% | 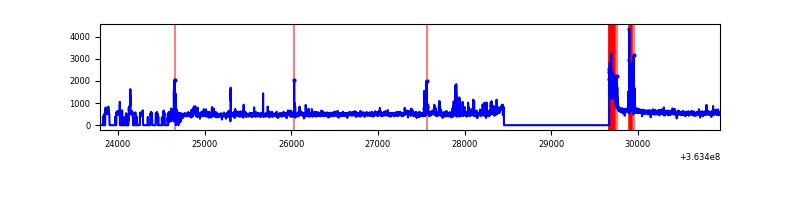 |
| D | 7092 | 5397 | 41 | 41 | 0.58% | 0.76% | 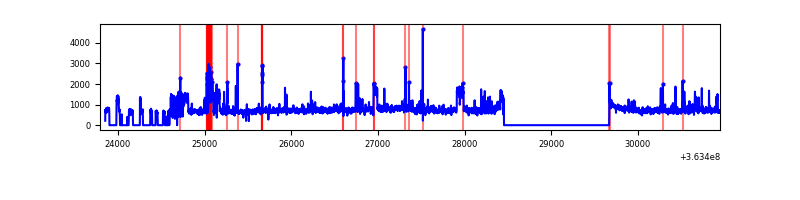 |
Top three noisy pixels from each quadrant. If the there are fewer than three noisy pixels in the level2.evt file, extra rows are filled as -1
| Pixel properties | Quadrant properties | ||||||
|---|---|---|---|---|---|---|---|
| Quadrant | DetID | PixID | Counts | Sigma | Mean | Median | Sigma |
| A | 13 | 254 | 9877 | 65.45 | 709 | 697 | 140.3 |
| A | 3 | 137 | 6497 | 41.35 | 709 | 697 | 140.3 |
| A | 0 | 226 | 6203 | 39.26 | 709 | 697 | 140.3 |
| B | 6 | 159 | 1404546 | 11277.02 | 659 | 645 | 124.5 |
| B | 14 | 167 | 1269383 | 10191.31 | 659 | 645 | 124.5 |
| B | 4 | 80 | 53546 | 424.93 | 659 | 645 | 124.5 |
| C | 0 | 10 | 198282 | 1304.22 | 656 | 659 | 151.5 |
| C | 14 | 238 | 110602 | 725.57 | 656 | 659 | 151.5 |
| C | 3 | 233 | 71056 | 464.59 | 656 | 659 | 151.5 |
| D | 8 | 195 | 1649062 | 9639.4 | 666 | 655 | 171.0 |
| D | 7 | 64 | 82011 | 475.75 | 666 | 655 | 171.0 |
| D | 2 | 250 | 64214 | 371.67 | 666 | 655 | 171.0 |
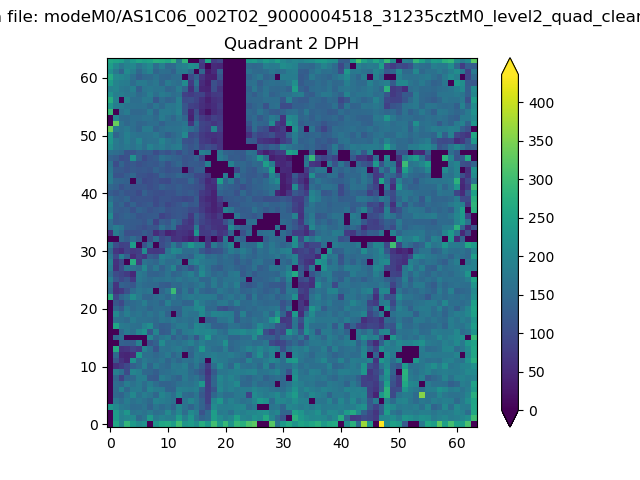
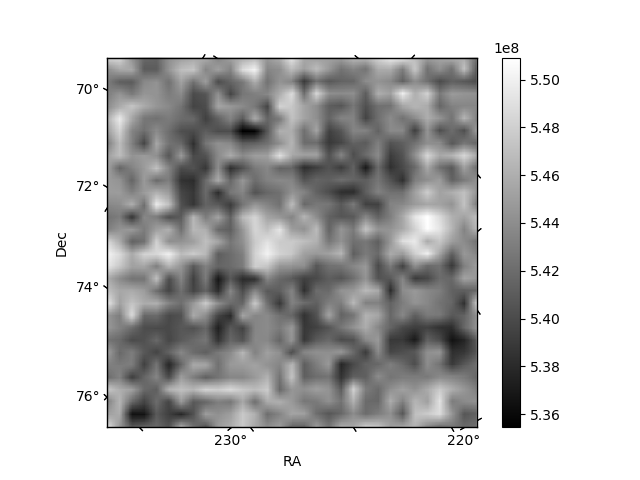
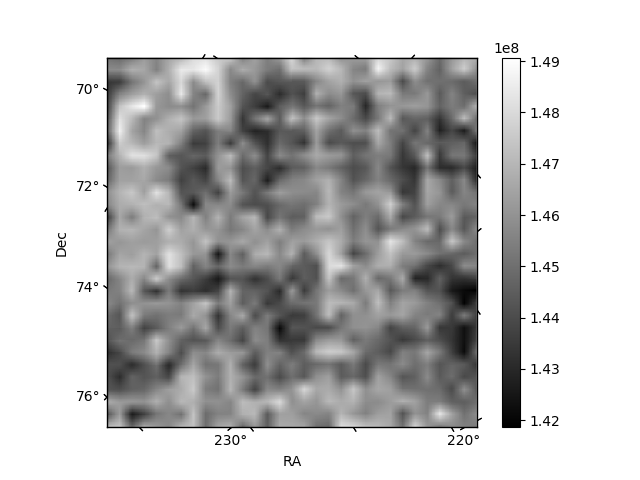
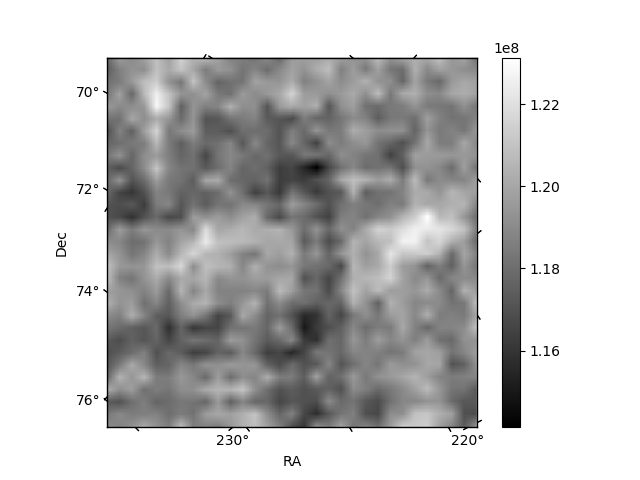
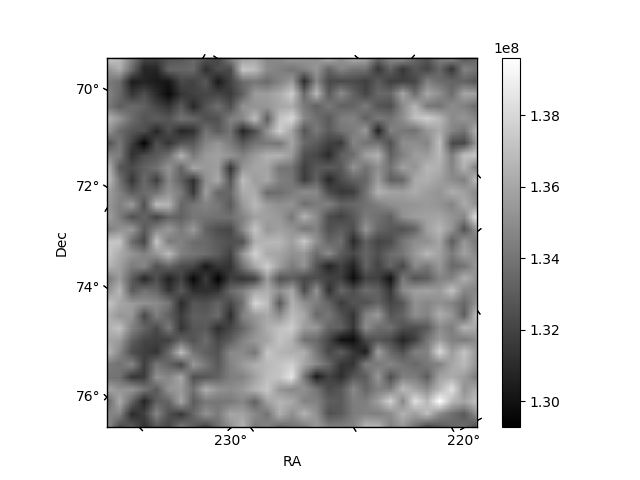
Histogram calculated using DETX and DETY for each event in the final _common_clean file
| Quadrant A | 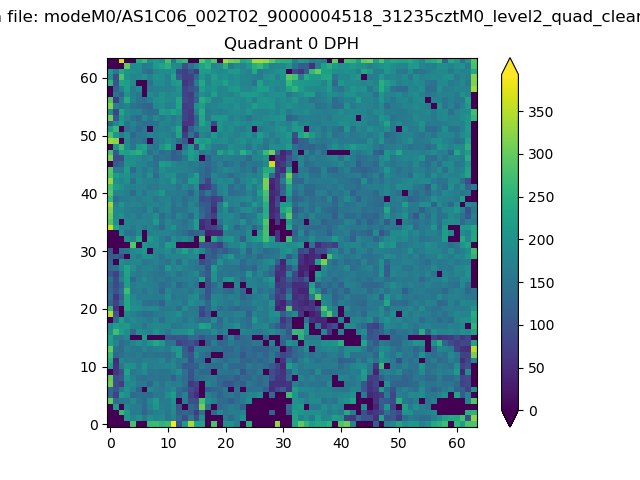 |
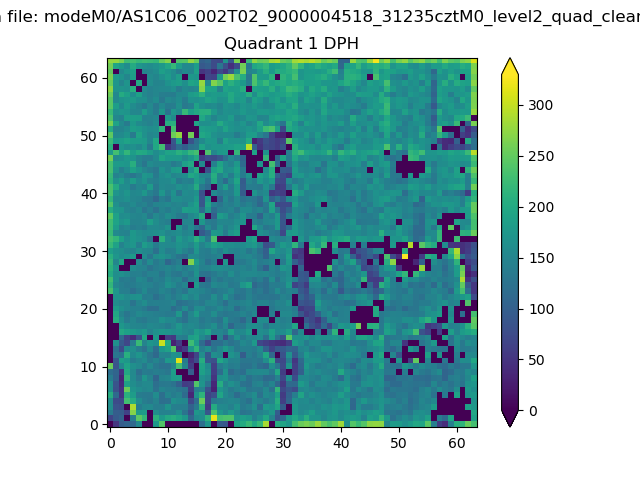 |
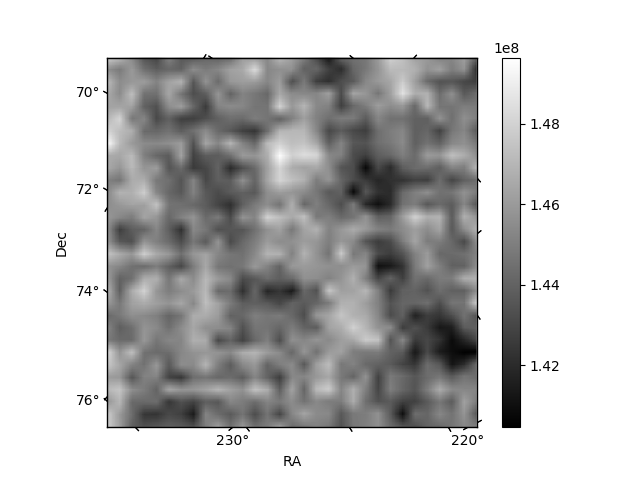
Quadrant B |
|---|---|---|---|
| Quadrant D | 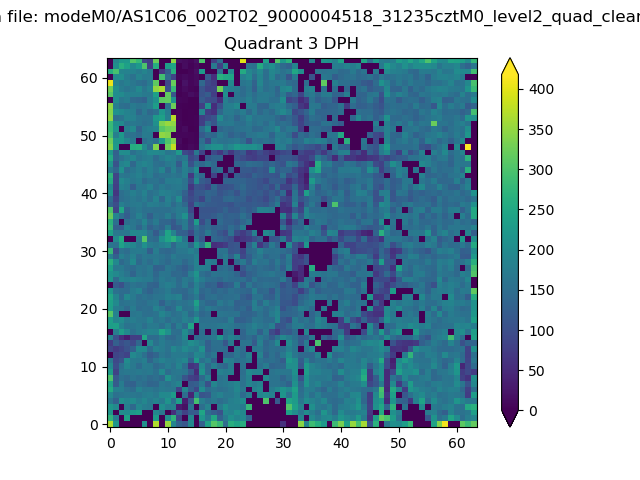 |
 |
Quadrant C |
| Plot type | Count rate plots | Images |
|---|---|---|
| Comparison with Poisson distribution Blue bars denote a histogram of data divided into 1 sec bins. Red curve is a Poisson curve with rate = median count rate of data. |
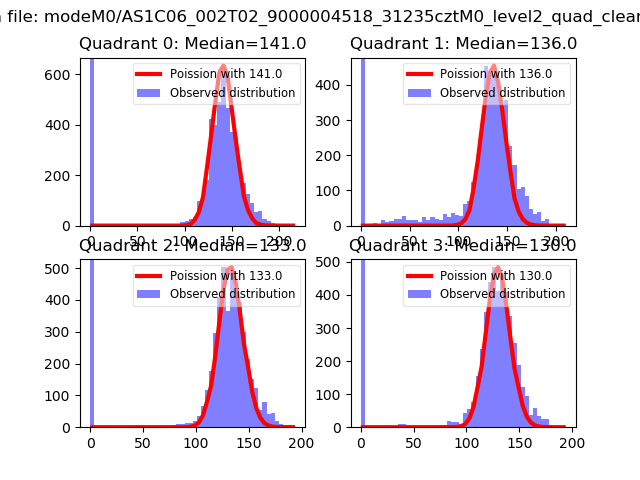 |
 |
| Quadrant-wise count rates Data is divided into 100 sec bins |
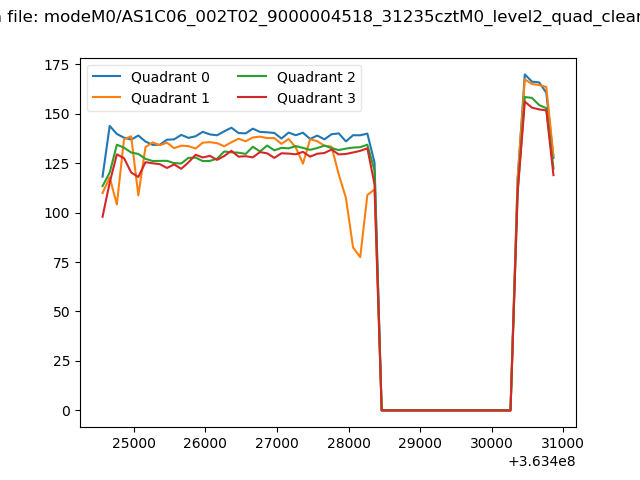 |
|
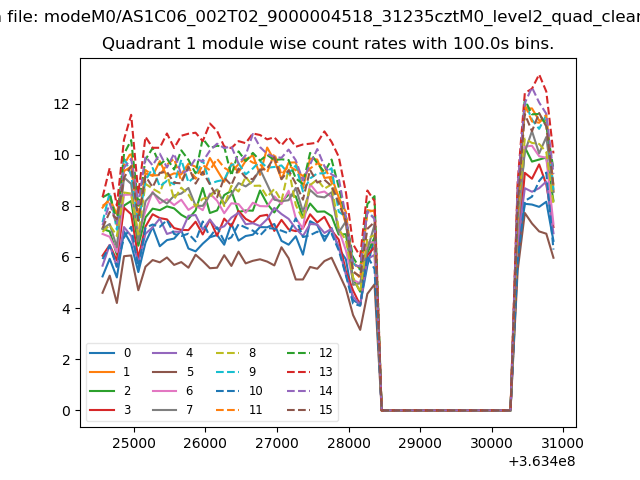
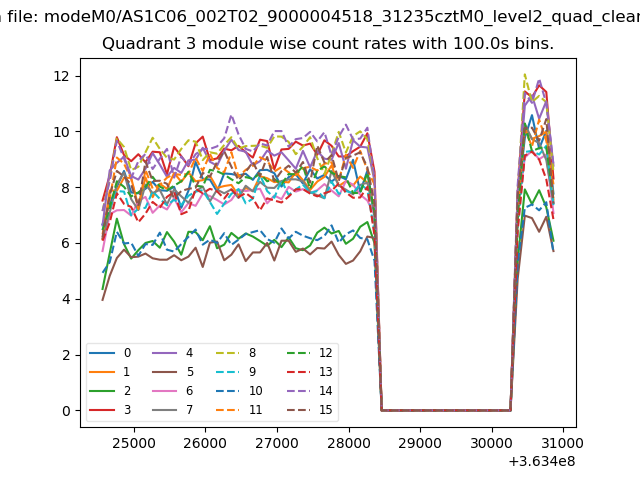
| Module-wise count rates for Quadrant A Data is divided into 100 sec bins |
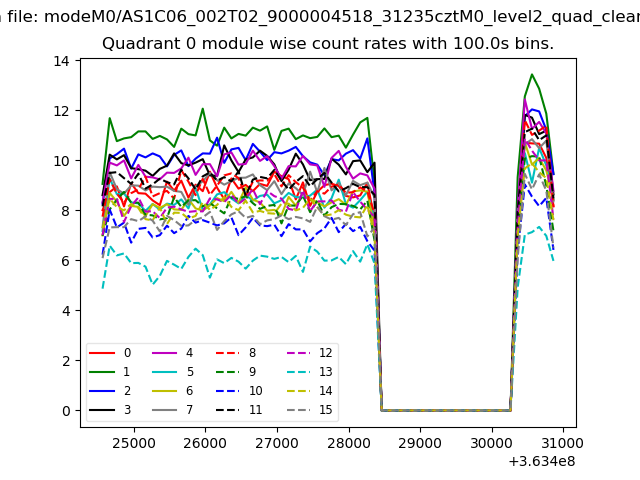 |
 |
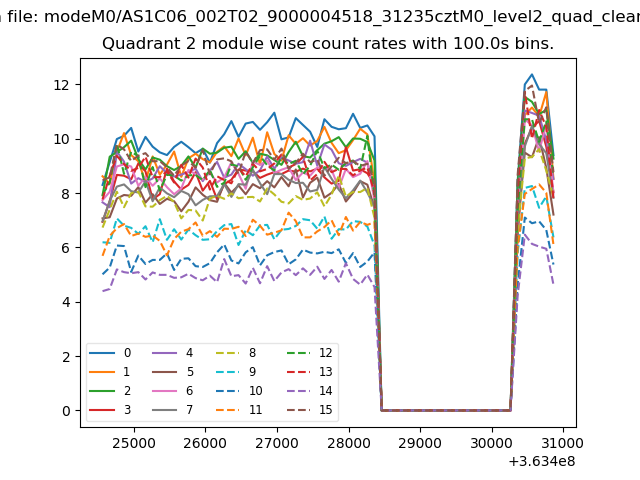
| Module-wise count rates for Quadrant B Data is divided into 100 sec bins |
 |
 |
| Module-wise count rates for Quadrant C Data is divided into 100 sec bins |
 |
 |
| Module-wise count rates for Quadrant D Data is divided into 100 sec bins |
 |
 |
| Parameter | Plot |
|---|---|
| CZT HV Monitor | 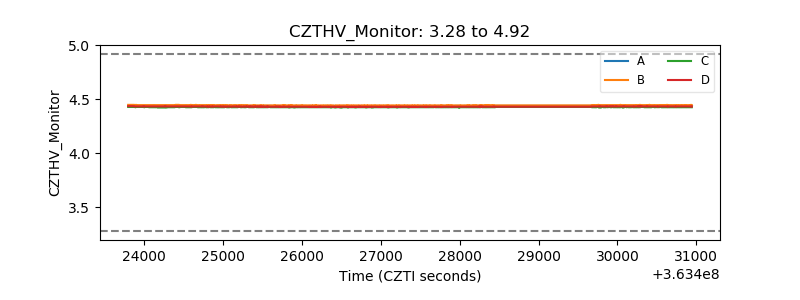 |
| D_VDD | 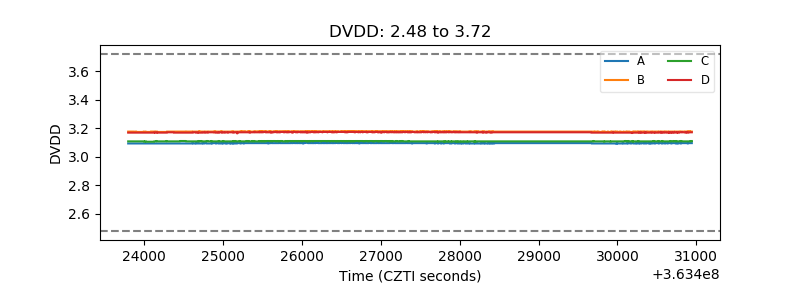 |
| Temperature 1 | 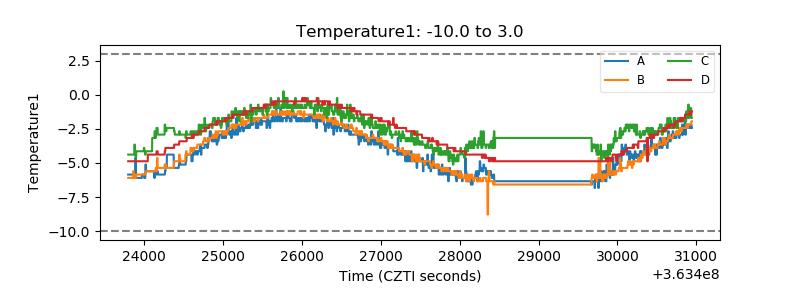 |
| Veto HV Monitor | 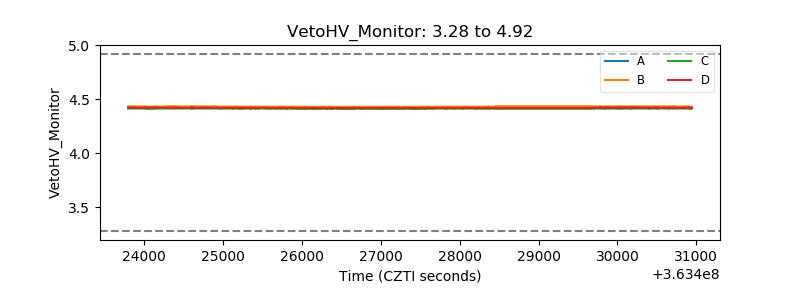 |
| Veto LLD | 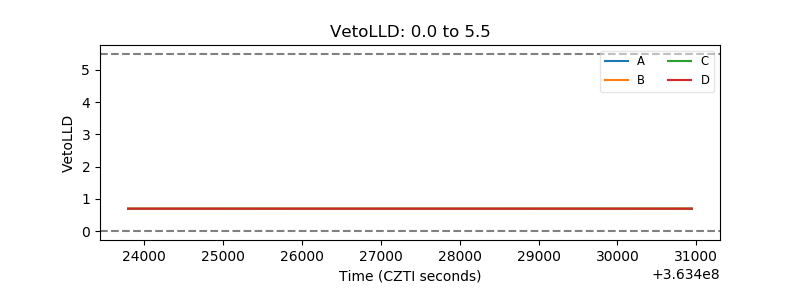 |
| Alpha Counter | 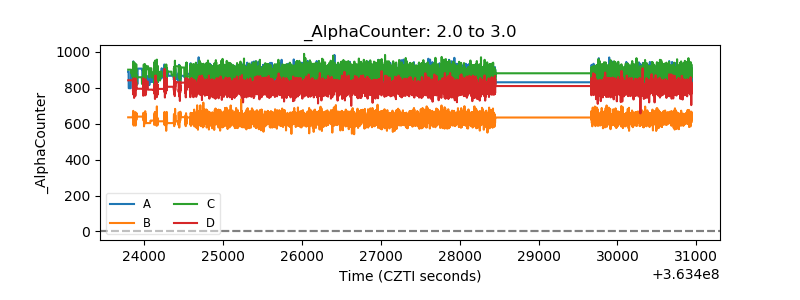 |
| _CPM_Rate | 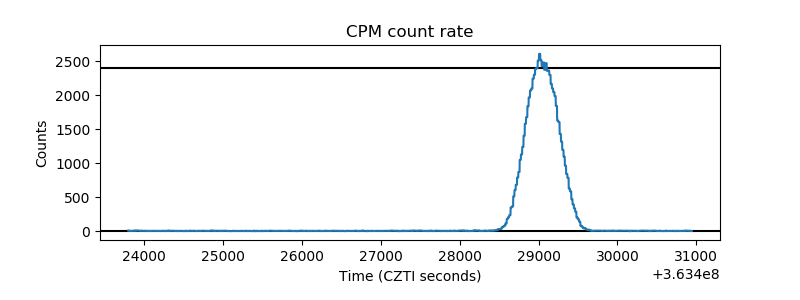 |
| CZT Counter | 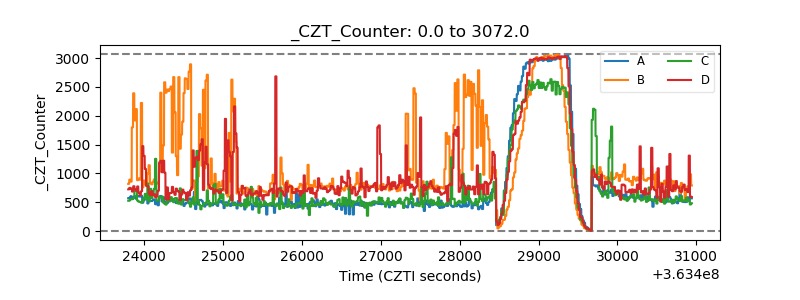 |
| +2.5 Volts monitor |  |
| +5 Volts monitor |  |
| _ROLL_ROT | 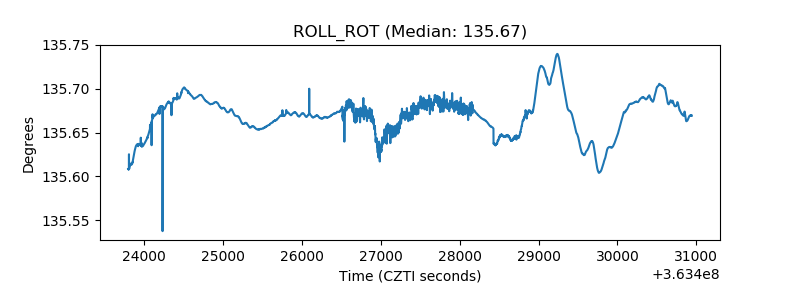 |
| _Roll_DEC | 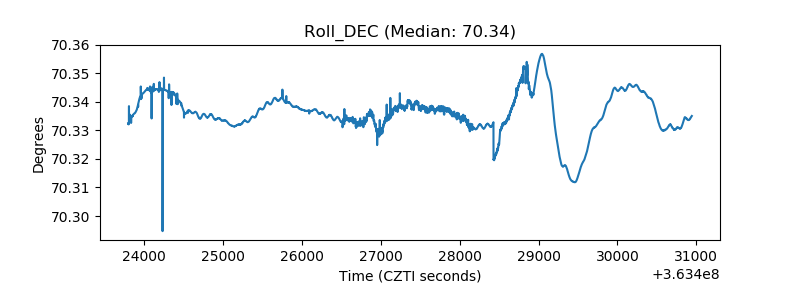 |
| _Roll_RA | 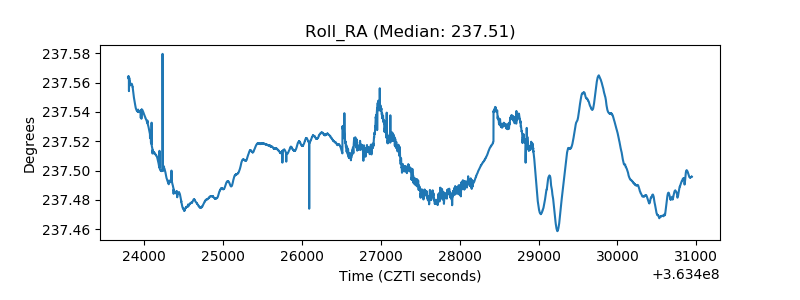 |
| Veto Counter | 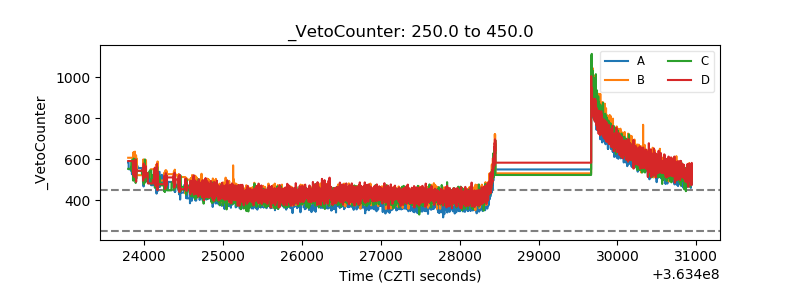 |