| Param | Original file | Final file |
|---|---|---|
| Filename | modeM0/AS1C06_002T02_9000004518_31236cztM0_level2.evt | modeM0/AS1C06_002T02_9000004518_31236cztM0_level2_quad_clean.evt |
| Size (bytes) | 659,566,080 | 114,773,760 |
| Size | 629.0 MB | 109.5 MB |
| Events in quadrant A | 3,325,723 | 808,581 |
| Events in quadrant B | 6,501,669 | 757,810 |
| Events in quadrant C | 3,530,136 | 752,919 |
| Events in quadrant D | 6,207,163 | 731,826 |
| Mode SS | |||
|---|---|---|---|
| Quadrant | BADHDUFLAG | Total packets | Discarded packets |
| A | 0 | 122 | 0 |
| B | 0 | 122 | 0 |
| C | 0 | 122 | 0 |
| D | 0 | 122 | 0 |
| Mode M9 | |||
|---|---|---|---|
| Quadrant | BADHDUFLAG | Total packets | Discarded packets |
| A | 0 | 13 | 0 |
| B | 0 | 13 | 0 |
| C | 0 | 13 | 0 |
| D | 0 | 13 | 0 |
| Mode M0 | |||
|---|---|---|---|
| Quadrant | BADHDUFLAG | Total packets | Discarded packets |
| A | 0 | 13694 | 1 |
| B | 0 | 23356 | 1 |
| C | 0 | 14161 | 1 |
| D | 0 | 23105 | 1 |
| Quadrant | Total seconds | Saturated seconds | Saturation percentage |
|---|---|---|---|
| A | 6089 | 87 | 1.428806% |
| B | 6089 | 815 | 13.384792% |
| C | 6089 | 198 | 3.251765% |
| D | 6089 | 300 | 4.926917% |
Noise dominated data is calculated using 1-second bins in cleaned event files. If a bin has >2000 counts, and if more than 50% of those come from <1% of pixels, then it is considered to be noise-dominated and hence unusable.
| Quadrant | # 1 sec bins | Bins with >0 counts | Bins with >2000 counts | High rate bins dominated by noise | Noise dominated (total time) | Noise dominated (detector-on time) | Marked lightcurve |
|---|---|---|---|---|---|---|---|
| A | 7339 | 6090 | 2 | 2 | 0.03% | 0.03% | 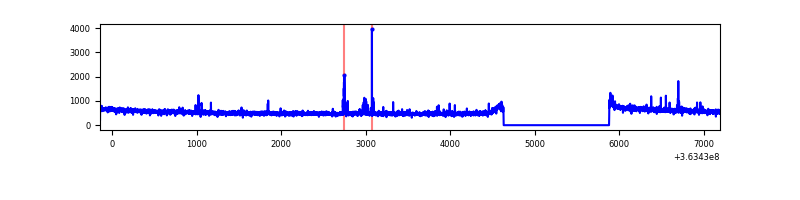 |
| B | 7339 | 6090 | 450 | 450 | 6.13% | 7.39% | 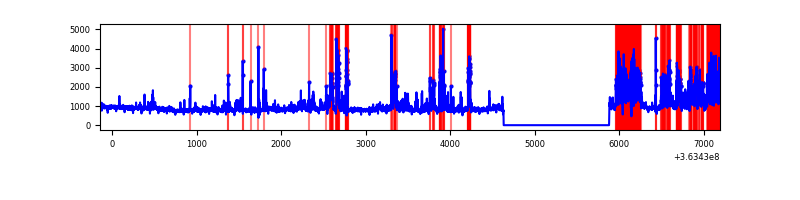 |
| C | 7339 | 6090 | 38 | 38 | 0.52% | 0.62% |  |
| D | 7339 | 6090 | 206 | 206 | 2.81% | 3.38% |  |
Top three noisy pixels from each quadrant. If the there are fewer than three noisy pixels in the level2.evt file, extra rows are filled as -1
| Pixel properties | Quadrant properties | ||||||
|---|---|---|---|---|---|---|---|
| Quadrant | DetID | PixID | Counts | Sigma | Mean | Median | Sigma |
| A | 12 | 96 | 64042 | 381.25 | 845 | 830 | 165.8 |
| A | 13 | 254 | 11410 | 63.81 | 845 | 830 | 165.8 |
| A | 0 | 226 | 7542 | 40.48 | 845 | 830 | 165.8 |
| B | 6 | 159 | 1611470 | 11151.42 | 784 | 768 | 144.4 |
| B | 14 | 167 | 1493187 | 10332.51 | 784 | 768 | 144.4 |
| B | 10 | 245 | 78400 | 537.47 | 784 | 768 | 144.4 |
| C | 0 | 10 | 216063 | 1200.34 | 780 | 785 | 179.3 |
| C | 14 | 238 | 130176 | 721.45 | 780 | 785 | 179.3 |
| C | 3 | 233 | 58459 | 321.58 | 780 | 785 | 179.3 |
| D | 8 | 195 | 2714466 | 13001.1 | 795 | 784 | 208.7 |
| D | 7 | 64 | 179299 | 855.26 | 795 | 784 | 208.7 |
| D | 10 | 253 | 176320 | 840.98 | 795 | 784 | 208.7 |
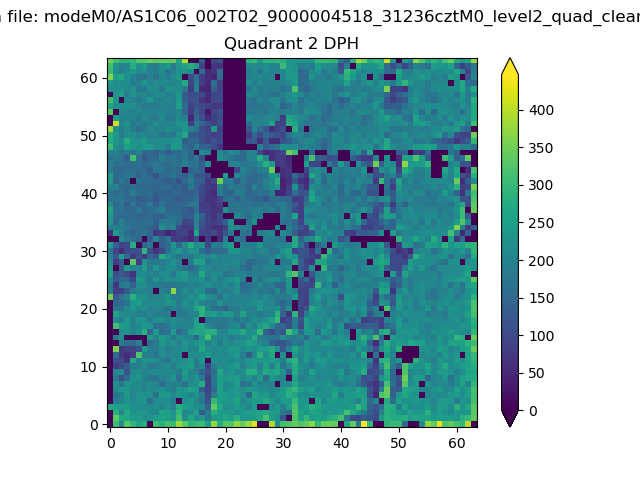
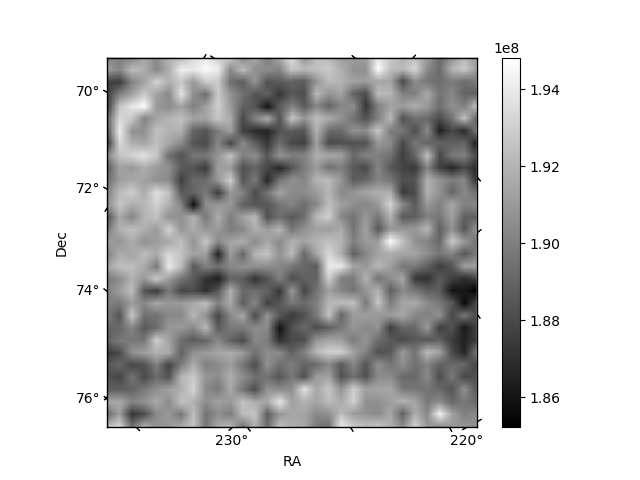
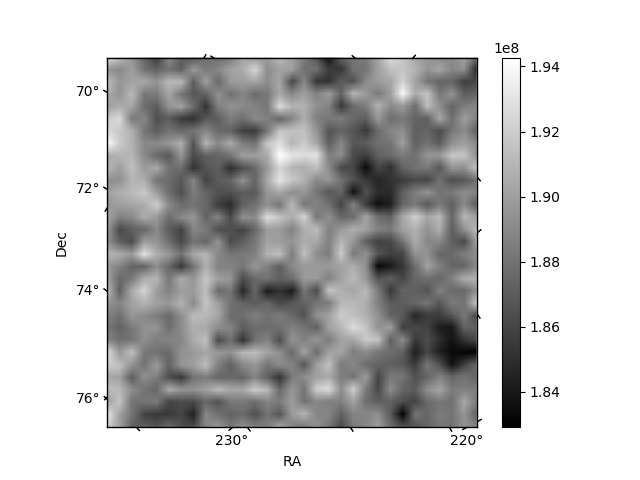
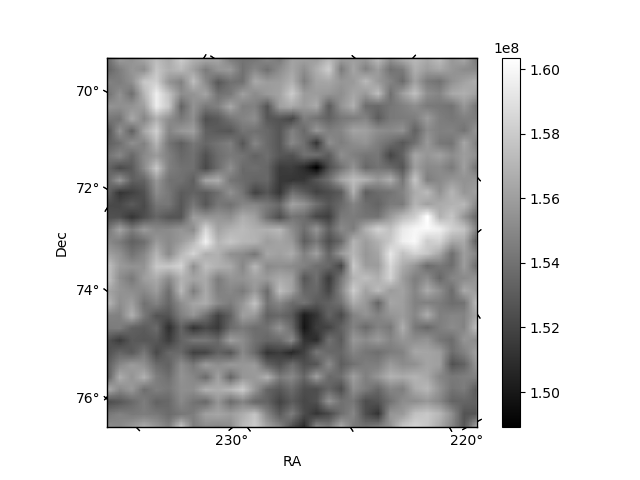
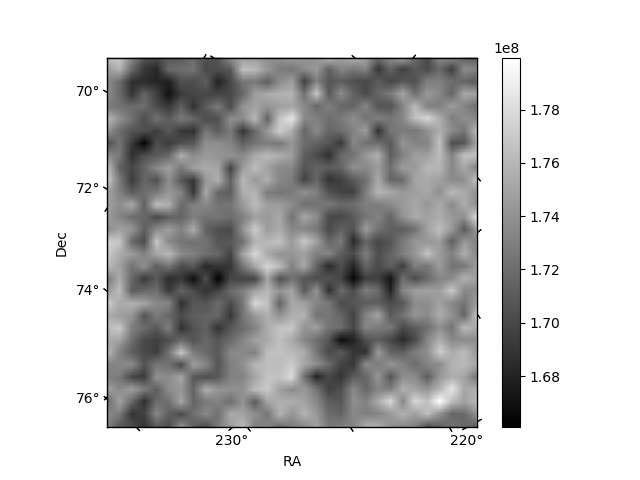
Histogram calculated using DETX and DETY for each event in the final _common_clean file
| Quadrant A | 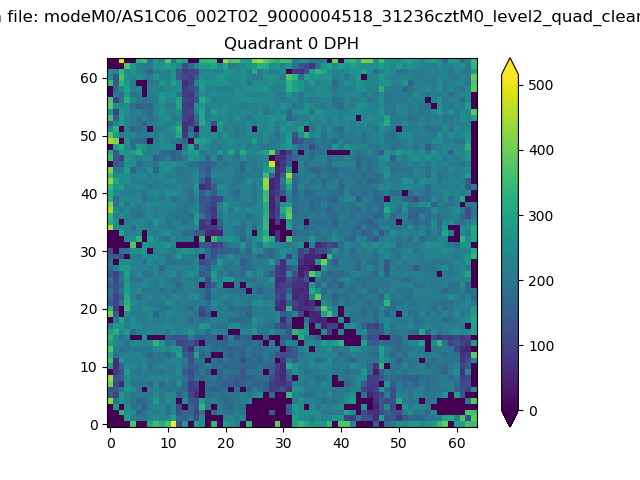 |
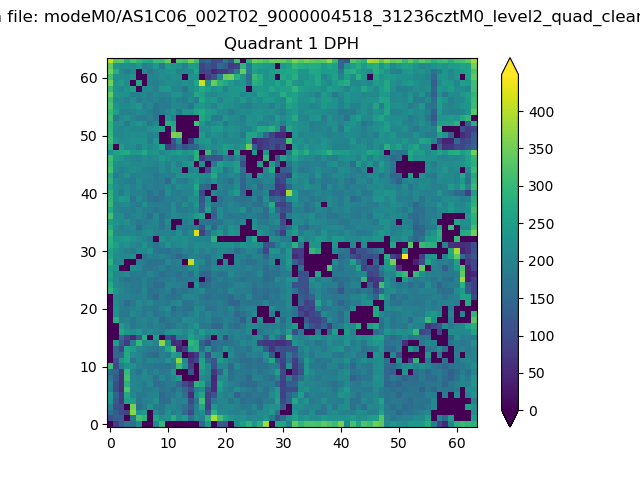 |
Quadrant B |
|---|---|---|---|
| Quadrant D | 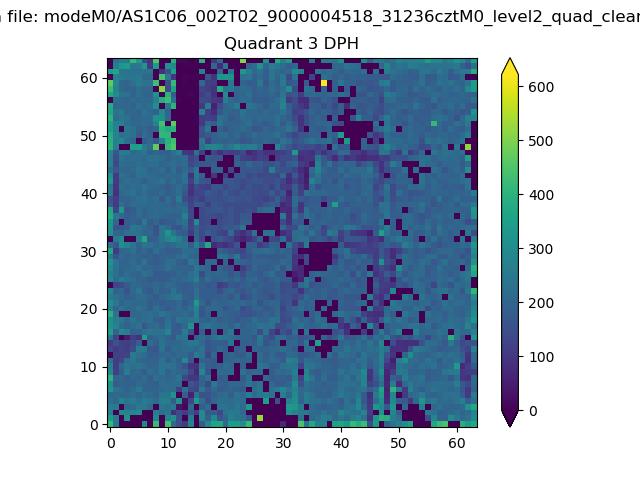 |
 |
Quadrant C |
| Plot type | Count rate plots | Images |
|---|---|---|
| Comparison with Poisson distribution Blue bars denote a histogram of data divided into 1 sec bins. Red curve is a Poisson curve with rate = median count rate of data. |
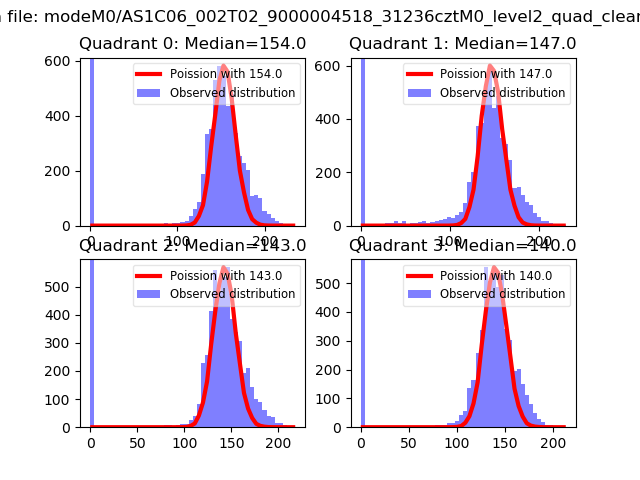 |
 |
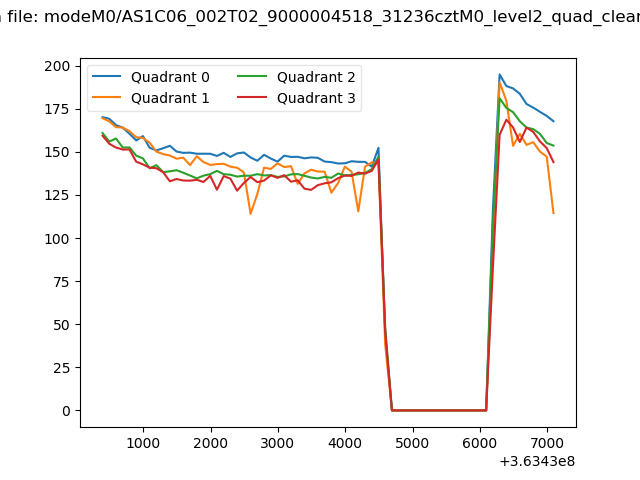
| Quadrant-wise count rates Data is divided into 100 sec bins |
 |
|
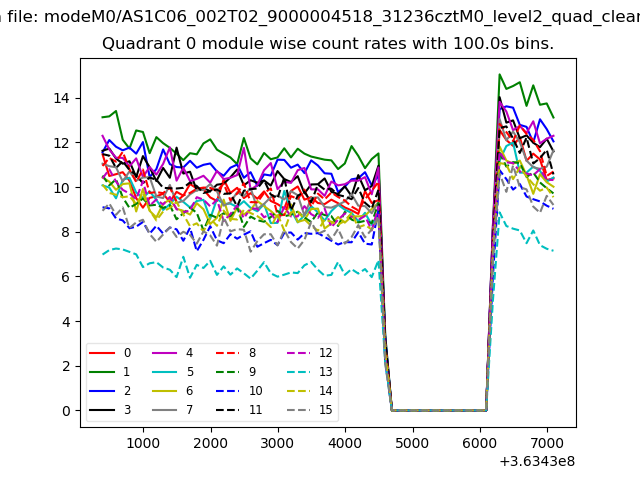
| Module-wise count rates for Quadrant A Data is divided into 100 sec bins |
 |
 |
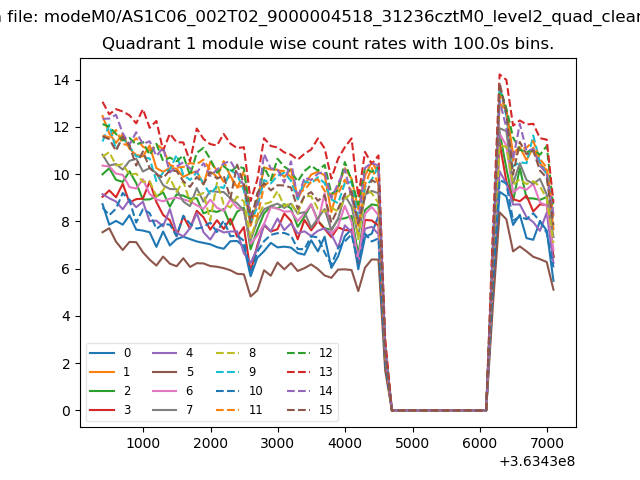
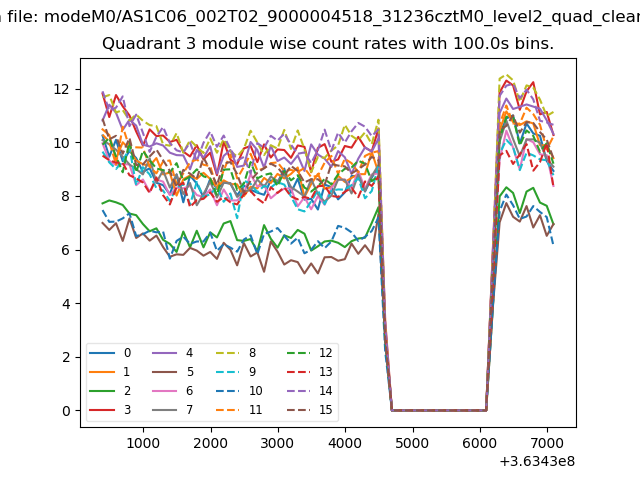
| Module-wise count rates for Quadrant B Data is divided into 100 sec bins |
 |
 |
| Module-wise count rates for Quadrant C Data is divided into 100 sec bins |
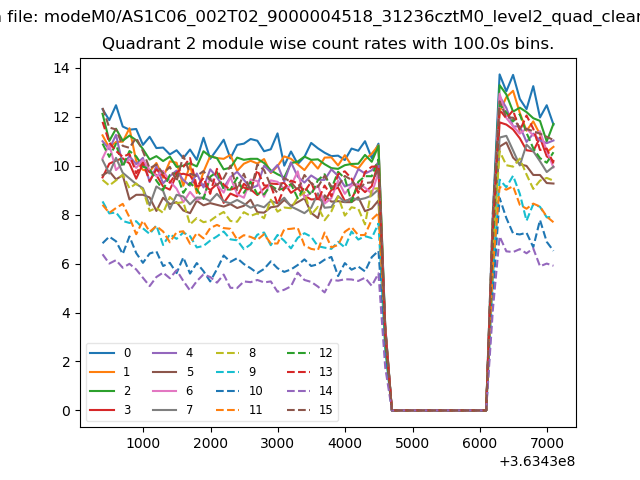 |
 |
| Module-wise count rates for Quadrant D Data is divided into 100 sec bins |
 |
 |
| Parameter | Plot |
|---|---|
| CZT HV Monitor | 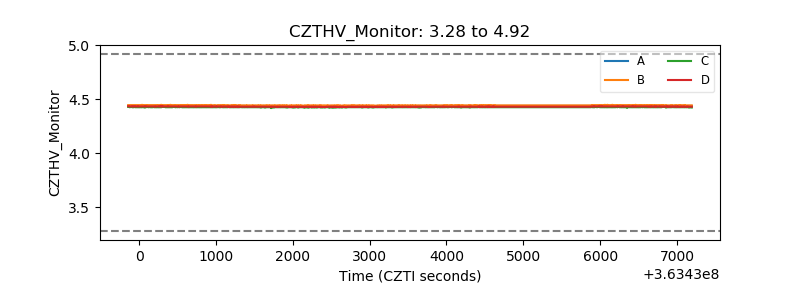 |
| D_VDD | 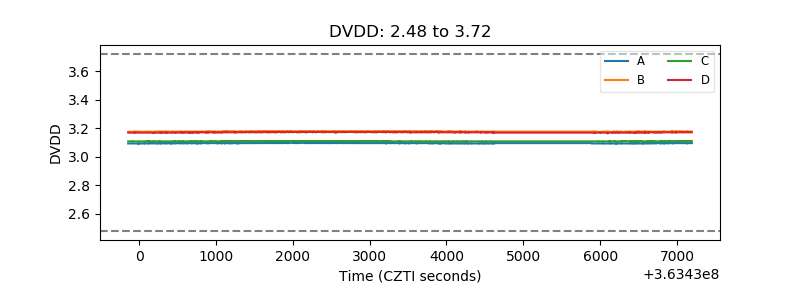 |
| Temperature 1 |  |
| Veto HV Monitor | 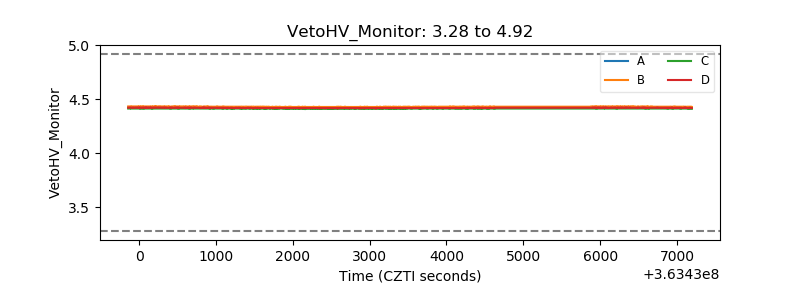 |
| Veto LLD | 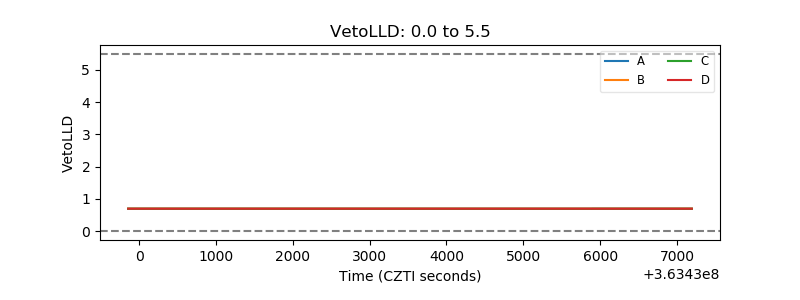 |
| Alpha Counter | 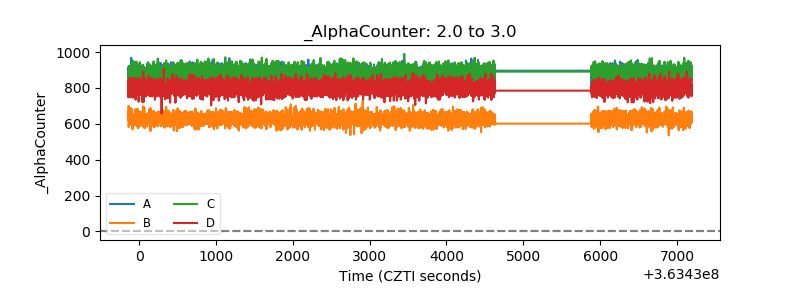 |
| _CPM_Rate | 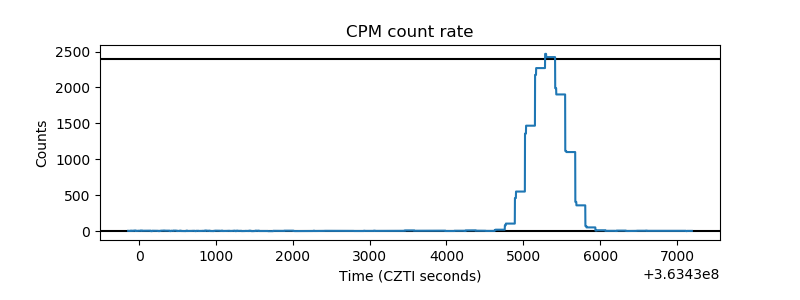 |
| CZT Counter | 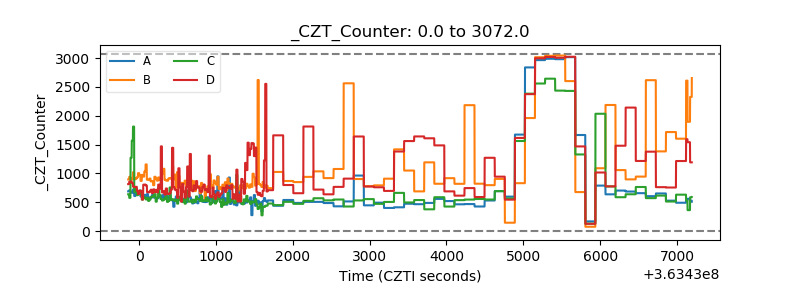 |
| +2.5 Volts monitor |  |
| +5 Volts monitor |  |
| _ROLL_ROT | 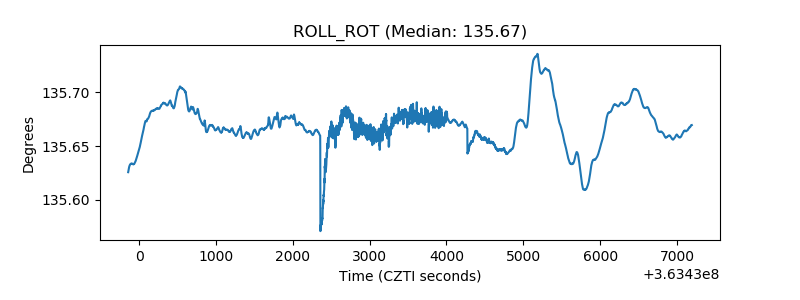 |
| _Roll_DEC | 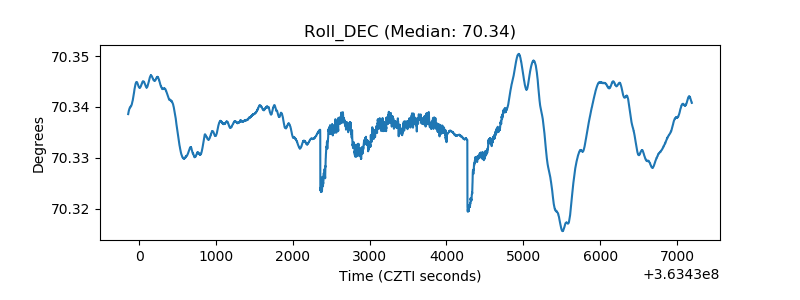 |
| _Roll_RA | 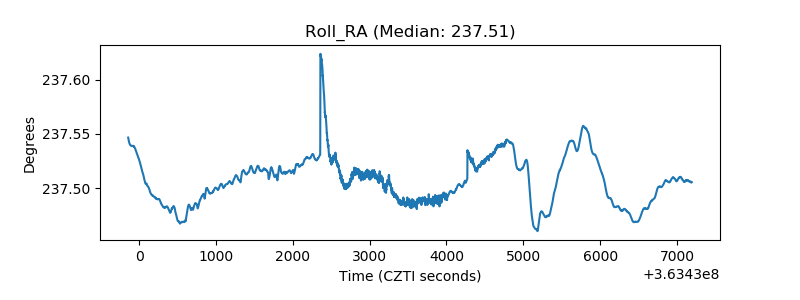 |
| Veto Counter | 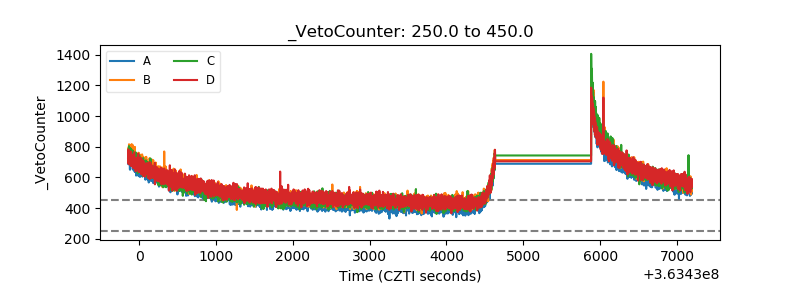 |