| Param | Original file | Final file |
|---|---|---|
| Filename | modeM0/AS1C06_002T02_9000004518_31238cztM0_level2.evt | modeM0/AS1C06_002T02_9000004518_31238cztM0_level2_quad_clean.evt |
| Size (bytes) | 354,899,520 | 55,923,840 |
| Size | 338.5 MB | 53.3 MB |
| Events in quadrant A | 1,382,199 | 429,547 |
| Events in quadrant B | 5,025,561 | 280,828 |
| Events in quadrant C | 1,519,403 | 402,032 |
| Events in quadrant D | 2,637,060 | 387,255 |
| Mode SS | |||
|---|---|---|---|
| Quadrant | BADHDUFLAG | Total packets | Discarded packets |
| A | 0 | 54 | 0 |
| B | 0 | 54 | 0 |
| C | 0 | 54 | 0 |
| D | 0 | 54 | 0 |
| Mode M0 | |||
|---|---|---|---|
| Quadrant | BADHDUFLAG | Total packets | Discarded packets |
| A | 0 | 5705 | 0 |
| B | 0 | 16728 | 0 |
| C | 0 | 6180 | 0 |
| D | 0 | 9706 | 0 |
| Quadrant | Total seconds | Saturated seconds | Saturation percentage |
|---|---|---|---|
| A | 2698 | 0 | 0.000000% |
| B | 2699 | 1415 | 52.426825% |
| C | 2699 | 22 | 0.815117% |
| D | 2699 | 90 | 3.334568% |
Noise dominated data is calculated using 1-second bins in cleaned event files. If a bin has >2000 counts, and if more than 50% of those come from <1% of pixels, then it is considered to be noise-dominated and hence unusable.
| Quadrant | # 1 sec bins | Bins with >0 counts | Bins with >2000 counts | High rate bins dominated by noise | Noise dominated (total time) | Noise dominated (detector-on time) | Marked lightcurve |
|---|---|---|---|---|---|---|---|
| A | 2698 | 2698 | 1 | 1 | 0.04% | 0.04% | 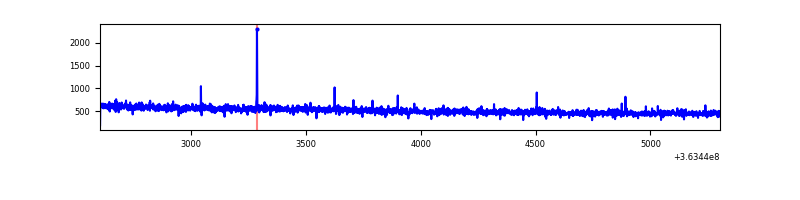 |
| B | 2699 | 2699 | 1203 | 1203 | 44.57% | 44.57% | 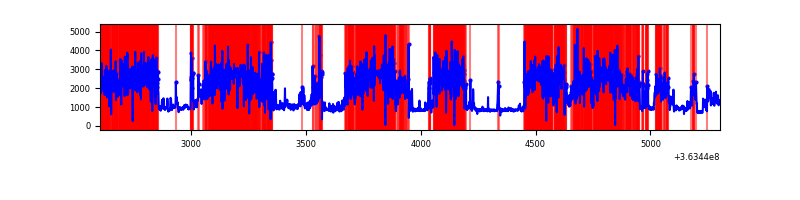 |
| C | 2699 | 2699 | 2 | 2 | 0.07% | 0.07% | 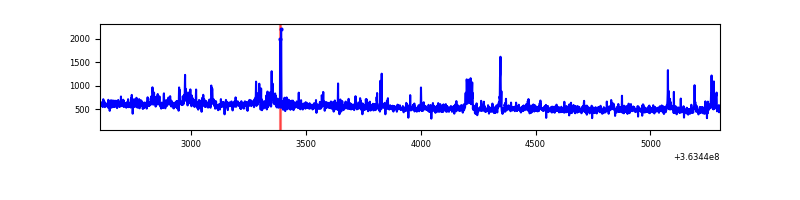 |
| D | 2699 | 2699 | 135 | 135 | 5.00% | 5.00% | 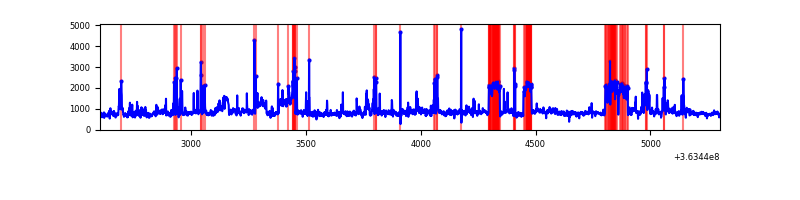 |
Top three noisy pixels from each quadrant. If the there are fewer than three noisy pixels in the level2.evt file, extra rows are filled as -1
| Pixel properties | Quadrant properties | ||||||
|---|---|---|---|---|---|---|---|
| Quadrant | DetID | PixID | Counts | Sigma | Mean | Median | Sigma |
| A | 0 | 207 | 5966 | 78.77 | 355 | 350 | 71.3 |
| A | 13 | 254 | 5214 | 68.22 | 355 | 350 | 71.3 |
| A | 5 | 16 | 4043 | 51.79 | 355 | 350 | 71.3 |
| B | 14 | 167 | 3175656 | 67425.48 | 250 | 244 | 47.1 |
| B | 6 | 159 | 622974 | 13222.81 | 250 | 244 | 47.1 |
| B | 10 | 245 | 143527 | 3042.42 | 250 | 244 | 47.1 |
| C | 0 | 10 | 81139 | 1027.87 | 337 | 339 | 78.6 |
| C | 14 | 238 | 56539 | 714.93 | 337 | 339 | 78.6 |
| C | 3 | 233 | 21006 | 262.91 | 337 | 339 | 78.6 |
| D | 8 | 195 | 1038120 | 12816.54 | 342 | 334 | 81.0 |
| D | 13 | 249 | 119857 | 1476.1 | 342 | 334 | 81.0 |
| D | 2 | 250 | 48731 | 597.7 | 342 | 334 | 81.0 |
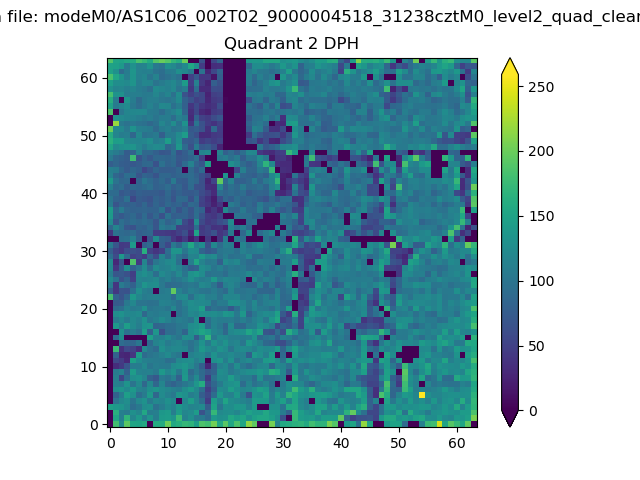
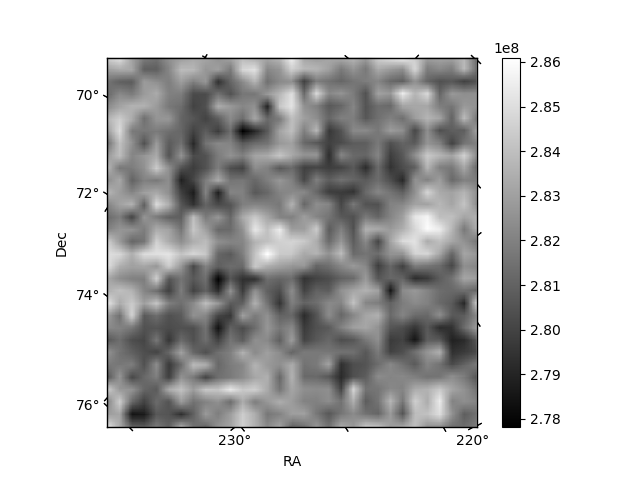
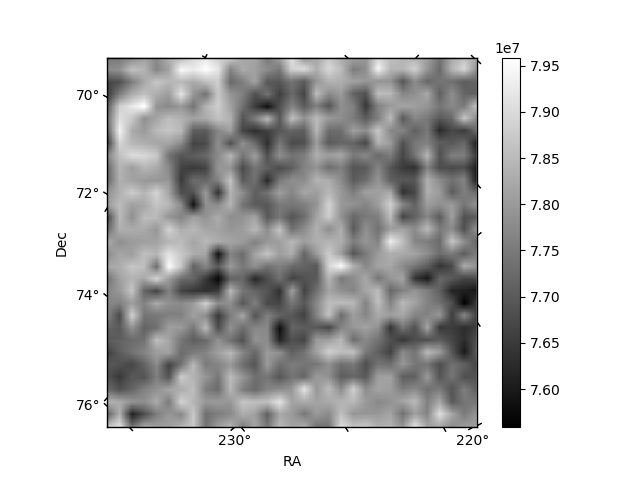
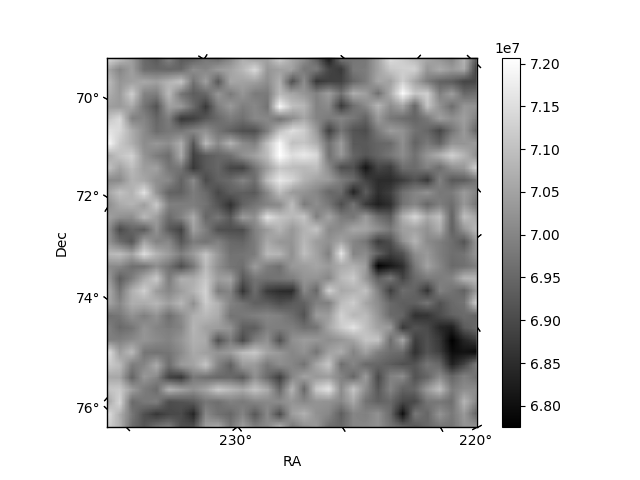
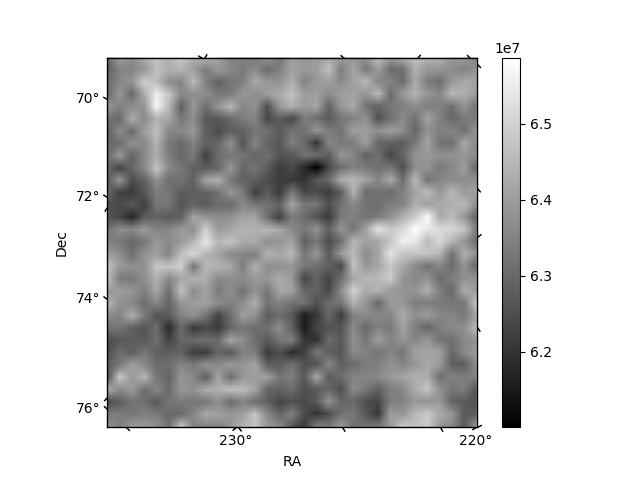
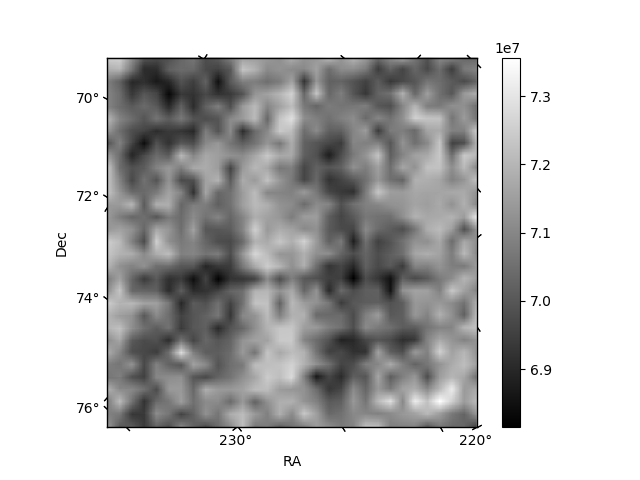
Histogram calculated using DETX and DETY for each event in the final _common_clean file
| Quadrant A | 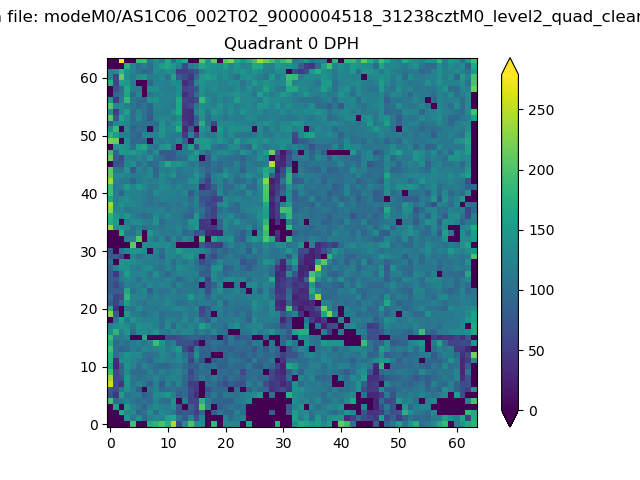 |
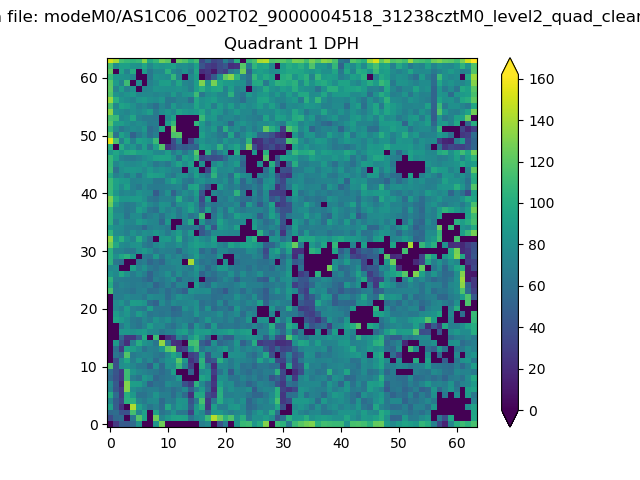 |
Quadrant B |
|---|---|---|---|
| Quadrant D | 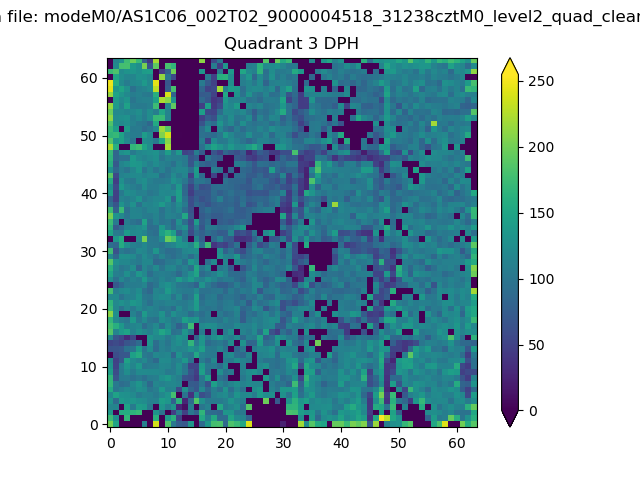 |
 |
Quadrant C |
| Plot type | Count rate plots | Images |
|---|---|---|
| Comparison with Poisson distribution Blue bars denote a histogram of data divided into 1 sec bins. Red curve is a Poisson curve with rate = median count rate of data. |
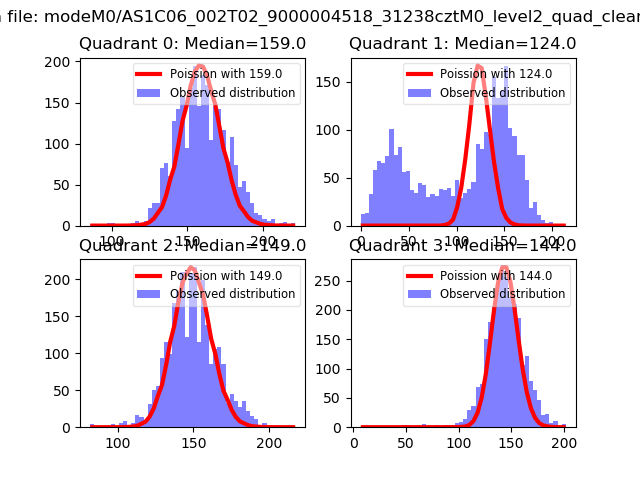 |
 |
| Quadrant-wise count rates Data is divided into 100 sec bins |
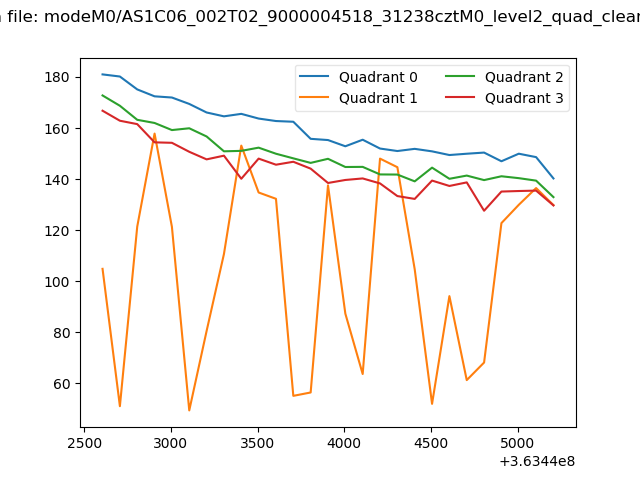 |
|
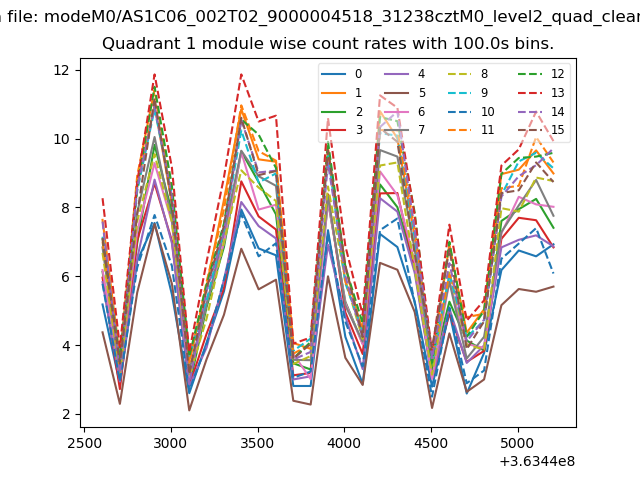
| Module-wise count rates for Quadrant A Data is divided into 100 sec bins |
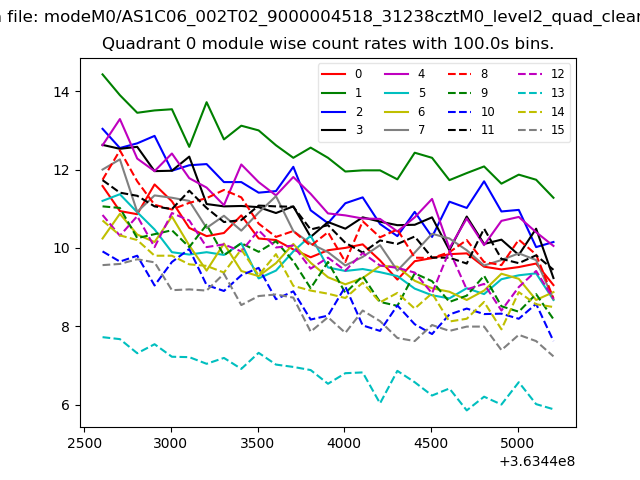 |
 |
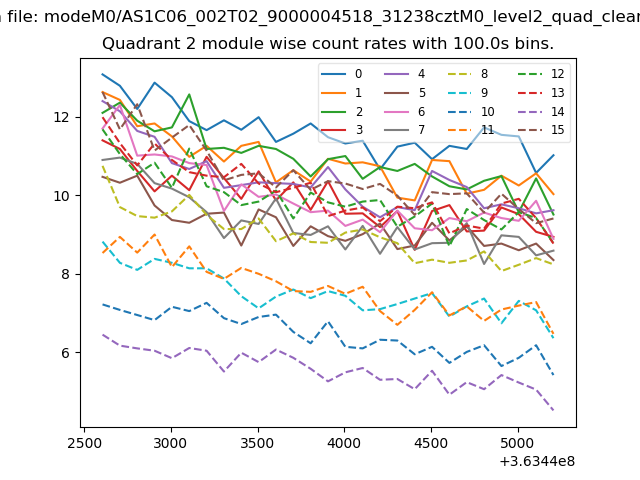
| Module-wise count rates for Quadrant B Data is divided into 100 sec bins |
 |
 |
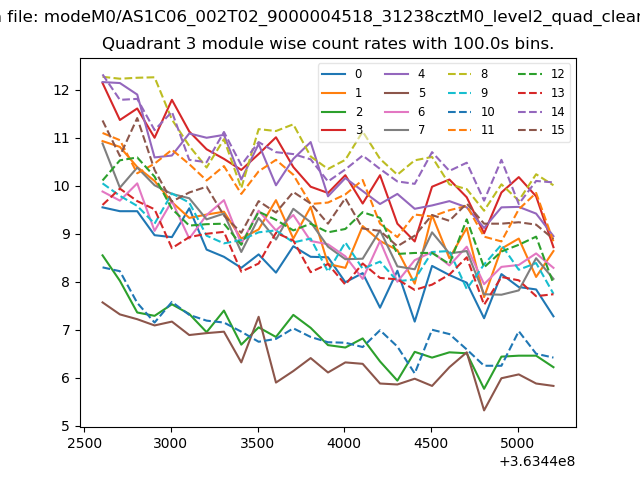
| Module-wise count rates for Quadrant C Data is divided into 100 sec bins |
 |
 |
| Module-wise count rates for Quadrant D Data is divided into 100 sec bins |
 |
 |
| Parameter | Plot |
|---|---|
| CZT HV Monitor | 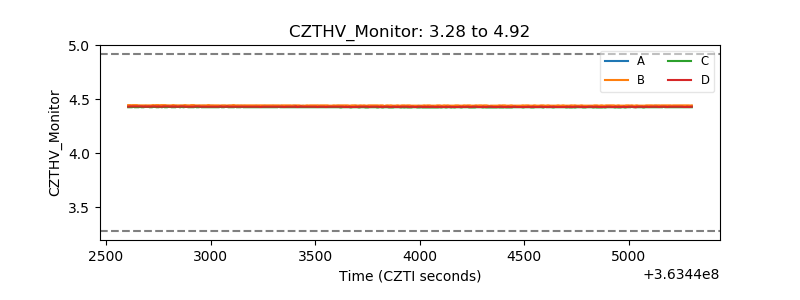 |
| D_VDD | 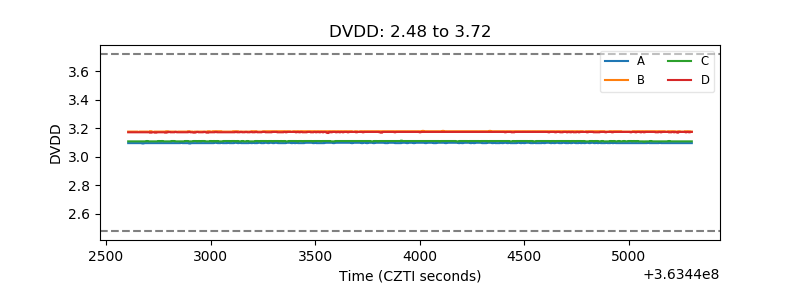 |
| Temperature 1 | 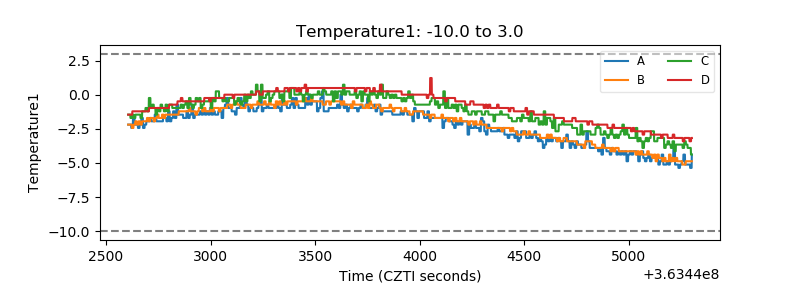 |
| Veto HV Monitor | 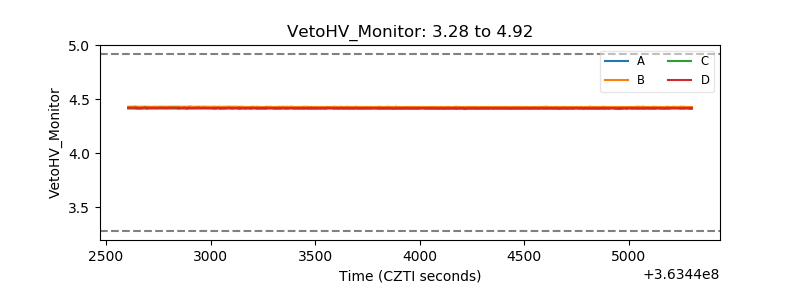 |
| Veto LLD | 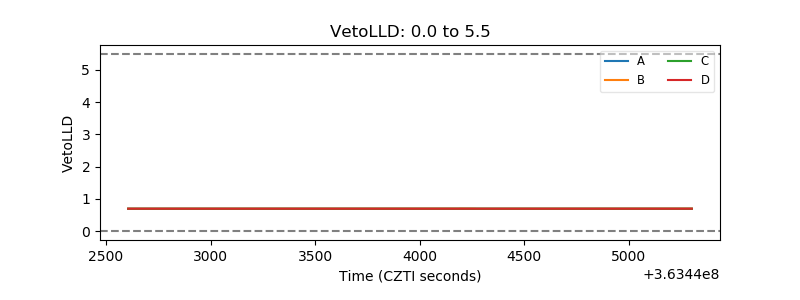 |
| Alpha Counter | 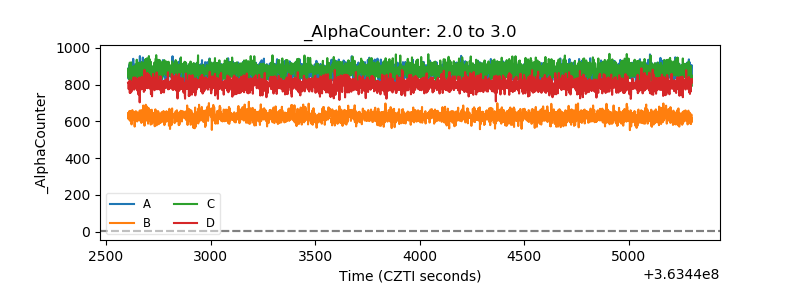 |
| _CPM_Rate | 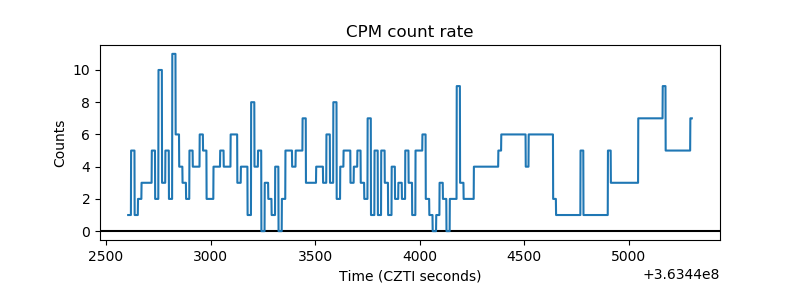 |
| CZT Counter | 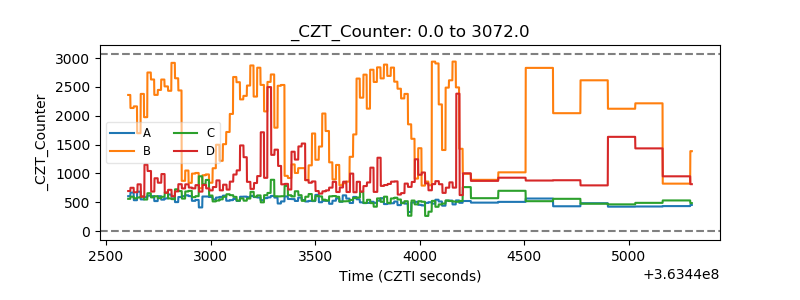 |
| +2.5 Volts monitor |  |
| +5 Volts monitor | 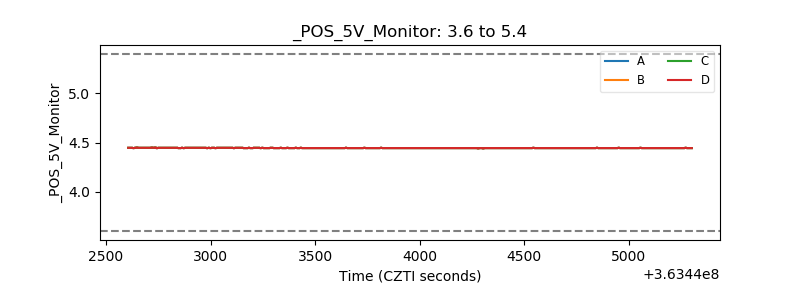 |
| _ROLL_ROT | 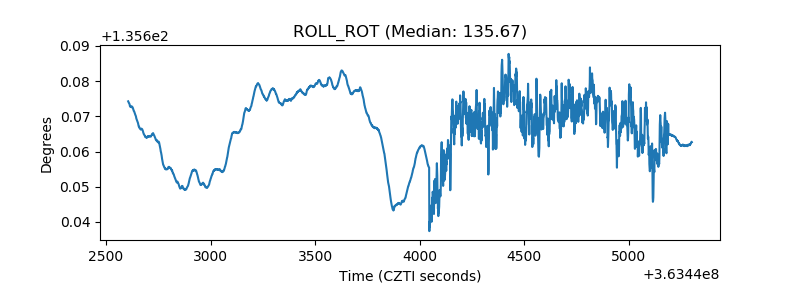 |
| _Roll_DEC | 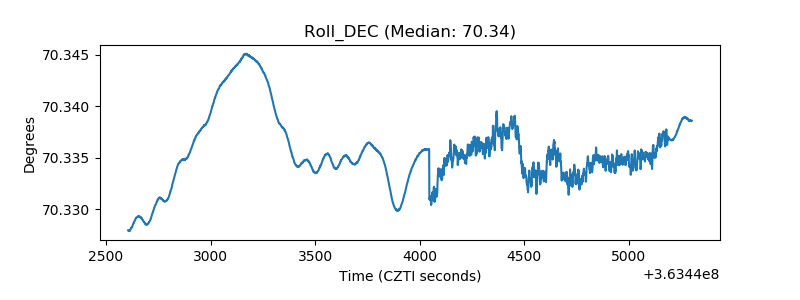 |
| _Roll_RA | 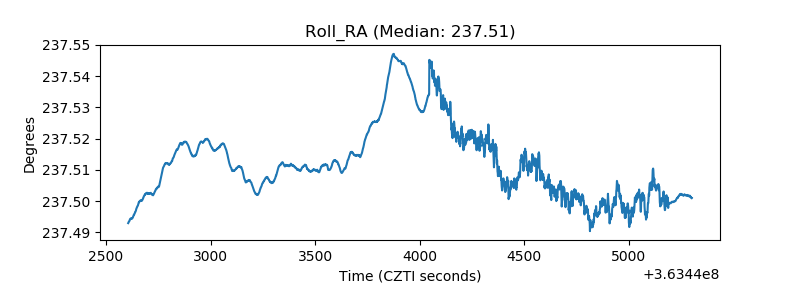 |
| Veto Counter | 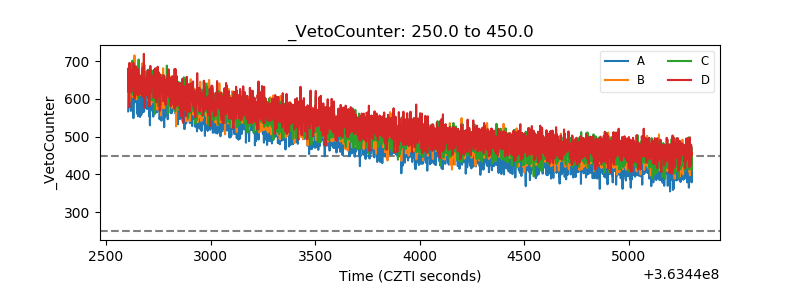 |