| Param | Original file | Final file |
|---|---|---|
| Filename | modeM0/AS1C06_002T02_9000004518_31412cztM0_level2.evt | modeM0/AS1C06_002T02_9000004518_31412cztM0_level2_quad_clean.evt |
| Size (bytes) | 169,842,240 | 38,419,200 |
| Size | 162.0 MB | 36.6 MB |
| Events in quadrant A | 1,054,314 | 265,411 |
| Events in quadrant B | 1,520,670 | 246,753 |
| Events in quadrant C | 1,181,080 | 254,924 |
| Events in quadrant D | 1,247,906 | 248,902 |
| Mode SS | |||
|---|---|---|---|
| Quadrant | BADHDUFLAG | Total packets | Discarded packets |
| A | 0 | 58 | 16 |
| B | 0 | 57 | 15 |
| C | 0 | 57 | 15 |
| D | 0 | 58 | 14 |
| Mode M9 | |||
|---|---|---|---|
| Quadrant | BADHDUFLAG | Total packets | Discarded packets |
| A | 0 | 13 | 0 |
| B | 0 | 13 | 0 |
| C | 0 | 13 | 0 |
| D | 0 | 13 | 0 |
| Mode M0 | |||
|---|---|---|---|
| Quadrant | BADHDUFLAG | Total packets | Discarded packets |
| A | 0 | 6059 | 1761 |
| B | 0 | 8712 | 2794 |
| C | 0 | 6892 | 2199 |
| D | 0 | 7116 | 2158 |
| Quadrant | Total seconds | Saturated seconds | Saturation percentage |
|---|---|---|---|
| A | 2061 | 27 | 1.310044% |
| B | 1954 | 54 | 2.763562% |
| C | 2029 | 92 | 4.534253% |
| D | 2018 | 35 | 1.734390% |
Noise dominated data is calculated using 1-second bins in cleaned event files. If a bin has >2000 counts, and if more than 50% of those come from <1% of pixels, then it is considered to be noise-dominated and hence unusable.
| Quadrant | # 1 sec bins | Bins with >0 counts | Bins with >2000 counts | High rate bins dominated by noise | Noise dominated (total time) | Noise dominated (detector-on time) | Marked lightcurve |
|---|---|---|---|---|---|---|---|
| A | 4314 | 2248 | 0 | 0 | 0.00% | 0.00% | 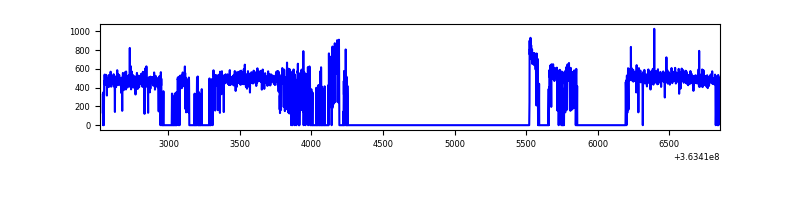 |
| B | 4303 | 2099 | 0 | 0 | 0.00% | 0.00% | 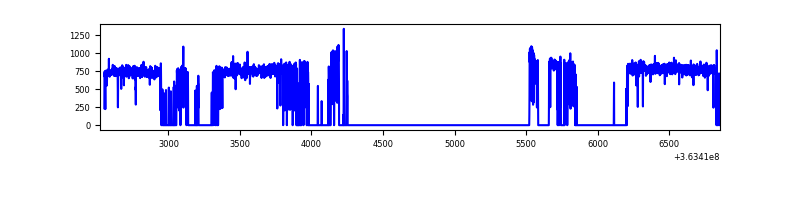 |
| C | 4332 | 2184 | 8 | 8 | 0.18% | 0.37% | 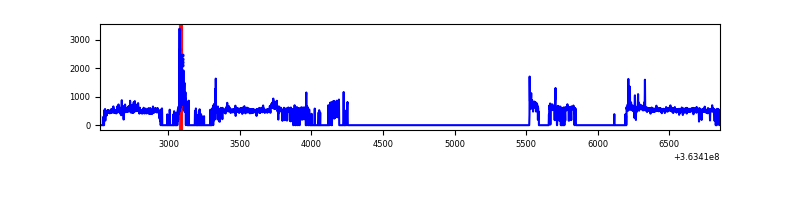 |
| D | 4309 | 2189 | 6 | 6 | 0.14% | 0.27% | 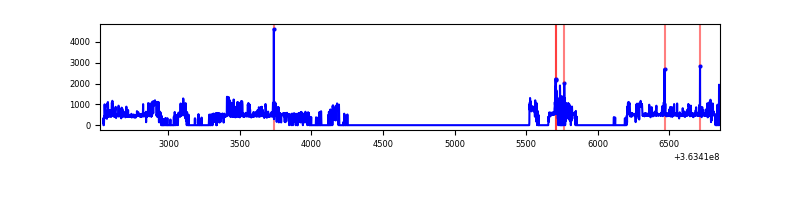 |
Top three noisy pixels from each quadrant. If the there are fewer than three noisy pixels in the level2.evt file, extra rows are filled as -1
| Pixel properties | Quadrant properties | ||||||
|---|---|---|---|---|---|---|---|
| Quadrant | DetID | PixID | Counts | Sigma | Mean | Median | Sigma |
| A | 13 | 254 | 3050 | 49.7 | 273 | 267 | 56.0 |
| A | 3 | 137 | 2648 | 42.52 | 273 | 267 | 56.0 |
| A | 0 | 226 | 2390 | 37.91 | 273 | 267 | 56.0 |
| B | 6 | 159 | 528401 | 10852.29 | 250 | 244 | 48.7 |
| B | 12 | 111 | 5634 | 110.75 | 250 | 244 | 48.7 |
| B | 11 | 111 | 5301 | 103.91 | 250 | 244 | 48.7 |
| C | 10 | 22 | 55355 | 898.75 | 258 | 260 | 61.3 |
| C | 3 | 233 | 50962 | 827.09 | 258 | 260 | 61.3 |
| C | 14 | 238 | 44288 | 718.21 | 258 | 260 | 61.3 |
| D | 8 | 195 | 193002 | 3078.59 | 260 | 252 | 62.6 |
| D | 12 | 218 | 49058 | 779.53 | 260 | 252 | 62.6 |
| D | 12 | 233 | 10945 | 170.79 | 260 | 252 | 62.6 |
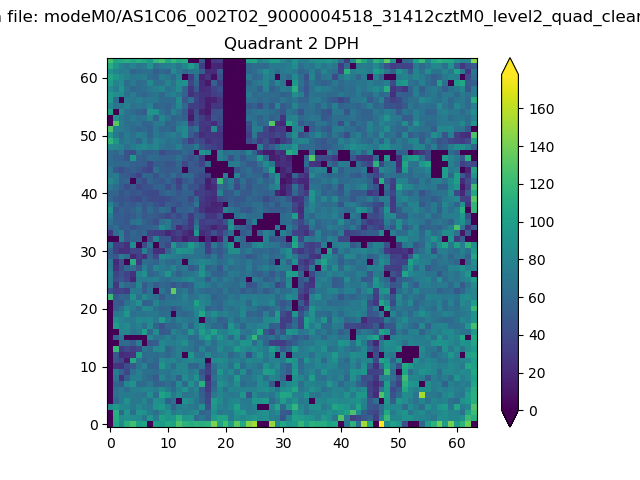
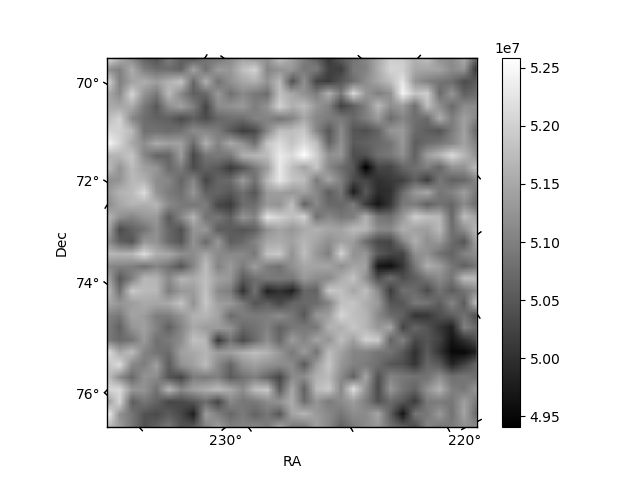
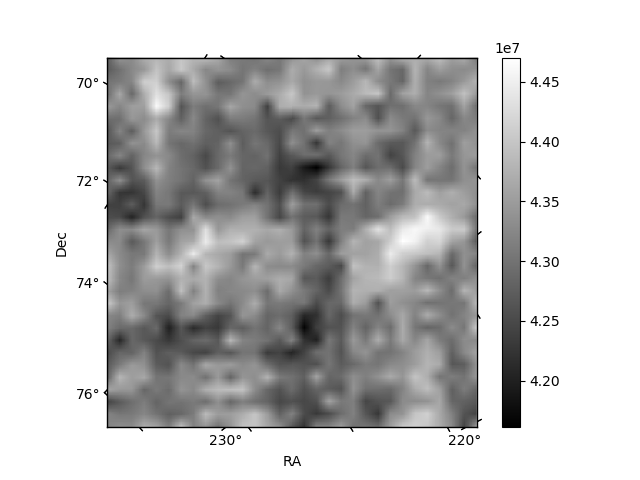
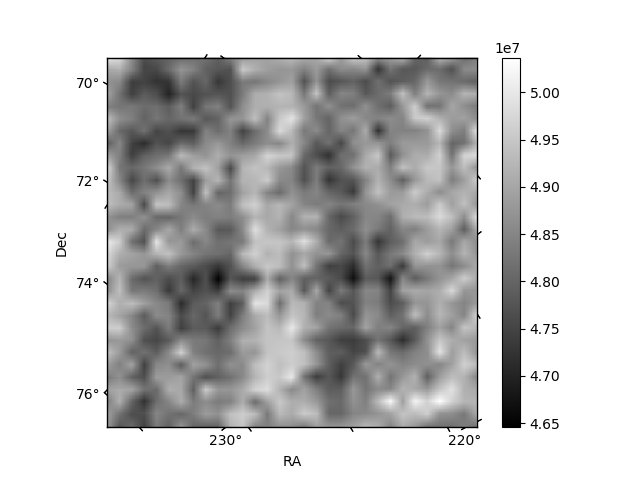
Histogram calculated using DETX and DETY for each event in the final _common_clean file
| Quadrant A | 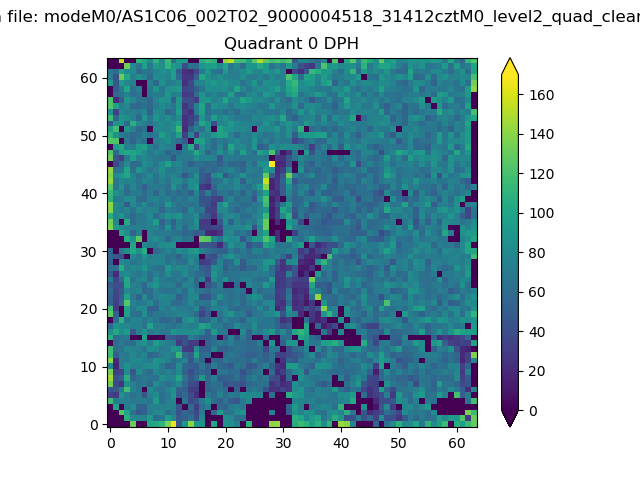 |
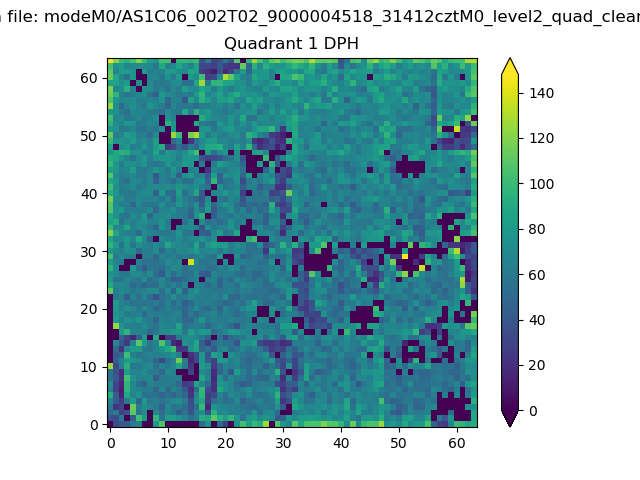 |
Quadrant B |
|---|---|---|---|
| Quadrant D | 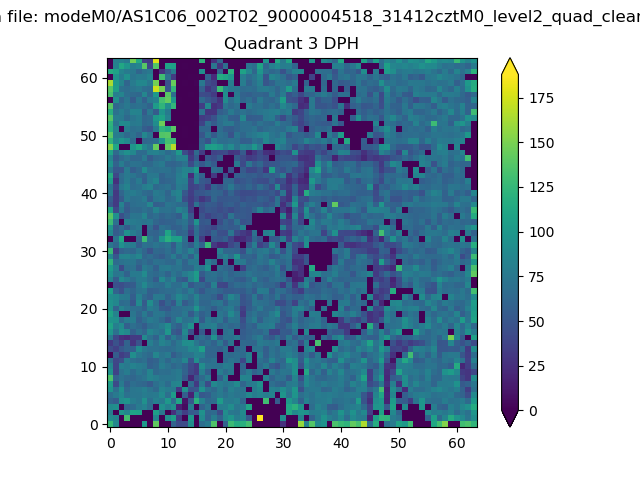 |
 |
Quadrant C |
| Plot type | Count rate plots | Images |
|---|---|---|
| Comparison with Poisson distribution Blue bars denote a histogram of data divided into 1 sec bins. Red curve is a Poisson curve with rate = median count rate of data. |
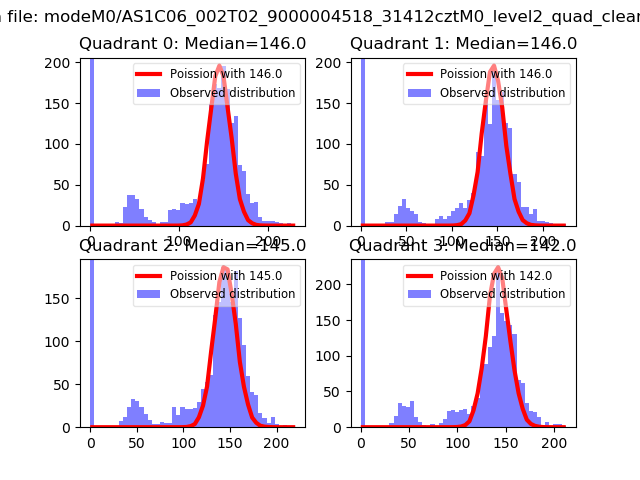 |
 |
| Quadrant-wise count rates Data is divided into 100 sec bins |
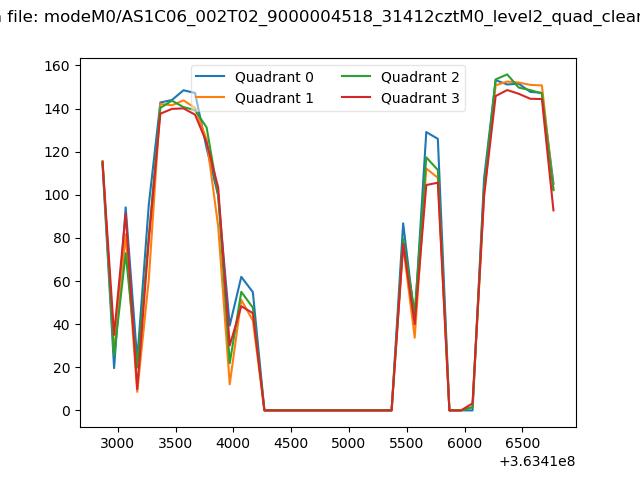 |
|
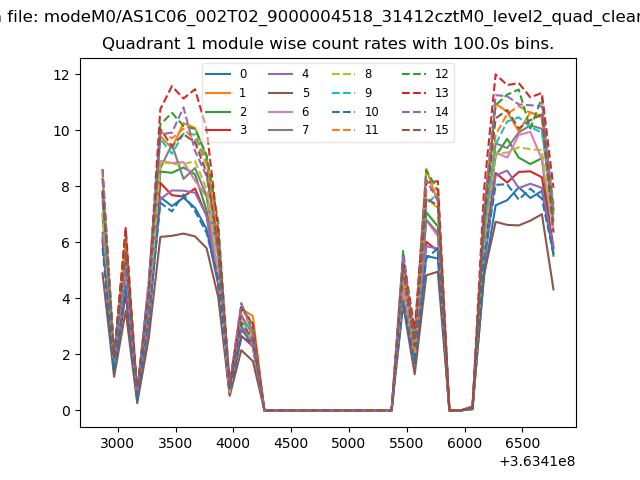
| Module-wise count rates for Quadrant A Data is divided into 100 sec bins |
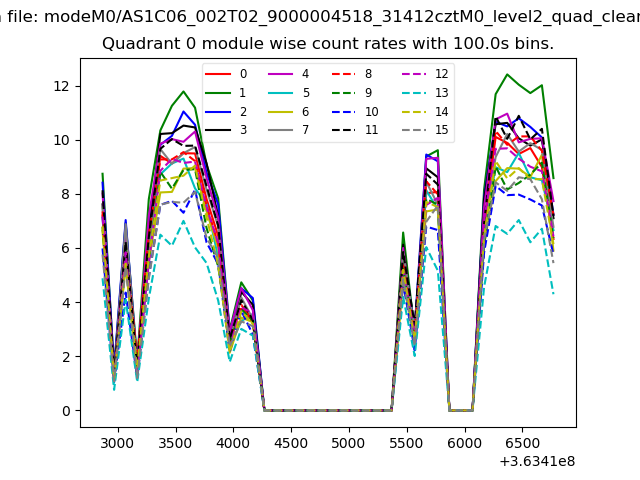 |
 |
| Module-wise count rates for Quadrant B Data is divided into 100 sec bins |
 |
 |
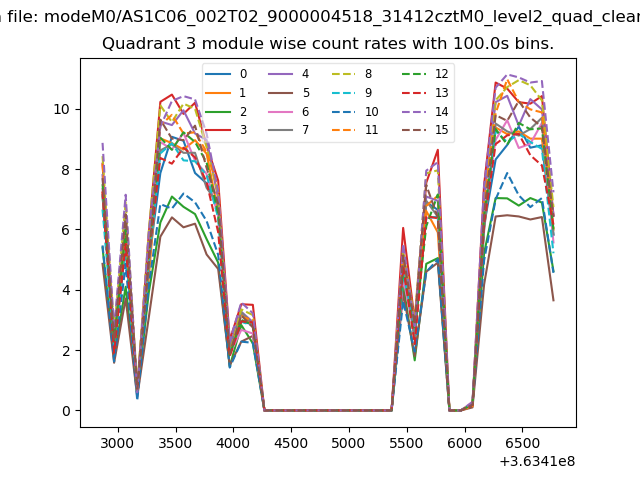
| Module-wise count rates for Quadrant C Data is divided into 100 sec bins |
 |
 |
| Module-wise count rates for Quadrant D Data is divided into 100 sec bins |
 |
 |
| Parameter | Plot |
|---|---|
| CZT HV Monitor | 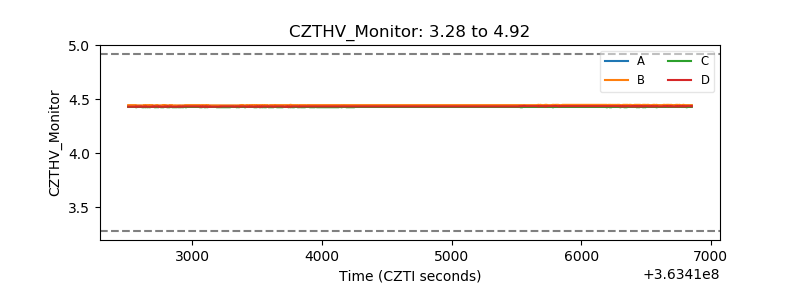 |
| D_VDD | 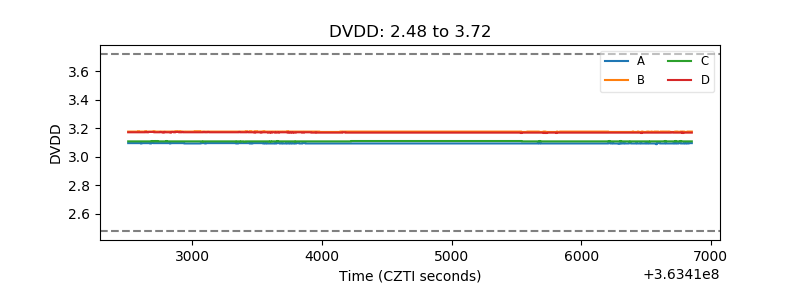 |
| Temperature 1 | 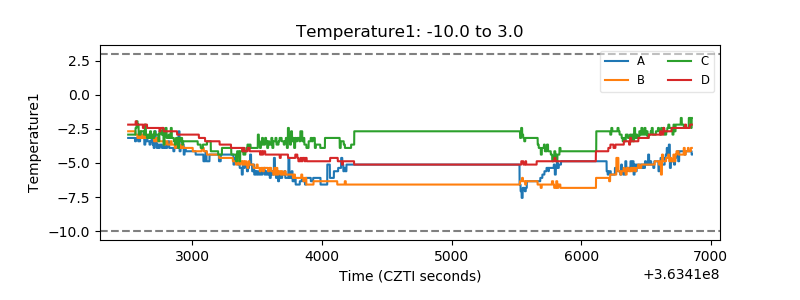 |
| Veto HV Monitor | 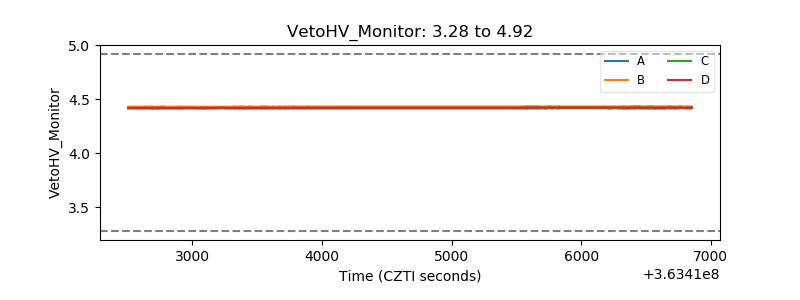 |
| Veto LLD | 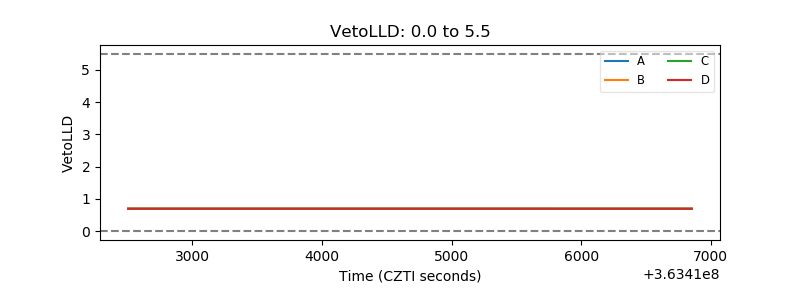 |
| Alpha Counter | 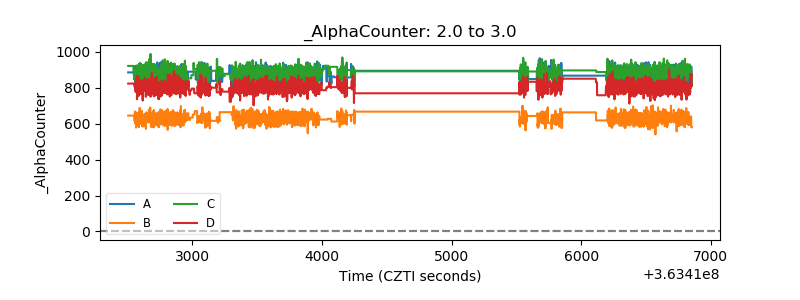 |
| _CPM_Rate | 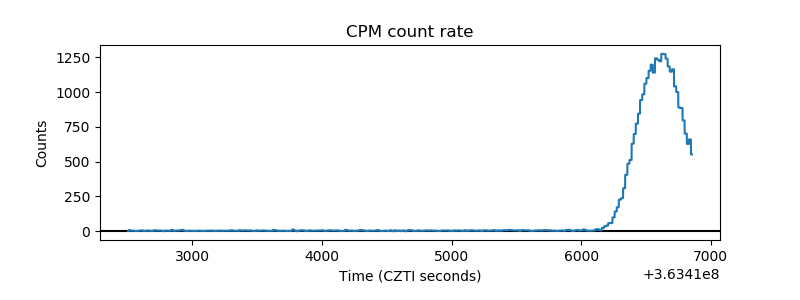 |
| CZT Counter | 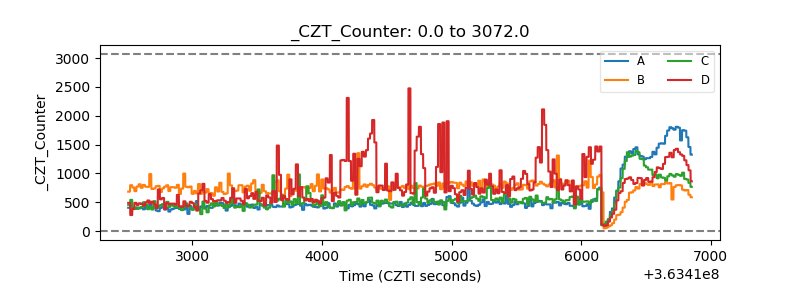 |
| +2.5 Volts monitor |  |
| +5 Volts monitor |  |
| _ROLL_ROT | 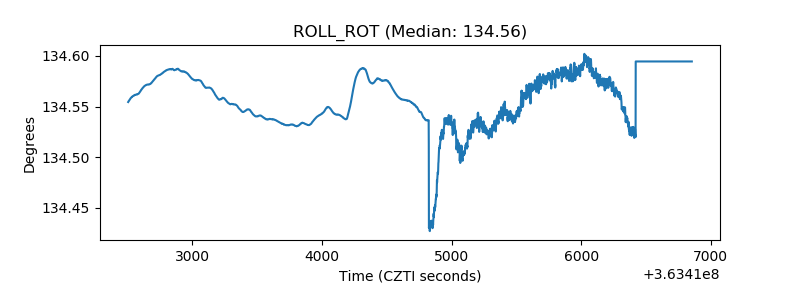 |
| _Roll_DEC | 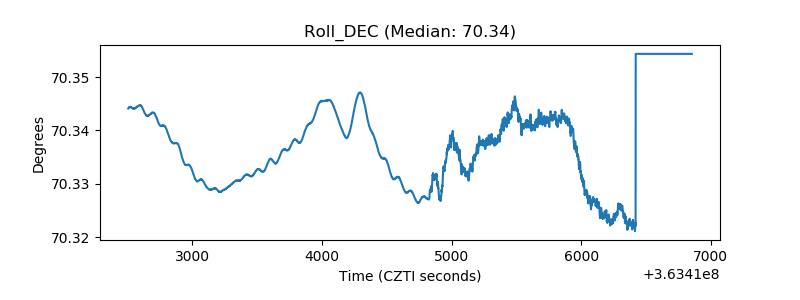 |
| _Roll_RA | 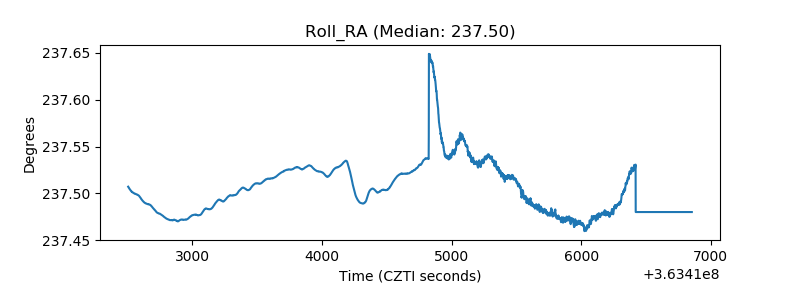 |
| Veto Counter | 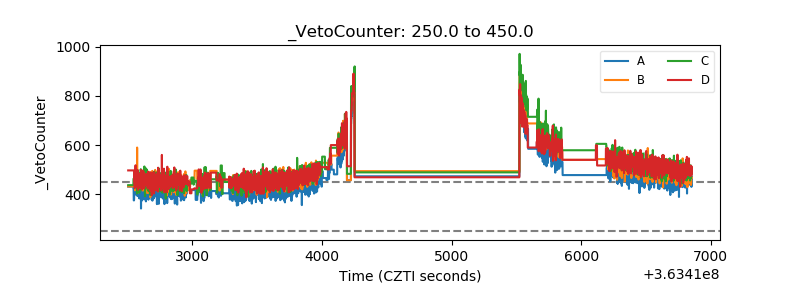 |