| Param | Original file | Final file |
|---|---|---|
| Filename | modeM0/AS1A10_073T02_9000004522cztM0_level2.fits | modeM0/AS1A10_073T02_9000004522cztM0_level2_quad_clean.evt |
| Size (bytes) | 918,247,680 | 769,446,720 |
| Size | 875.7 MB | 733.8 MB |
| Events in quadrant A | 5,842,626 | 4,630,218 |
| Events in quadrant B | 5,372,028 | 4,434,494 |
| Events in quadrant C | 5,531,884 | 4,326,871 |
| Events in quadrant D | 4,740,292 | 3,590,987 |
| Mode M9 | |||
|---|---|---|---|
| Quadrant | BADHDUFLAG | Total packets | Discarded packets |
| A | 0 | 131 | 0 |
| B | 0 | 131 | 0 |
| C | 0 | 131 | 0 |
| D | 0 | 131 | 0 |
| Mode SS | |||
|---|---|---|---|
| Quadrant | BADHDUFLAG | Total packets | Discarded packets |
| A | 0 | 1882 | 0 |
| B | 0 | 1886 | 0 |
| C | 0 | 1886 | 0 |
| D | 0 | 1884 | 0 |
| Mode M0 | |||
|---|---|---|---|
| Quadrant | BADHDUFLAG | Total packets | Discarded packets |
| A | 0 | 192918 | 0 |
| B | 0 | 290737 | 0 |
| C | 0 | 214027 | 0 |
| D | 0 | 318524 | 0 |
| Quadrant | Total seconds | Saturated seconds | Saturation percentage |
|---|---|---|---|
| A | 92191 | 822 | 0.891627% |
| B | 92104 | 3213 | 3.488448% |
| C | 92141 | 2919 | 3.167971% |
| D | 92107 | 8326 | 9.039487% |
Noise dominated data is calculated using 1-second bins in cleaned event files. If a bin has >2000 counts, and if more than 50% of those come from <1% of pixels, then it is considered to be noise-dominated and hence unusable.
| Quadrant | # 1 sec bins | Bins with >0 counts | Bins with >2000 counts | High rate bins dominated by noise | Noise dominated (total time) | Noise dominated (detector-on time) | Marked lightcurve |
|---|---|---|---|---|---|---|---|
| A | 106005 | 92363 | 0 | 0 | 0.00% | 0.00% |  |
| B | 106005 | 92231 | 0 | 0 | 0.00% | 0.00% |  |
| C | 106005 | 92313 | 0 | 0 | 0.00% | 0.00% |  |
| D | 106005 | 92243 | 0 | 0 | 0.00% | 0.00% |  |
Top three noisy pixels from each quadrant. If the there are fewer than three noisy pixels in the level2.evt file, extra rows are filled as -1
| Pixel properties | Quadrant properties | ||||||
|---|---|---|---|---|---|---|---|
| Quadrant | DetID | PixID | Counts | Sigma | Mean | Median | Sigma |
| A | 0 | 29 | 5682 | 11.44 | 1523 | 1434 | 371.2 |
| A | 9 | 19 | 4442 | 8.1 | 1523 | 1434 | 371.2 |
| A | 7 | 110 | 4436 | 8.09 | 1523 | 1434 | 371.2 |
| B | 2 | 9 | 4159 | 9.94 | 1424 | 1364 | 281.2 |
| B | 3 | 80 | 3576 | 7.87 | 1424 | 1364 | 281.2 |
| B | 2 | 8 | 3529 | 7.7 | 1424 | 1364 | 281.2 |
| C | 12 | 241 | 3896 | 6.89 | 1466 | 1377 | 365.5 |
| C | 3 | 126 | 3748 | 6.49 | 1466 | 1377 | 365.5 |
| C | 3 | 187 | 3741 | 6.47 | 1466 | 1377 | 365.5 |
| D | 10 | 189 | 3388 | 6.06 | 1356 | 1241 | 354.4 |
| D | 7 | 3 | 3310 | 5.84 | 1356 | 1241 | 354.4 |
| D | 6 | 67 | 3277 | 5.74 | 1356 | 1241 | 354.4 |
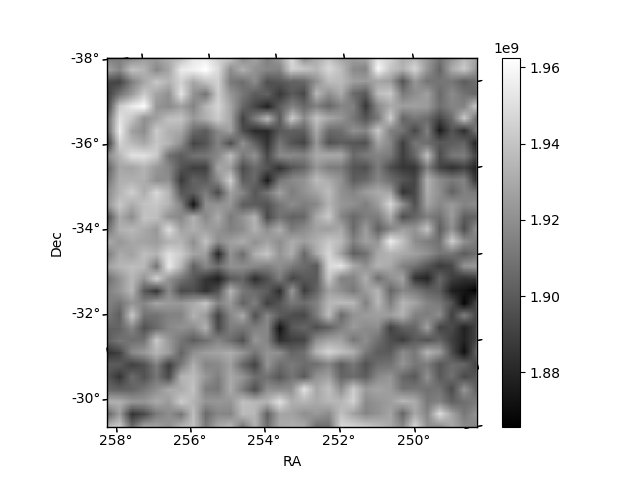
Histogram calculated using DETX and DETY for each event in the final _common_clean file
| Quadrant A |  |
 |
Quadrant B |
|---|---|---|---|
| Quadrant D |  |
 |
Quadrant C |
| Plot type | Count rate plots | Images |
|---|---|---|
| Comparison with Poisson distribution Blue bars denote a histogram of data divided into 1 sec bins. Red curve is a Poisson curve with rate = median count rate of data. |
 |
 |
| Quadrant-wise count rates Data is divided into 100 sec bins |
 |
|
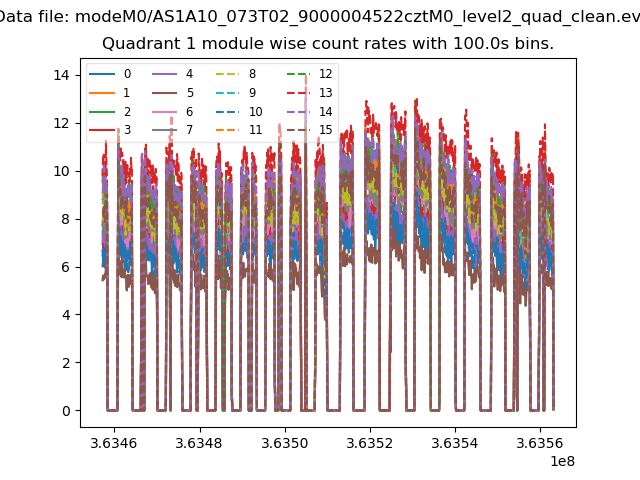
| Module-wise count rates for Quadrant A Data is divided into 100 sec bins |
 |
 |
| Module-wise count rates for Quadrant B Data is divided into 100 sec bins |
 |
 |
| Module-wise count rates for Quadrant C Data is divided into 100 sec bins |
 |
 |
| Module-wise count rates for Quadrant D Data is divided into 100 sec bins |
 |
 |
| Parameter | Plot |
|---|---|
| CZT HV Monitor | 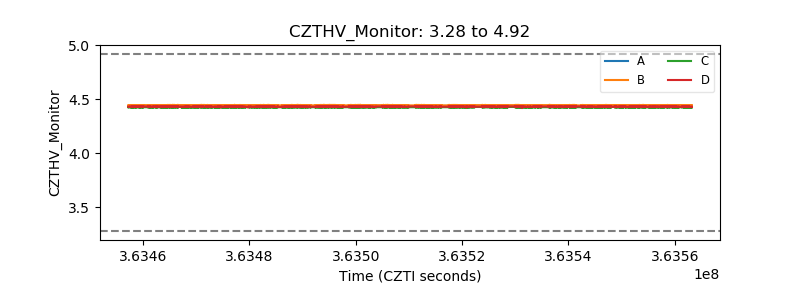 |
| D_VDD | 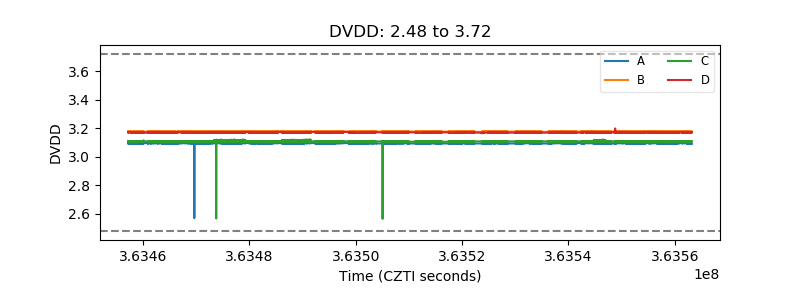 |
| Temperature 1 |  |
| Veto HV Monitor |  |
| Veto LLD |  |
| Alpha Counter |  |
| _CPM_Rate |  |
| CZT Counter |  |
| +2.5 Volts monitor | 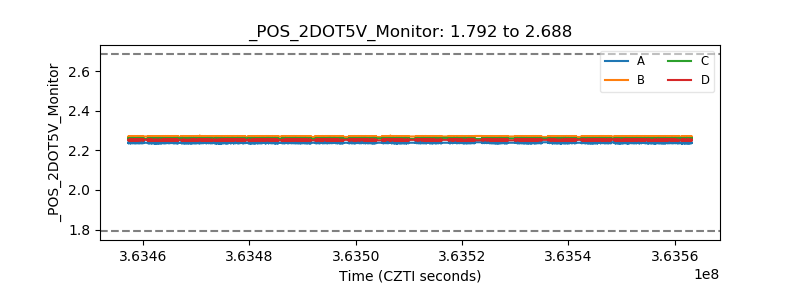 |
| +5 Volts monitor |  |
| _ROLL_ROT |  |
| _Roll_DEC | 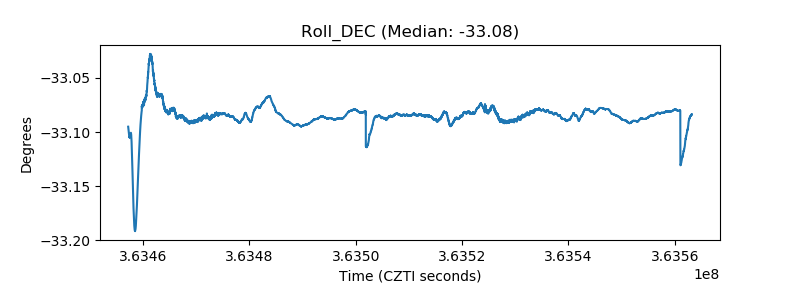 |
| _Roll_RA | 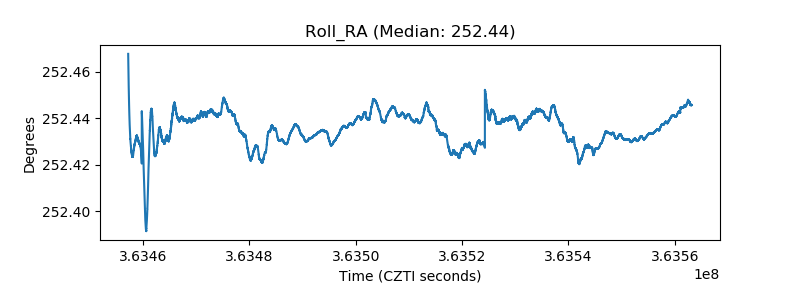 |
| Veto Counter |  |