| Param | Original file | Final file |
|---|---|---|
| Filename | modeM0/AS1A10_073T02_9000004522_31240cztM0_level2.evt | modeM0/AS1A10_073T02_9000004522_31240cztM0_level2_quad_clean.evt |
| Size (bytes) | 429,865,920 | 60,050,880 |
| Size | 410.0 MB | 57.3 MB |
| Events in quadrant A | 2,365,938 | 388,219 |
| Events in quadrant B | 3,676,713 | 381,540 |
| Events in quadrant C | 2,764,118 | 364,620 |
| Events in quadrant D | 3,899,800 | 360,735 |
| Mode M9 | |||
|---|---|---|---|
| Quadrant | BADHDUFLAG | Total packets | Discarded packets |
| A | 0 | 7 | 0 |
| B | 0 | 7 | 0 |
| C | 0 | 7 | 0 |
| D | 0 | 7 | 0 |
| Mode SS | |||
|---|---|---|---|
| Quadrant | BADHDUFLAG | Total packets | Discarded packets |
| A | 0 | 94 | 0 |
| B | 0 | 94 | 0 |
| C | 0 | 94 | 0 |
| D | 0 | 94 | 0 |
| Mode M0 | |||
|---|---|---|---|
| Quadrant | BADHDUFLAG | Total packets | Discarded packets |
| A | 0 | 9903 | 1 |
| B | 0 | 14222 | 1 |
| C | 0 | 11124 | 1 |
| D | 0 | 14949 | 1 |
| Quadrant | Total seconds | Saturated seconds | Saturation percentage |
|---|---|---|---|
| A | 4595 | 83 | 1.806311% |
| B | 4595 | 165 | 3.590860% |
| C | 4595 | 253 | 5.505985% |
| D | 4595 | 197 | 4.287269% |
Noise dominated data is calculated using 1-second bins in cleaned event files. If a bin has >2000 counts, and if more than 50% of those come from <1% of pixels, then it is considered to be noise-dominated and hence unusable.
| Quadrant | # 1 sec bins | Bins with >0 counts | Bins with >2000 counts | High rate bins dominated by noise | Noise dominated (total time) | Noise dominated (detector-on time) | Marked lightcurve |
|---|---|---|---|---|---|---|---|
| A | 5330 | 4597 | 19 | 19 | 0.36% | 0.41% | 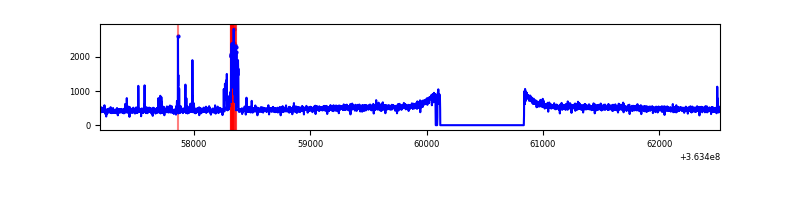 |
| B | 5330 | 4597 | 11 | 11 | 0.21% | 0.24% | 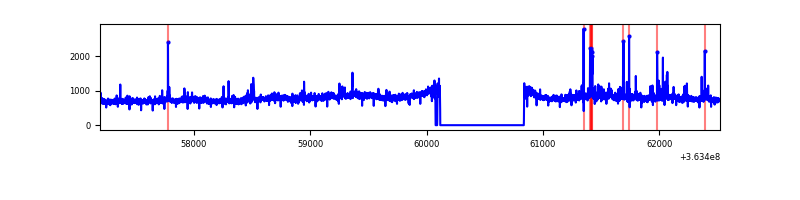 |
| C | 5330 | 4597 | 104 | 104 | 1.95% | 2.26% | 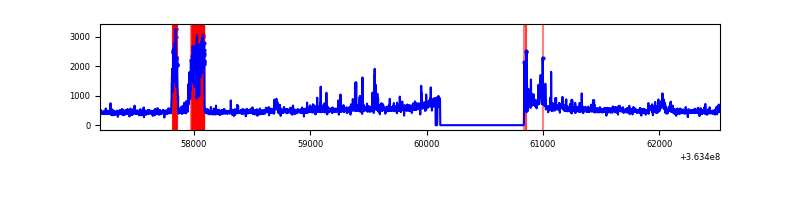 |
| D | 5330 | 4597 | 53 | 53 | 0.99% | 1.15% | 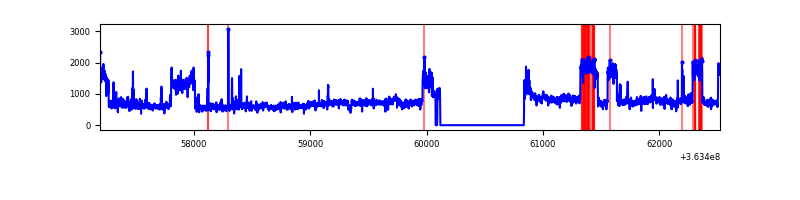 |
Top three noisy pixels from each quadrant. If the there are fewer than three noisy pixels in the level2.evt file, extra rows are filled as -1
| Pixel properties | Quadrant properties | ||||||
|---|---|---|---|---|---|---|---|
| Quadrant | DetID | PixID | Counts | Sigma | Mean | Median | Sigma |
| A | 5 | 16 | 116750 | 977.47 | 582 | 571 | 118.9 |
| A | 13 | 254 | 9690 | 76.72 | 582 | 571 | 118.9 |
| A | 3 | 137 | 5853 | 44.44 | 582 | 571 | 118.9 |
| B | 6 | 159 | 1290109 | 11485.39 | 572 | 557 | 112.3 |
| B | 0 | 190 | 63417 | 559.86 | 572 | 557 | 112.3 |
| B | 0 | 155 | 32692 | 286.21 | 572 | 557 | 112.3 |
| C | 3 | 233 | 427680 | 3279.38 | 550 | 552 | 130.2 |
| C | 14 | 238 | 91465 | 698.01 | 550 | 552 | 130.2 |
| C | 0 | 10 | 80141 | 611.06 | 550 | 552 | 130.2 |
| D | 8 | 195 | 1696485 | 12418.61 | 554 | 541 | 136.6 |
| D | 2 | 250 | 50733 | 367.53 | 554 | 541 | 136.6 |
| D | 2 | 234 | 20788 | 148.26 | 554 | 541 | 136.6 |
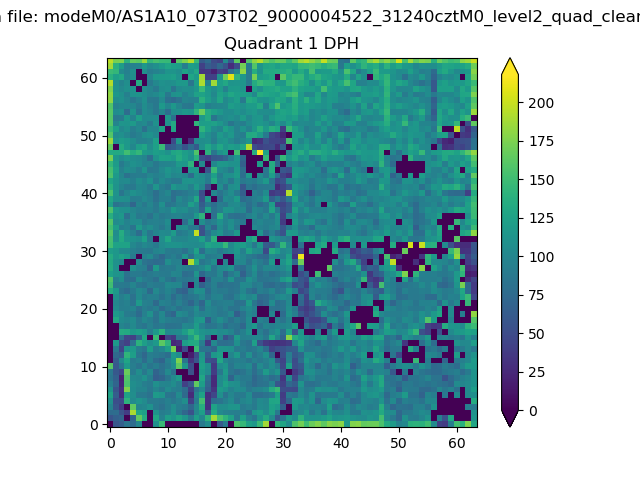
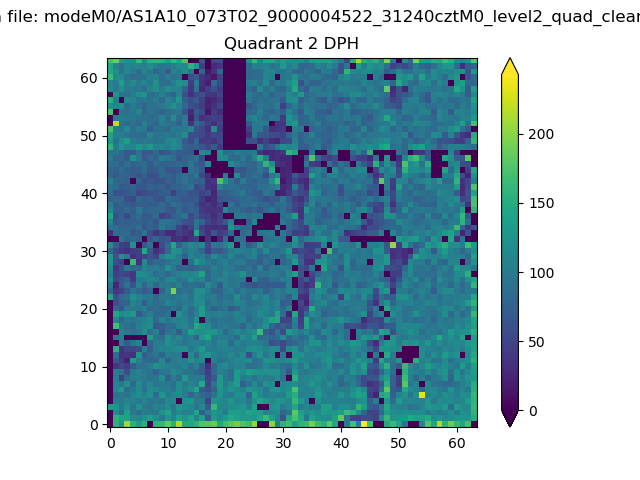
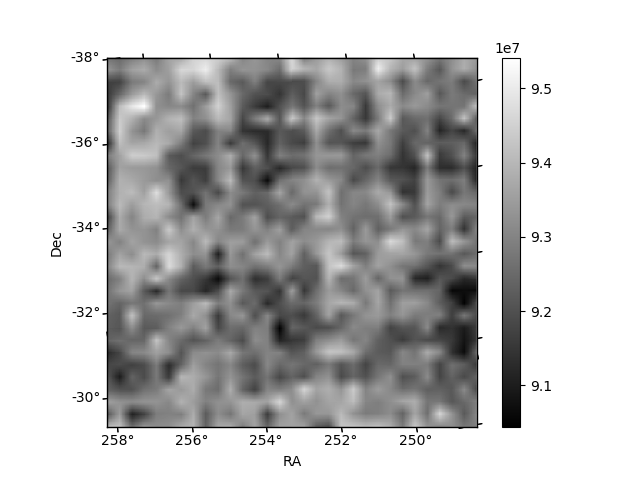
Histogram calculated using DETX and DETY for each event in the final _common_clean file
| Quadrant A |  |
 |
Quadrant B |
|---|---|---|---|
| Quadrant D |  |
 |
Quadrant C |
| Plot type | Count rate plots | Images |
|---|---|---|
| Comparison with Poisson distribution Blue bars denote a histogram of data divided into 1 sec bins. Red curve is a Poisson curve with rate = median count rate of data. |
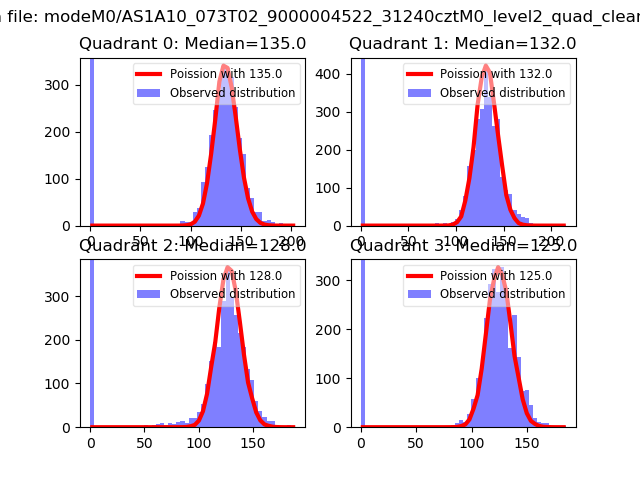 |
 |
| Quadrant-wise count rates Data is divided into 100 sec bins |
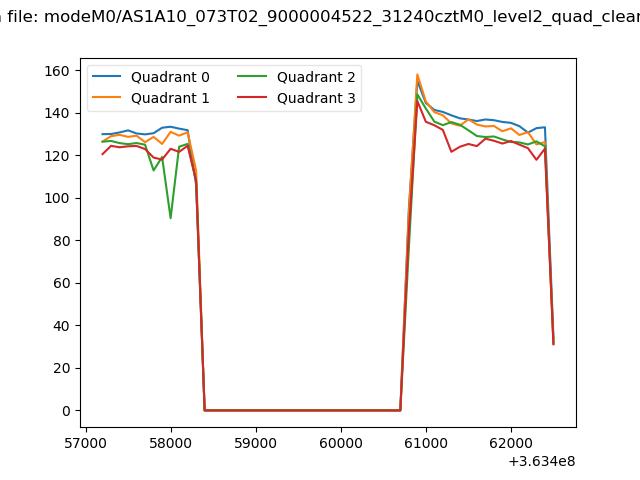 |
|
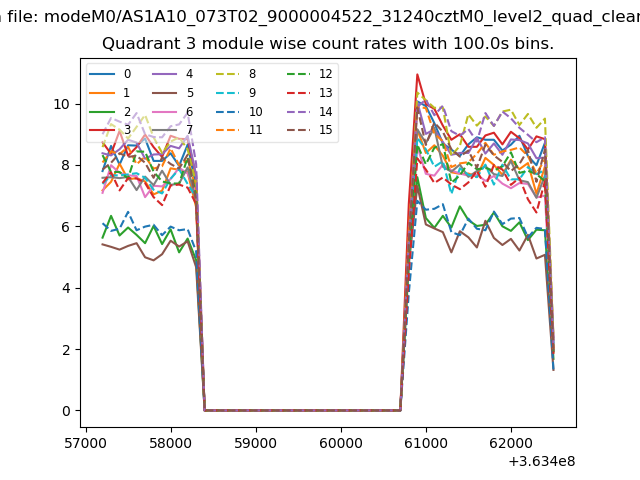
| Module-wise count rates for Quadrant A Data is divided into 100 sec bins |
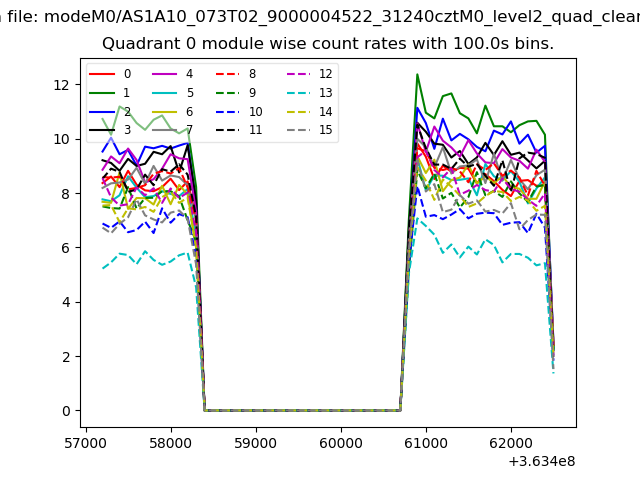 |
 |
| Module-wise count rates for Quadrant B Data is divided into 100 sec bins |
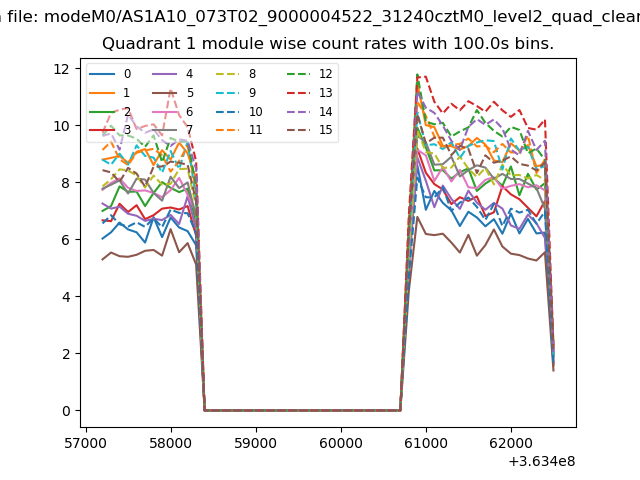 |
 |
| Module-wise count rates for Quadrant C Data is divided into 100 sec bins |
 |
 |
| Module-wise count rates for Quadrant D Data is divided into 100 sec bins |
 |
 |
| Parameter | Plot |
|---|---|
| CZT HV Monitor | 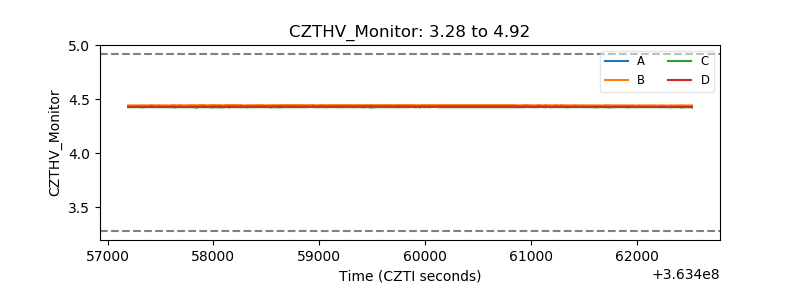 |
| D_VDD | 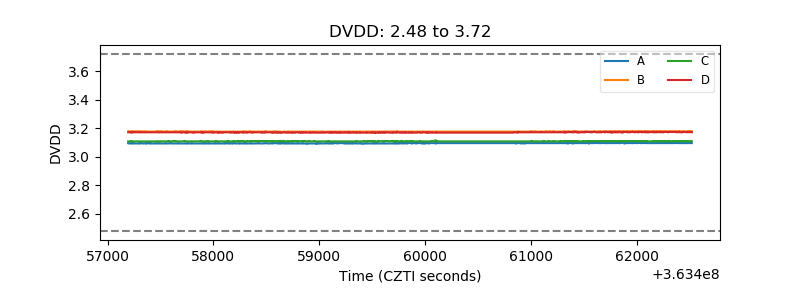 |
| Temperature 1 | 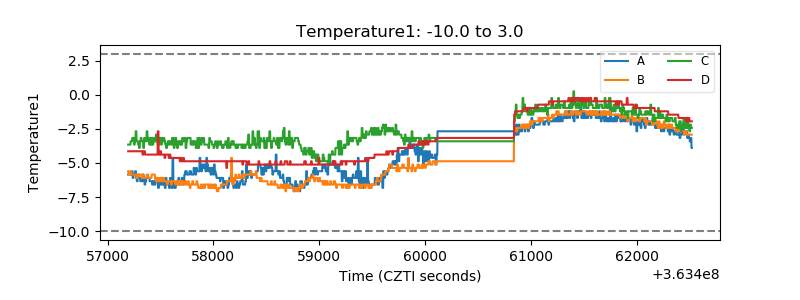 |
| Veto HV Monitor |  |
| Veto LLD | 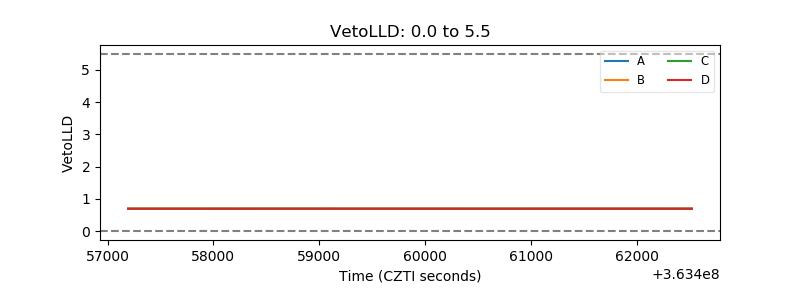 |
| Alpha Counter | 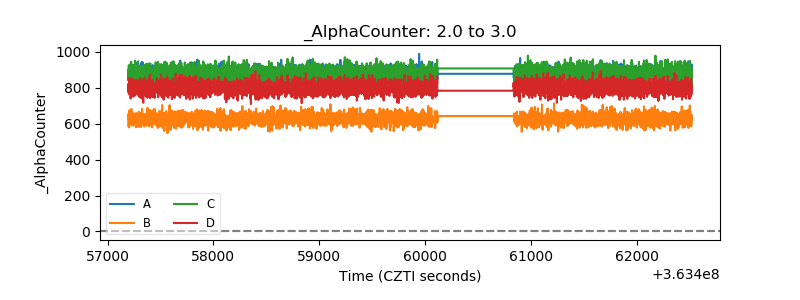 |
| _CPM_Rate | 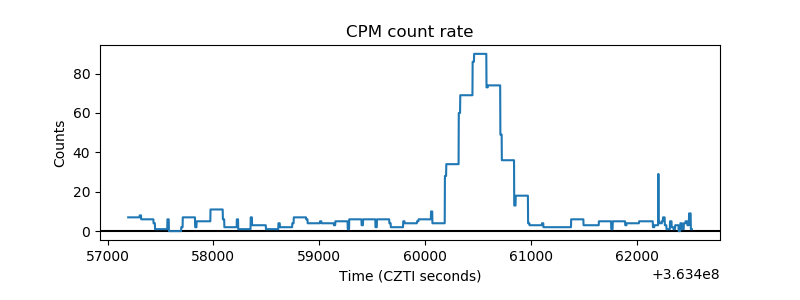 |
| CZT Counter | 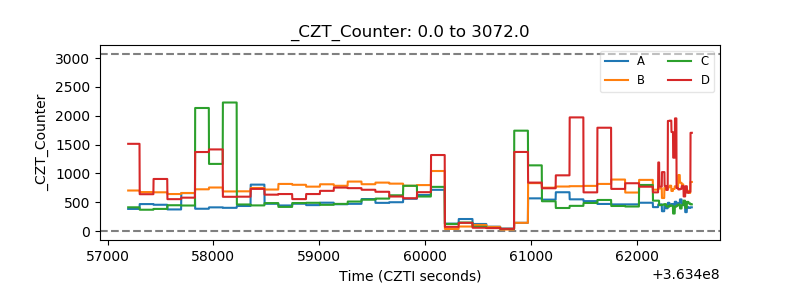 |
| +2.5 Volts monitor |  |
| +5 Volts monitor | 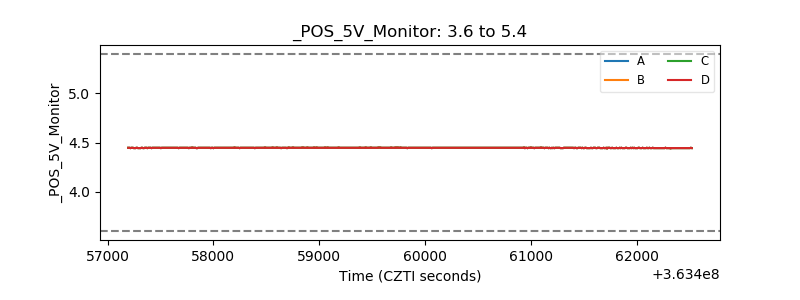 |
| _ROLL_ROT | 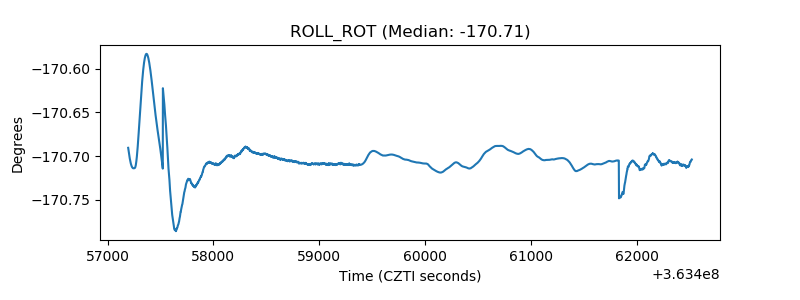 |
| _Roll_DEC | 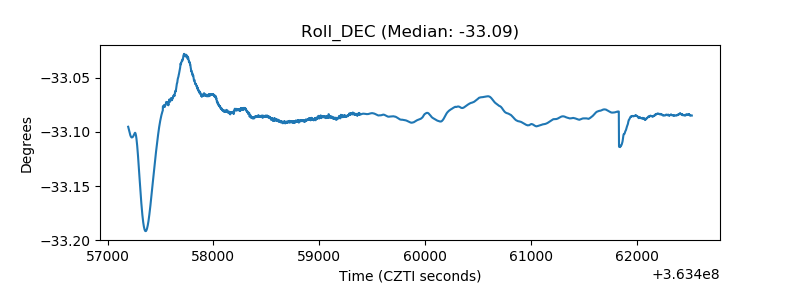 |
| _Roll_RA | 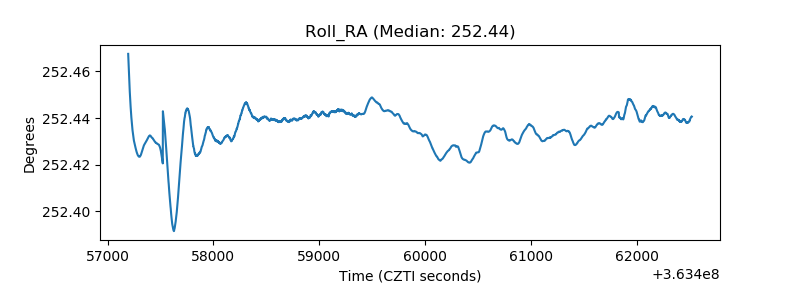 |
| Veto Counter | 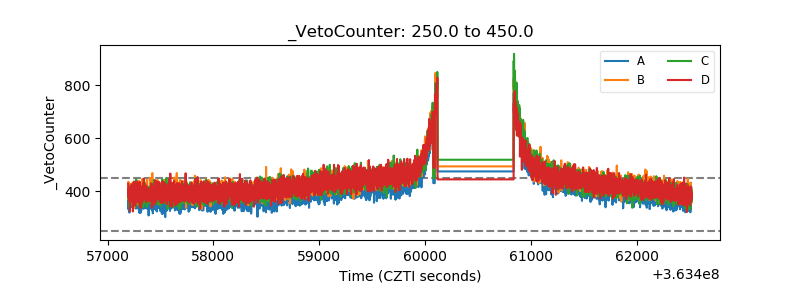 |