| Param | Original file | Final file |
|---|---|---|
| Filename | modeM0/AS1A10_073T02_9000004522_31241cztM0_level2.evt | modeM0/AS1A10_073T02_9000004522_31241cztM0_level2_quad_clean.evt |
| Size (bytes) | 706,201,920 | 107,573,760 |
| Size | 673.5 MB | 102.6 MB |
| Events in quadrant A | 3,601,744 | 710,923 |
| Events in quadrant B | 6,034,823 | 697,810 |
| Events in quadrant C | 4,064,152 | 674,533 |
| Events in quadrant D | 7,183,841 | 655,911 |
| Mode M9 | |||
|---|---|---|---|
| Quadrant | BADHDUFLAG | Total packets | Discarded packets |
| A | 0 | 4 | 0 |
| B | 0 | 5 | 0 |
| C | 0 | 5 | 0 |
| D | 0 | 5 | 0 |
| Mode SS | |||
|---|---|---|---|
| Quadrant | BADHDUFLAG | Total packets | Discarded packets |
| A | 0 | 152 | 0 |
| B | 0 | 152 | 0 |
| C | 0 | 152 | 0 |
| D | 0 | 152 | 0 |
| Mode M0 | |||
|---|---|---|---|
| Quadrant | BADHDUFLAG | Total packets | Discarded packets |
| A | 0 | 15462 | 2 |
| B | 0 | 23242 | 2 |
| C | 0 | 16778 | 2 |
| D | 0 | 26919 | 3 |
| Quadrant | Total seconds | Saturated seconds | Saturation percentage |
|---|---|---|---|
| A | 7449 | 54 | 0.724930% |
| B | 7449 | 192 | 2.577527% |
| C | 7449 | 184 | 2.470130% |
| D | 7448 | 262 | 3.517723% |
Noise dominated data is calculated using 1-second bins in cleaned event files. If a bin has >2000 counts, and if more than 50% of those come from <1% of pixels, then it is considered to be noise-dominated and hence unusable.
| Quadrant | # 1 sec bins | Bins with >0 counts | Bins with >2000 counts | High rate bins dominated by noise | Noise dominated (total time) | Noise dominated (detector-on time) | Marked lightcurve |
|---|---|---|---|---|---|---|---|
| A | 7869 | 7450 | 0 | 0 | 0.00% | 0.00% | 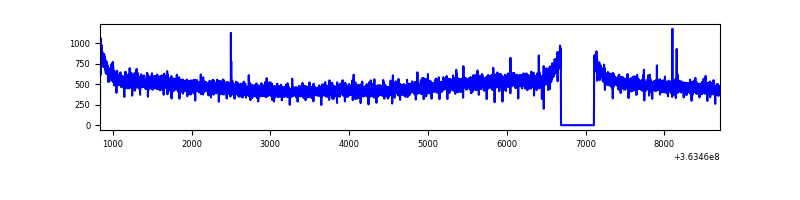 |
| B | 7869 | 7450 | 25 | 25 | 0.32% | 0.34% | 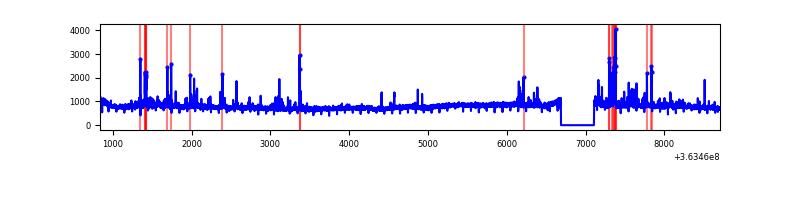 |
| C | 7869 | 7450 | 22 | 22 | 0.28% | 0.30% | 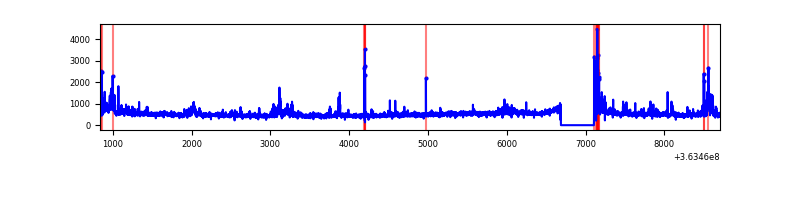 |
| D | 7868 | 7449 | 100 | 100 | 1.27% | 1.34% | 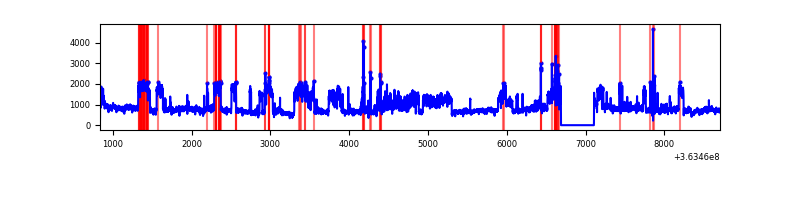 |
Top three noisy pixels from each quadrant. If the there are fewer than three noisy pixels in the level2.evt file, extra rows are filled as -1
| Pixel properties | Quadrant properties | ||||||
|---|---|---|---|---|---|---|---|
| Quadrant | DetID | PixID | Counts | Sigma | Mean | Median | Sigma |
| A | 13 | 254 | 15192 | 75.89 | 932 | 915 | 188.1 |
| A | 3 | 137 | 9495 | 45.61 | 932 | 915 | 188.1 |
| A | 0 | 226 | 8027 | 37.8 | 932 | 915 | 188.1 |
| B | 6 | 159 | 2124406 | 11978.19 | 912 | 891 | 177.3 |
| B | 0 | 190 | 142916 | 801.13 | 912 | 891 | 177.3 |
| B | 4 | 80 | 87304 | 487.43 | 912 | 891 | 177.3 |
| C | 0 | 10 | 270809 | 1312.96 | 875 | 880 | 205.6 |
| C | 14 | 238 | 147017 | 710.83 | 875 | 880 | 205.6 |
| C | 3 | 233 | 110766 | 534.5 | 875 | 880 | 205.6 |
| D | 8 | 195 | 3569676 | 15768.53 | 880 | 861 | 226.3 |
| D | 2 | 250 | 120718 | 529.58 | 880 | 861 | 226.3 |
| D | 12 | 79 | 77274 | 337.62 | 880 | 861 | 226.3 |
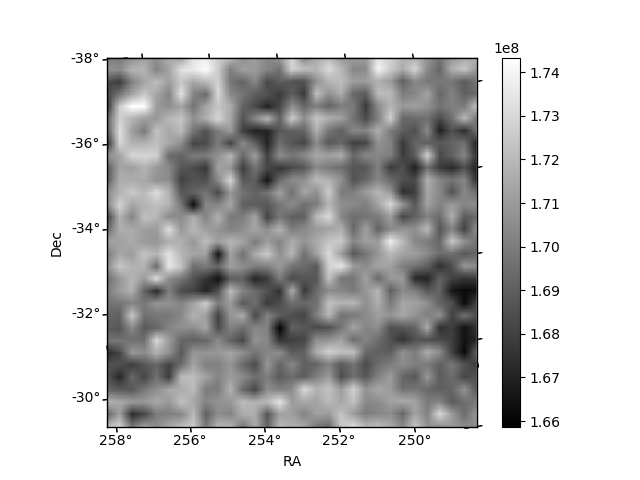
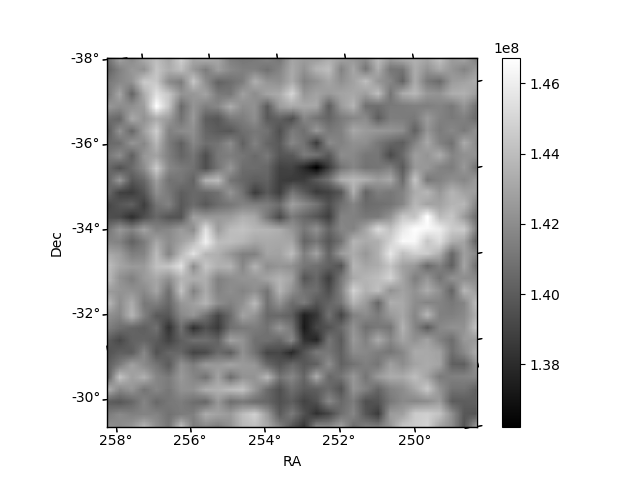
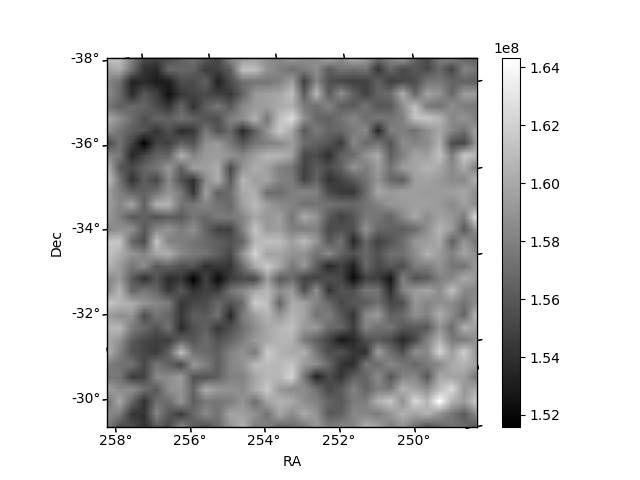
Histogram calculated using DETX and DETY for each event in the final _common_clean file
| Quadrant A |  |
 |
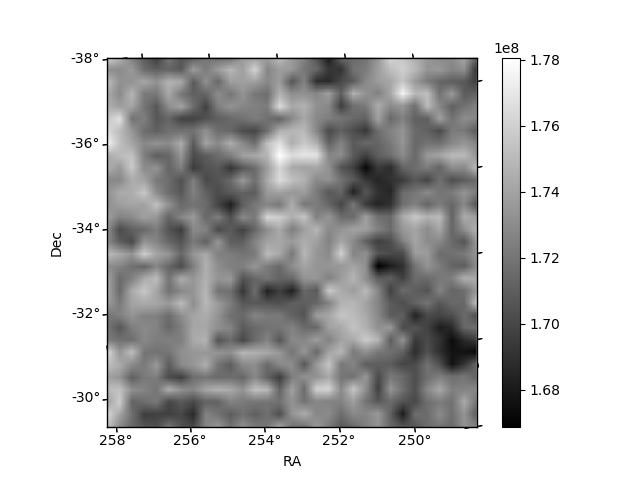
Quadrant B |
|---|---|---|---|
| Quadrant D | 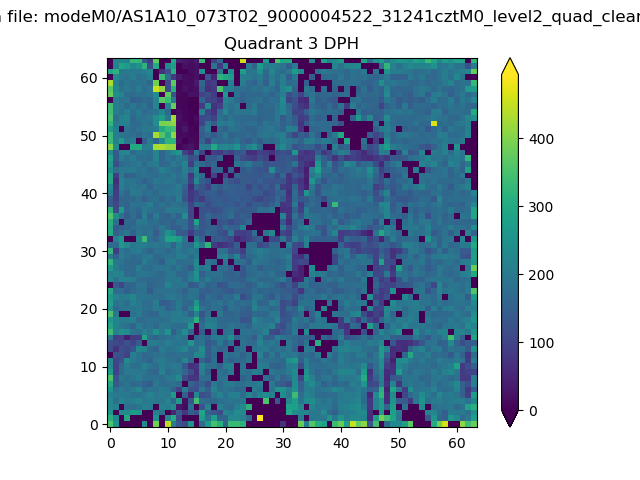 |
 |
Quadrant C |
| Plot type | Count rate plots | Images |
|---|---|---|
| Comparison with Poisson distribution Blue bars denote a histogram of data divided into 1 sec bins. Red curve is a Poisson curve with rate = median count rate of data. |
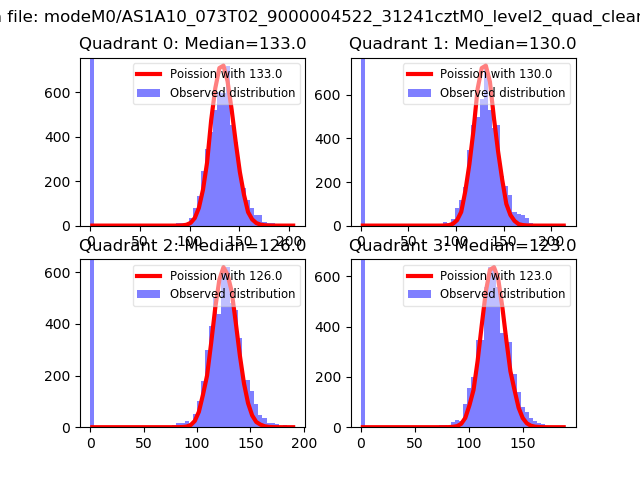 |
 |
| Quadrant-wise count rates Data is divided into 100 sec bins |
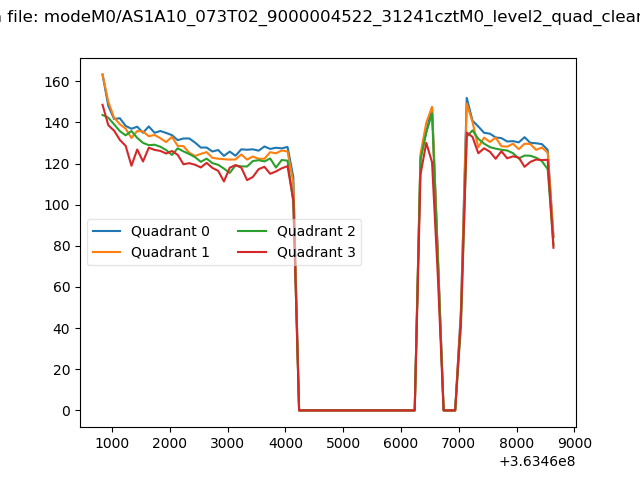 |
|
| Module-wise count rates for Quadrant A Data is divided into 100 sec bins |
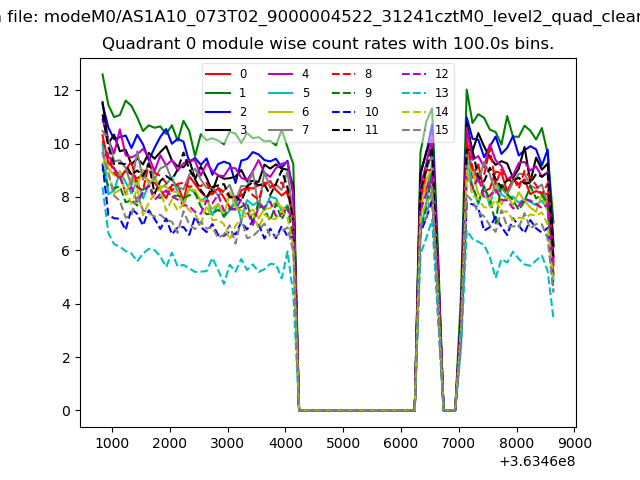 |
 |
| Module-wise count rates for Quadrant B Data is divided into 100 sec bins |
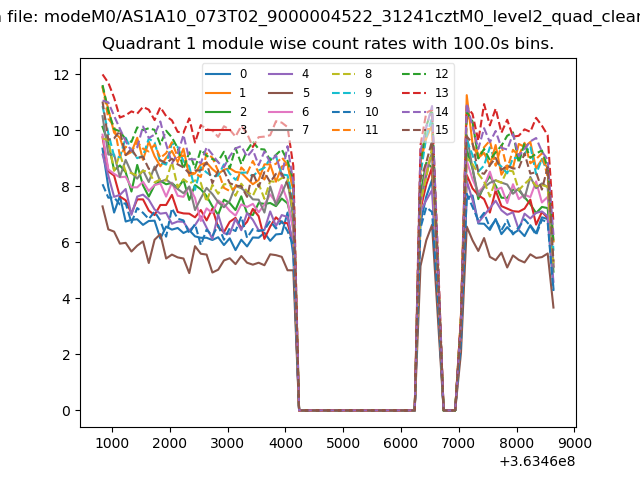 |
 |
| Module-wise count rates for Quadrant C Data is divided into 100 sec bins |
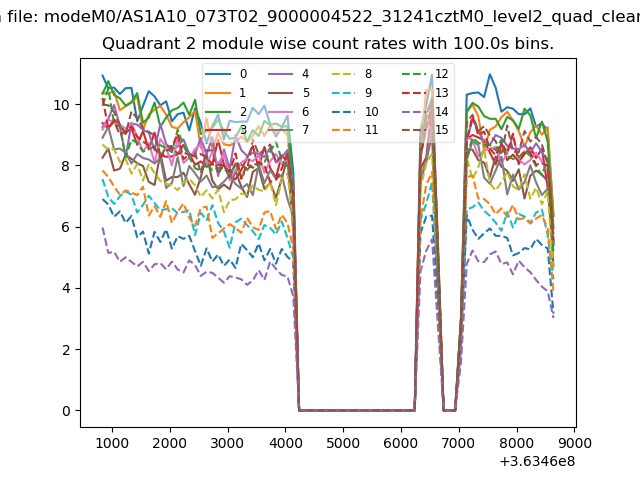 |
 |
| Module-wise count rates for Quadrant D Data is divided into 100 sec bins |
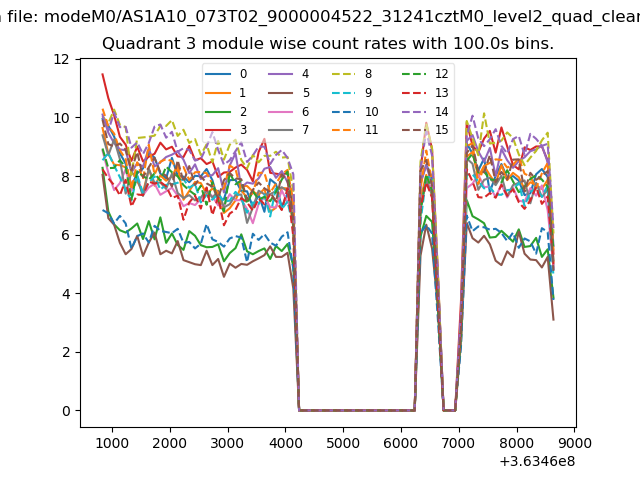 |
 |
| Parameter | Plot |
|---|---|
| CZT HV Monitor |  |
| D_VDD | 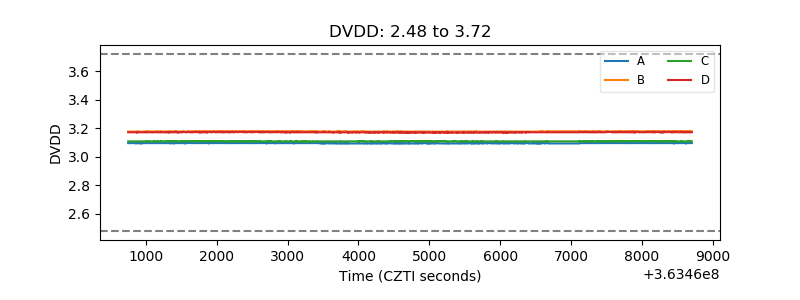 |
| Temperature 1 | 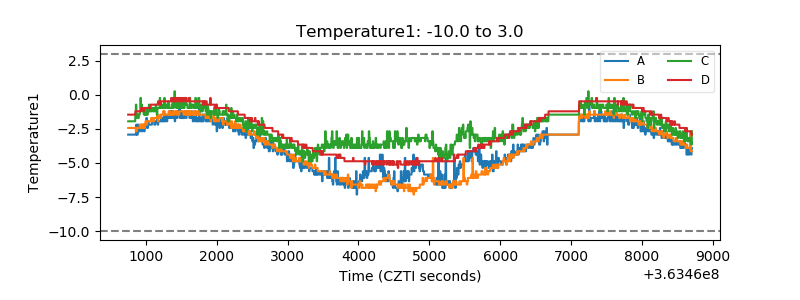 |
| Veto HV Monitor | 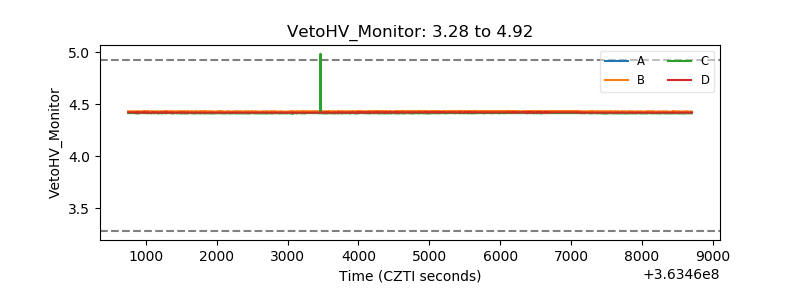 |
| Veto LLD | 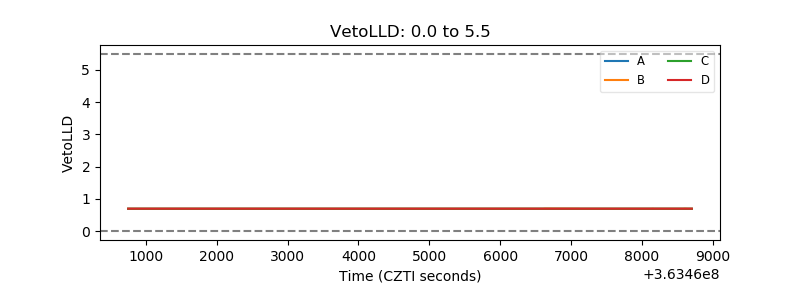 |
| Alpha Counter | 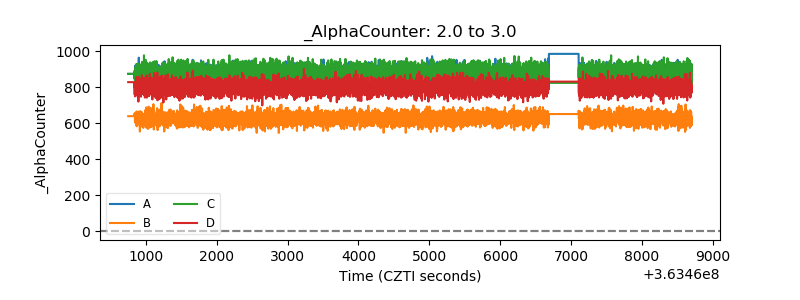 |
| _CPM_Rate | 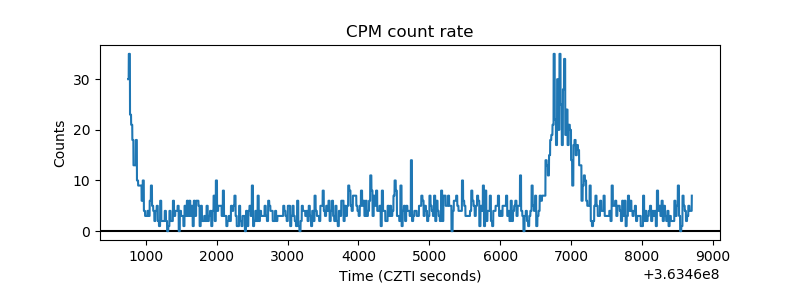 |
| CZT Counter | 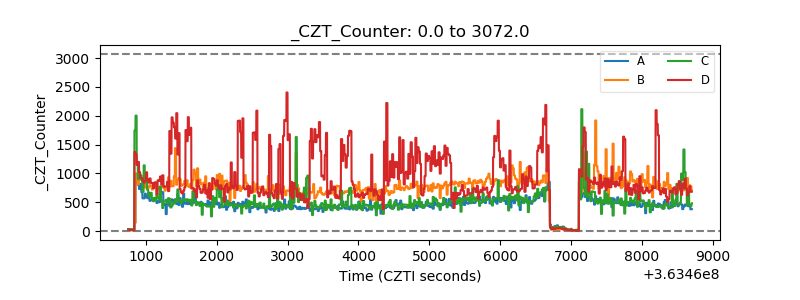 |
| +2.5 Volts monitor |  |
| +5 Volts monitor |  |
| _ROLL_ROT | 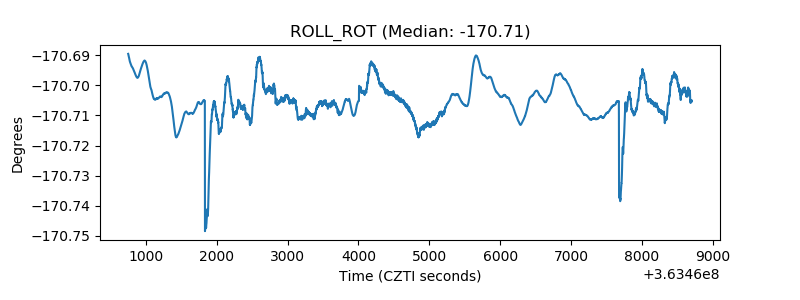 |
| _Roll_DEC | 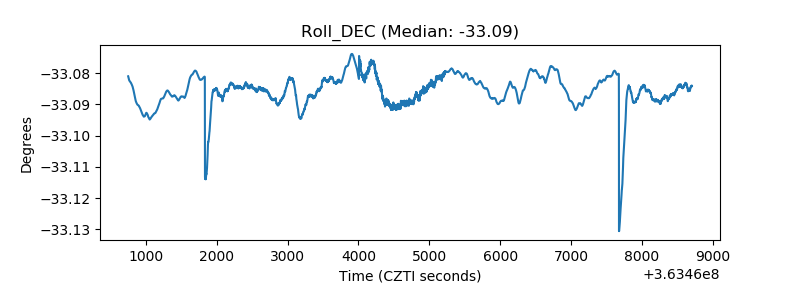 |
| _Roll_RA | 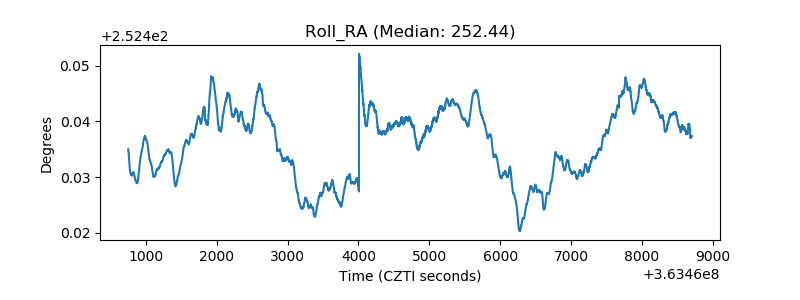 |
| Veto Counter | 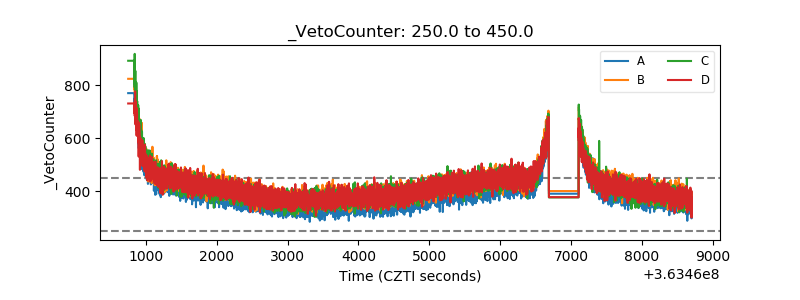 |