| Param | Original file | Final file |
|---|---|---|
| Filename | modeM0/AS1A10_073T02_9000004522_31242cztM0_level2.evt | modeM0/AS1A10_073T02_9000004522_31242cztM0_level2_quad_clean.evt |
| Size (bytes) | 715,728,960 | 110,295,360 |
| Size | 682.6 MB | 105.2 MB |
| Events in quadrant A | 3,686,847 | 729,478 |
| Events in quadrant B | 6,161,612 | 715,419 |
| Events in quadrant C | 4,295,531 | 687,589 |
| Events in quadrant D | 7,016,307 | 676,262 |
| Mode M9 | |||
|---|---|---|---|
| Quadrant | BADHDUFLAG | Total packets | Discarded packets |
| A | 0 | 6 | 0 |
| B | 0 | 6 | 0 |
| C | 0 | 6 | 0 |
| D | 0 | 6 | 0 |
| Mode SS | |||
|---|---|---|---|
| Quadrant | BADHDUFLAG | Total packets | Discarded packets |
| A | 0 | 158 | 0 |
| B | 0 | 158 | 0 |
| C | 0 | 158 | 0 |
| D | 0 | 158 | 0 |
| Mode M0 | |||
|---|---|---|---|
| Quadrant | BADHDUFLAG | Total packets | Discarded packets |
| A | 0 | 15920 | 3 |
| B | 0 | 23893 | 2 |
| C | 0 | 17600 | 2 |
| D | 0 | 26575 | 2 |
| Quadrant | Total seconds | Saturated seconds | Saturation percentage |
|---|---|---|---|
| A | 7635 | 77 | 1.008513% |
| B | 7636 | 260 | 3.404924% |
| C | 7636 | 272 | 3.562074% |
| D | 7636 | 154 | 2.016763% |
Noise dominated data is calculated using 1-second bins in cleaned event files. If a bin has >2000 counts, and if more than 50% of those come from <1% of pixels, then it is considered to be noise-dominated and hence unusable.
| Quadrant | # 1 sec bins | Bins with >0 counts | Bins with >2000 counts | High rate bins dominated by noise | Noise dominated (total time) | Noise dominated (detector-on time) | Marked lightcurve |
|---|---|---|---|---|---|---|---|
| A | 8270 | 7637 | 0 | 0 | 0.00% | 0.00% | 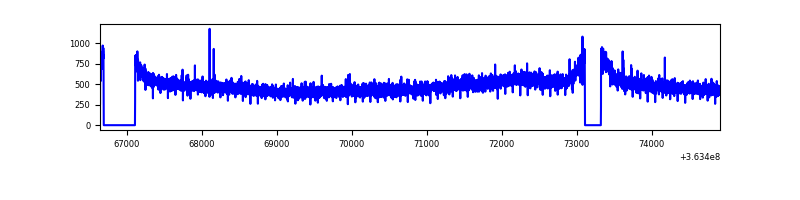 |
| B | 8271 | 7638 | 29 | 29 | 0.35% | 0.38% | 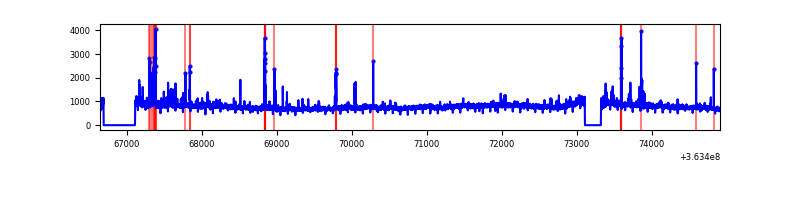 |
| C | 8271 | 7638 | 41 | 41 | 0.50% | 0.54% | 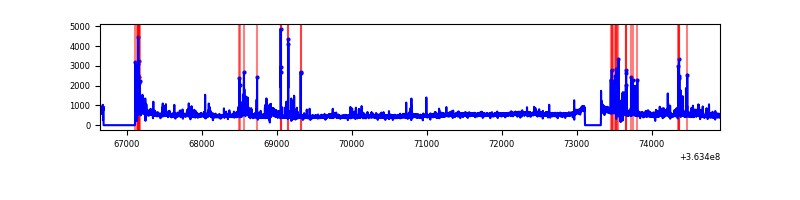 |
| D | 8271 | 7638 | 63 | 63 | 0.76% | 0.82% | 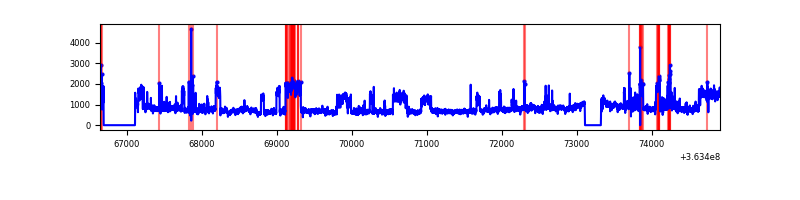 |
Top three noisy pixels from each quadrant. If the there are fewer than three noisy pixels in the level2.evt file, extra rows are filled as -1
| Pixel properties | Quadrant properties | ||||||
|---|---|---|---|---|---|---|---|
| Quadrant | DetID | PixID | Counts | Sigma | Mean | Median | Sigma |
| A | 13 | 254 | 14502 | 70.19 | 954 | 933 | 193.3 |
| A | 3 | 137 | 9876 | 46.26 | 954 | 933 | 193.3 |
| A | 0 | 226 | 8269 | 37.95 | 954 | 933 | 193.3 |
| B | 6 | 159 | 2128876 | 11782.78 | 932 | 908 | 180.6 |
| B | 0 | 190 | 148211 | 815.63 | 932 | 908 | 180.6 |
| B | 4 | 80 | 136687 | 751.82 | 932 | 908 | 180.6 |
| C | 3 | 233 | 256361 | 1216.95 | 891 | 895 | 209.9 |
| C | 14 | 238 | 164486 | 779.29 | 891 | 895 | 209.9 |
| C | 0 | 10 | 143315 | 678.44 | 891 | 895 | 209.9 |
| D | 8 | 195 | 3323247 | 14219.96 | 904 | 884 | 233.6 |
| D | 12 | 79 | 116506 | 494.87 | 904 | 884 | 233.6 |
| D | 2 | 250 | 58272 | 245.62 | 904 | 884 | 233.6 |
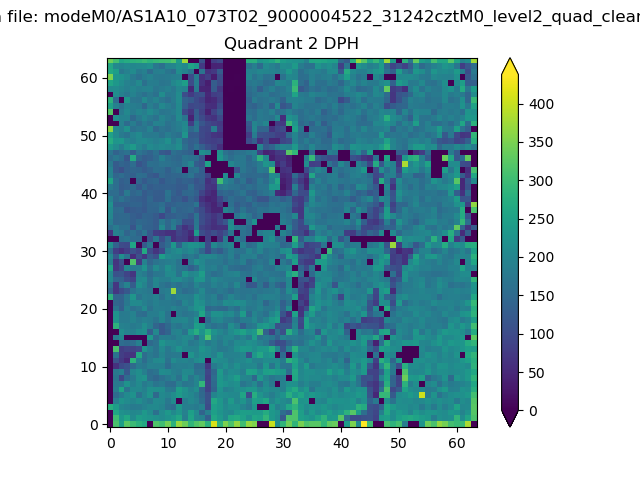
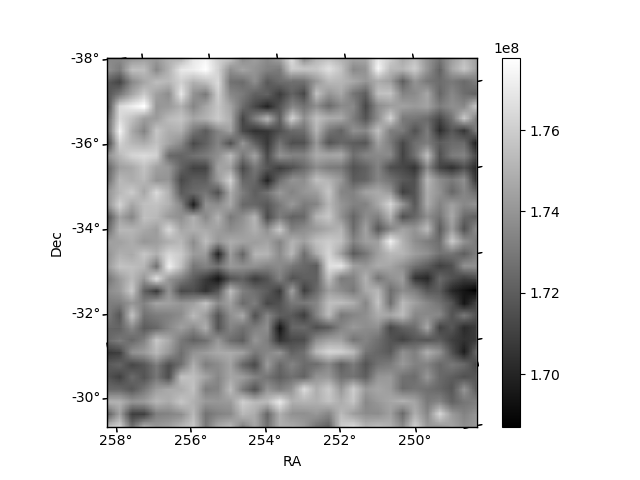
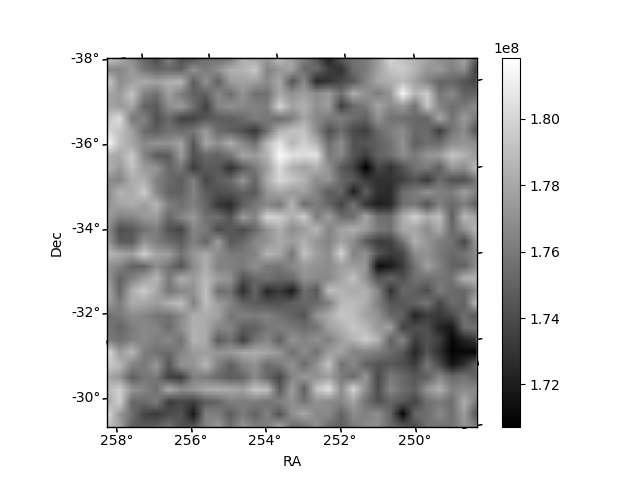
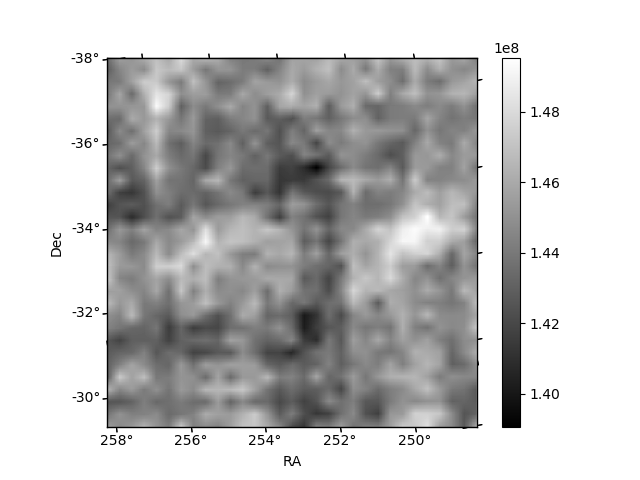
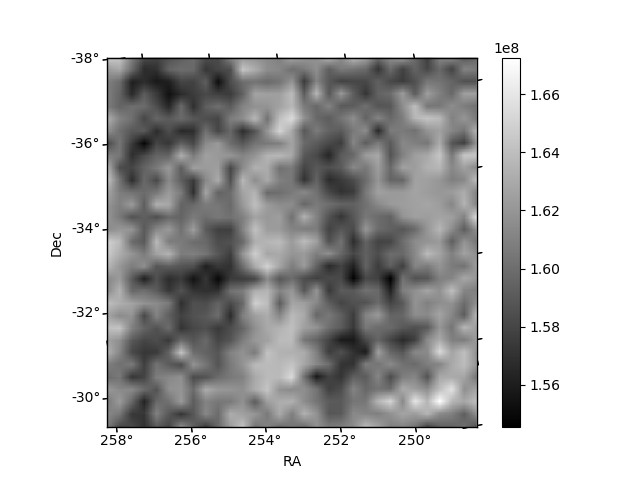
Histogram calculated using DETX and DETY for each event in the final _common_clean file
| Quadrant A |  |
 |
Quadrant B |
|---|---|---|---|
| Quadrant D |  |
 |
Quadrant C |
| Plot type | Count rate plots | Images |
|---|---|---|
| Comparison with Poisson distribution Blue bars denote a histogram of data divided into 1 sec bins. Red curve is a Poisson curve with rate = median count rate of data. |
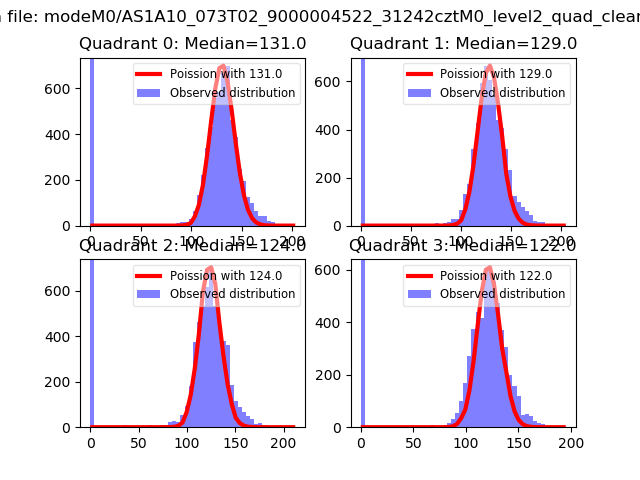 |
 |
| Quadrant-wise count rates Data is divided into 100 sec bins |
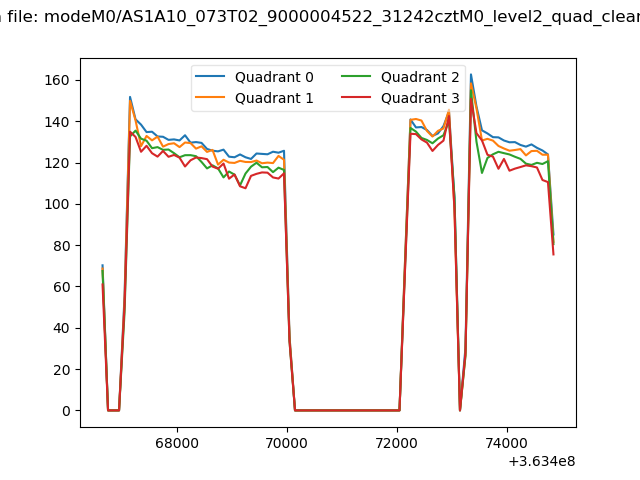 |
|
| Module-wise count rates for Quadrant A Data is divided into 100 sec bins |
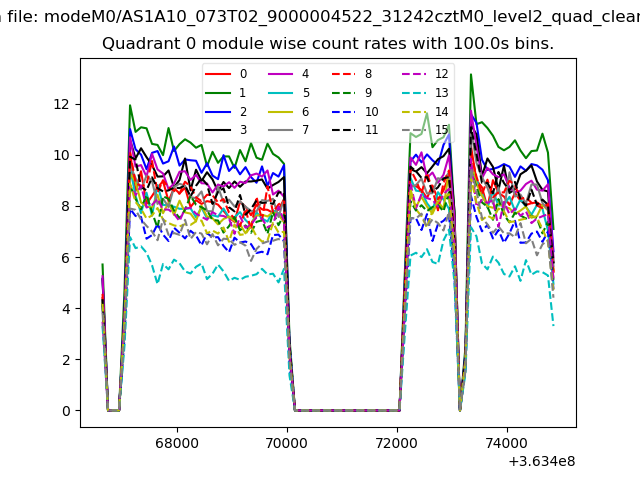 |
 |
| Module-wise count rates for Quadrant B Data is divided into 100 sec bins |
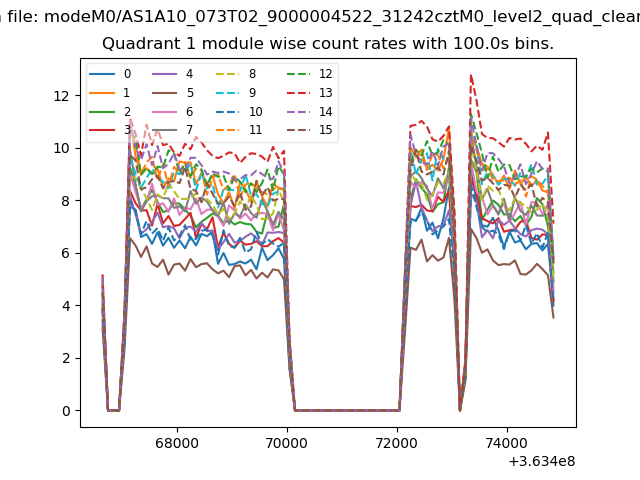 |
 |
| Module-wise count rates for Quadrant C Data is divided into 100 sec bins |
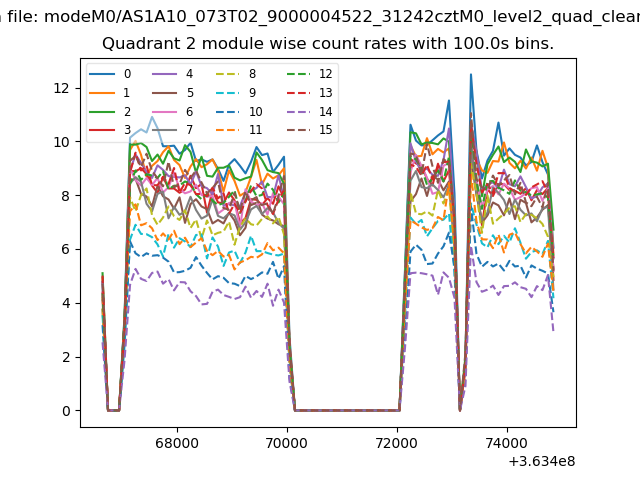 |
 |
| Module-wise count rates for Quadrant D Data is divided into 100 sec bins |
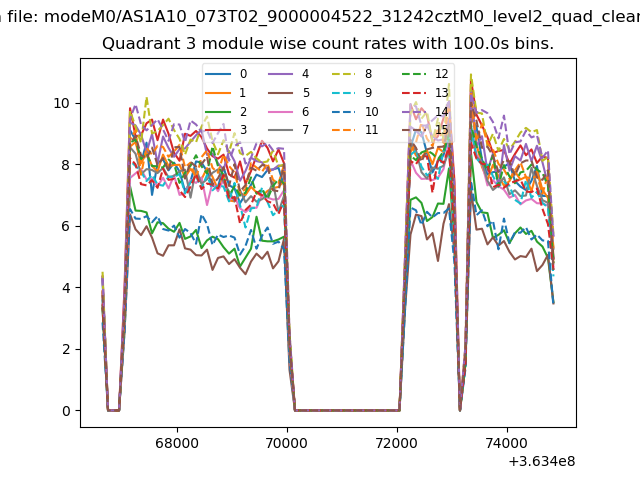 |
 |
| Parameter | Plot |
|---|---|
| CZT HV Monitor |  |
| D_VDD | 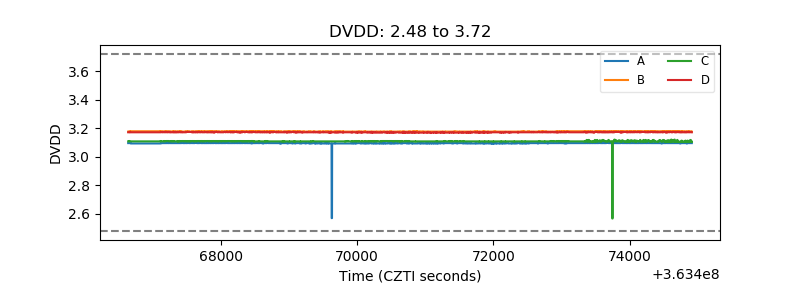 |
| Temperature 1 | 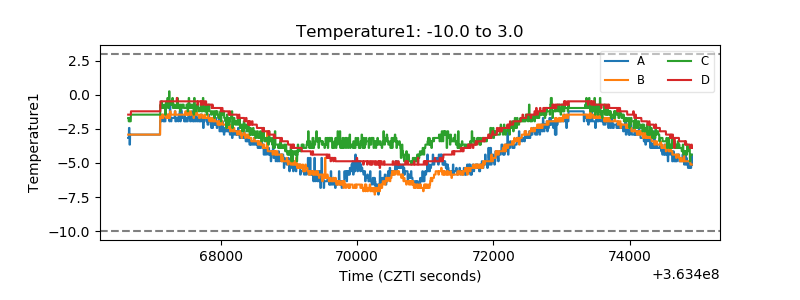 |
| Veto HV Monitor | 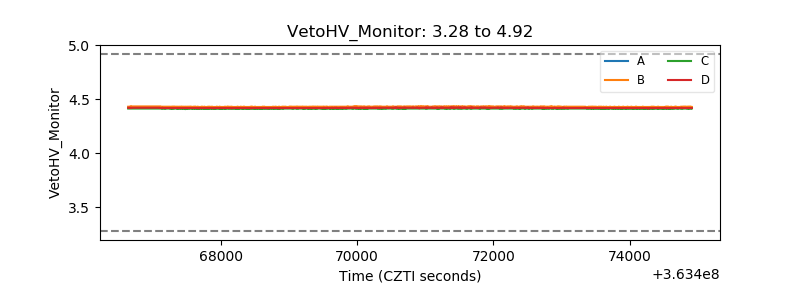 |
| Veto LLD | 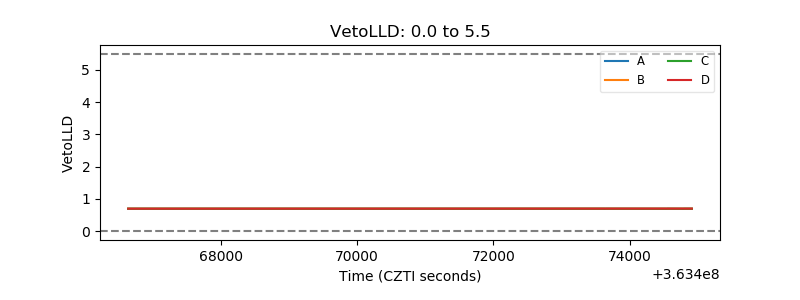 |
| Alpha Counter | 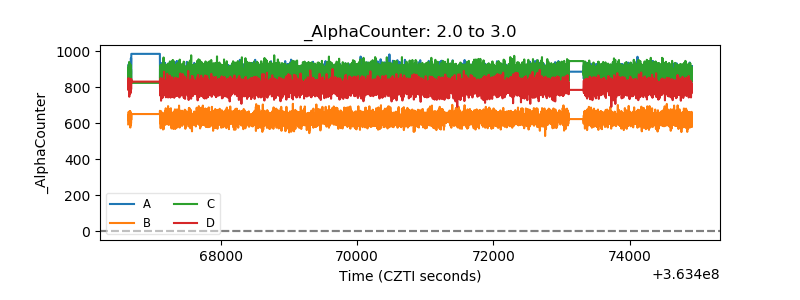 |
| _CPM_Rate | 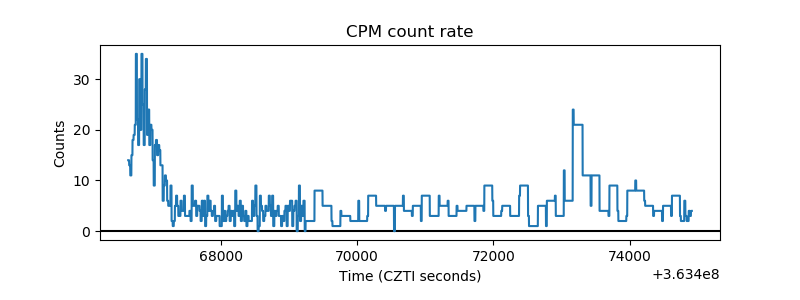 |
| CZT Counter | 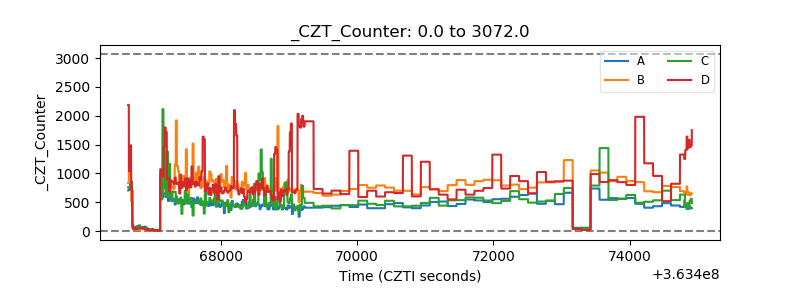 |
| +2.5 Volts monitor |  |
| +5 Volts monitor |  |
| _ROLL_ROT | 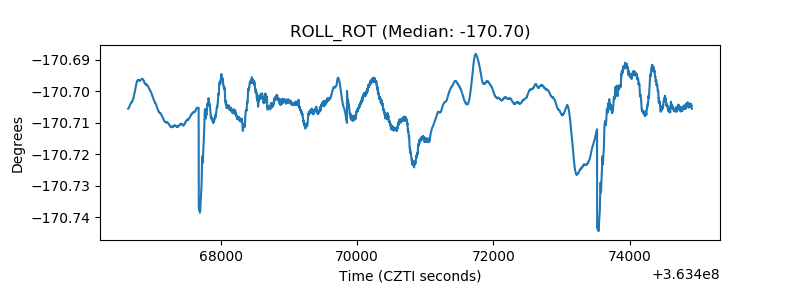 |
| _Roll_DEC | 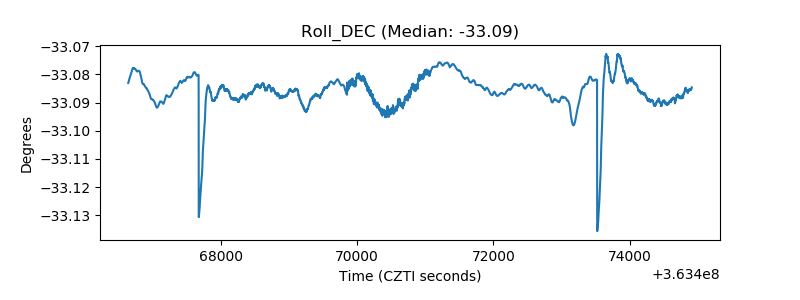 |
| _Roll_RA | 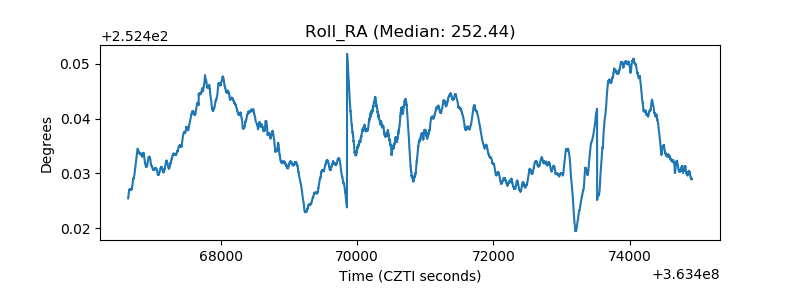 |
| Veto Counter | 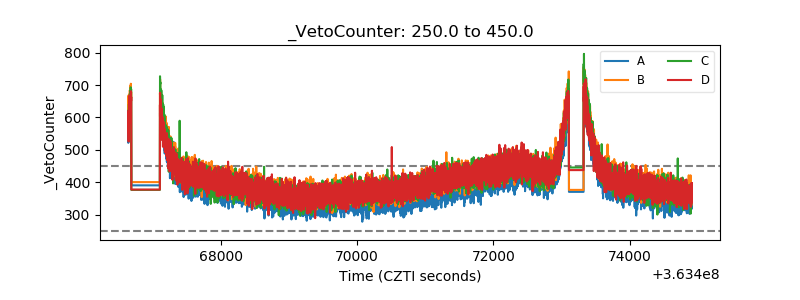 |