| Param | Original file | Final file |
|---|---|---|
| Filename | modeM0/AS1A10_073T02_9000004522_31243cztM0_level2.evt | modeM0/AS1A10_073T02_9000004522_31243cztM0_level2_quad_clean.evt |
| Size (bytes) | 735,367,680 | 115,819,200 |
| Size | 701.3 MB | 110.5 MB |
| Events in quadrant A | 3,789,919 | 766,971 |
| Events in quadrant B | 6,513,485 | 753,665 |
| Events in quadrant C | 4,400,685 | 725,683 |
| Events in quadrant D | 7,030,612 | 709,200 |
| Mode M9 | |||
|---|---|---|---|
| Quadrant | BADHDUFLAG | Total packets | Discarded packets |
| A | 0 | 6 | 0 |
| B | 0 | 6 | 0 |
| C | 0 | 6 | 0 |
| D | 0 | 6 | 0 |
| Mode SS | |||
|---|---|---|---|
| Quadrant | BADHDUFLAG | Total packets | Discarded packets |
| A | 0 | 164 | 0 |
| B | 0 | 164 | 0 |
| C | 0 | 164 | 0 |
| D | 0 | 164 | 0 |
| Mode M0 | |||
|---|---|---|---|
| Quadrant | BADHDUFLAG | Total packets | Discarded packets |
| A | 0 | 16489 | 2 |
| B | 0 | 25136 | 2 |
| C | 0 | 18096 | 2 |
| D | 0 | 26757 | 2 |
| Quadrant | Total seconds | Saturated seconds | Saturation percentage |
|---|---|---|---|
| A | 7936 | 61 | 0.768649% |
| B | 7936 | 325 | 4.095262% |
| C | 7937 | 219 | 2.759229% |
| D | 7937 | 119 | 1.499307% |
Noise dominated data is calculated using 1-second bins in cleaned event files. If a bin has >2000 counts, and if more than 50% of those come from <1% of pixels, then it is considered to be noise-dominated and hence unusable.
| Quadrant | # 1 sec bins | Bins with >0 counts | Bins with >2000 counts | High rate bins dominated by noise | Noise dominated (total time) | Noise dominated (detector-on time) | Marked lightcurve |
|---|---|---|---|---|---|---|---|
| A | 8586 | 7938 | 0 | 0 | 0.00% | 0.00% | 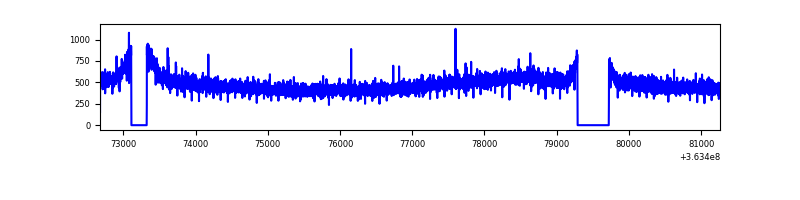 |
| B | 8586 | 7938 | 97 | 97 | 1.13% | 1.22% | 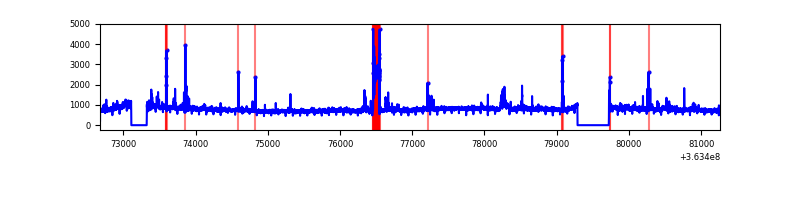 |
| C | 8587 | 7939 | 35 | 35 | 0.41% | 0.44% | 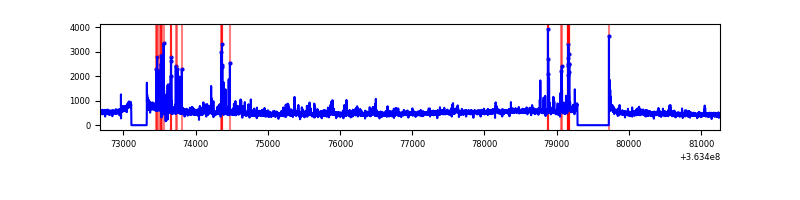 |
| D | 8587 | 7939 | 30 | 30 | 0.35% | 0.38% | 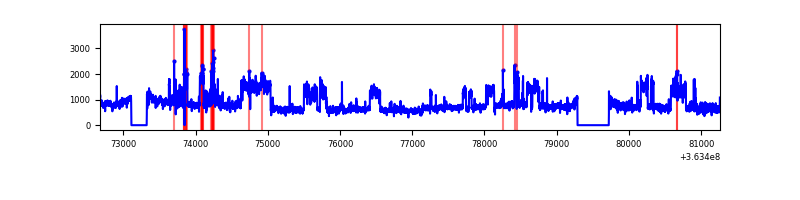 |
Top three noisy pixels from each quadrant. If the there are fewer than three noisy pixels in the level2.evt file, extra rows are filled as -1
| Pixel properties | Quadrant properties | ||||||
|---|---|---|---|---|---|---|---|
| Quadrant | DetID | PixID | Counts | Sigma | Mean | Median | Sigma |
| A | 13 | 254 | 14227 | 66.92 | 981 | 960 | 198.3 |
| A | 3 | 137 | 10270 | 46.96 | 981 | 960 | 198.3 |
| A | 0 | 226 | 8285 | 36.95 | 981 | 960 | 198.3 |
| B | 6 | 159 | 2205125 | 11892.67 | 957 | 932 | 185.3 |
| B | 4 | 80 | 307953 | 1656.52 | 957 | 932 | 185.3 |
| B | 0 | 190 | 96625 | 516.31 | 957 | 932 | 185.3 |
| C | 3 | 233 | 284177 | 1289.22 | 924 | 927 | 219.7 |
| C | 14 | 238 | 154278 | 697.98 | 924 | 927 | 219.7 |
| C | 15 | 208 | 135257 | 611.41 | 924 | 927 | 219.7 |
| D | 8 | 195 | 3306271 | 13629.38 | 929 | 908 | 242.5 |
| D | 12 | 79 | 80953 | 330.06 | 929 | 908 | 242.5 |
| D | 2 | 250 | 41495 | 167.36 | 929 | 908 | 242.5 |
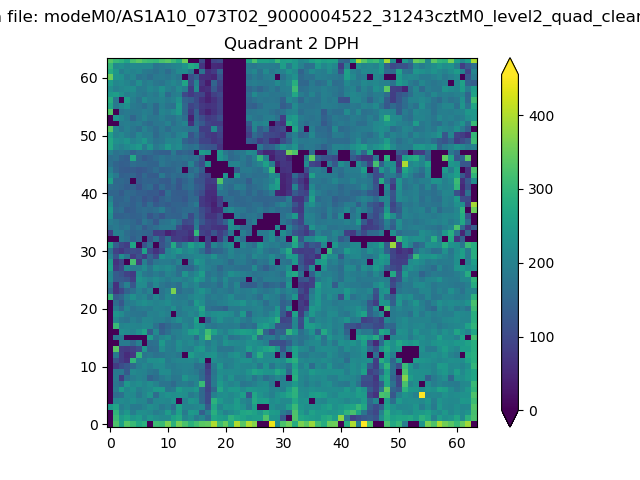
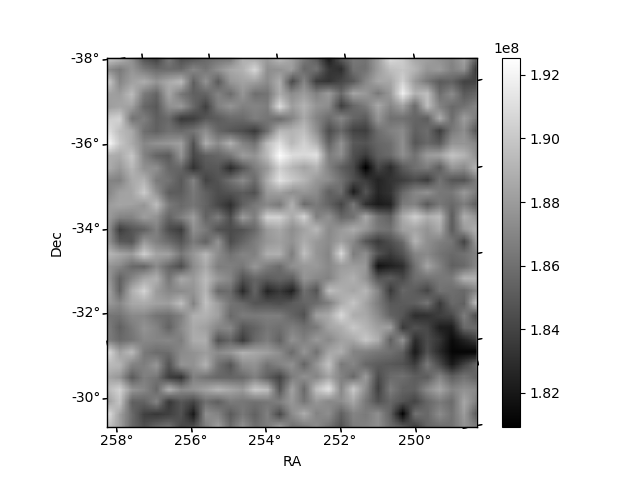
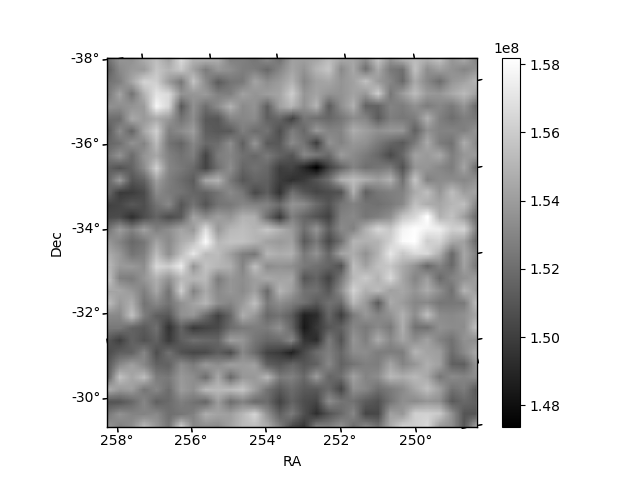
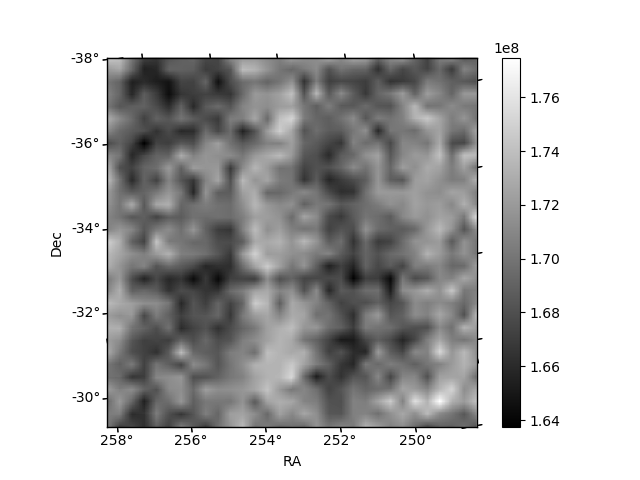
Histogram calculated using DETX and DETY for each event in the final _common_clean file
| Quadrant A | 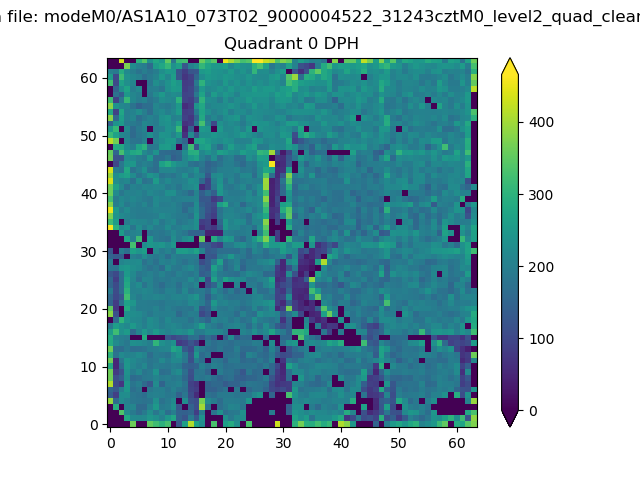 |
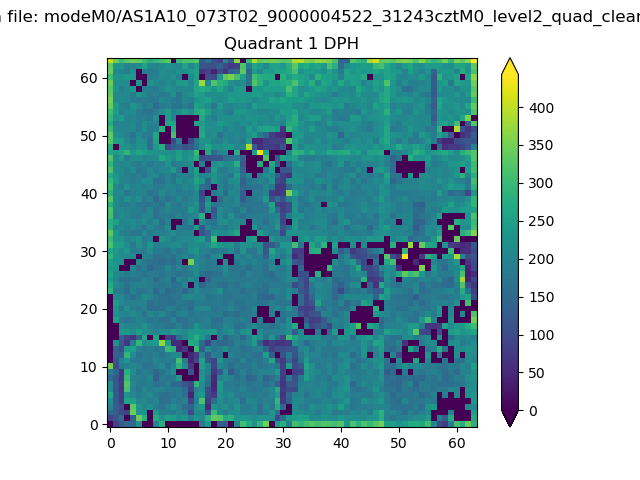 |
Quadrant B |
|---|---|---|---|
| Quadrant D | 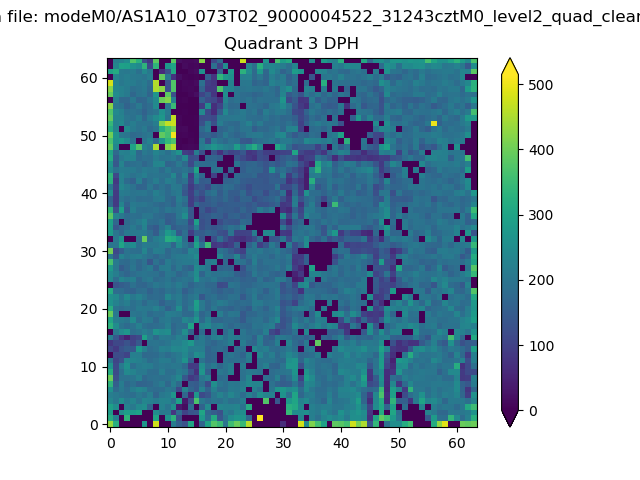 |
 |
Quadrant C |
| Plot type | Count rate plots | Images |
|---|---|---|
| Comparison with Poisson distribution Blue bars denote a histogram of data divided into 1 sec bins. Red curve is a Poisson curve with rate = median count rate of data. |
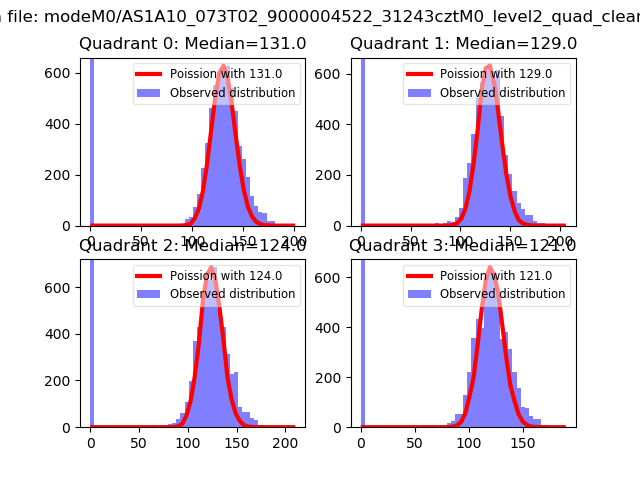 |
 |
| Quadrant-wise count rates Data is divided into 100 sec bins |
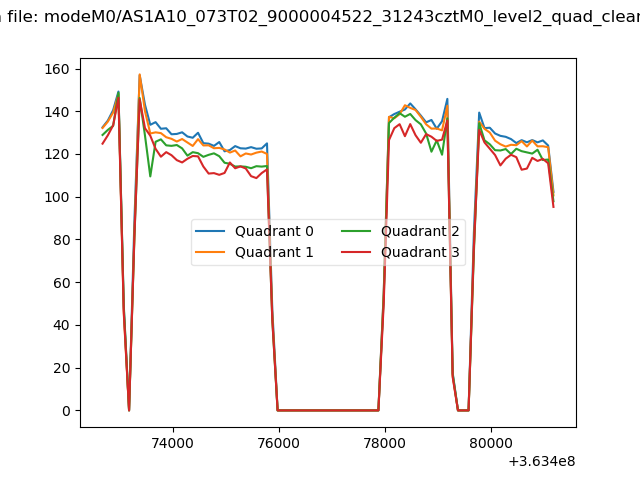 |
|
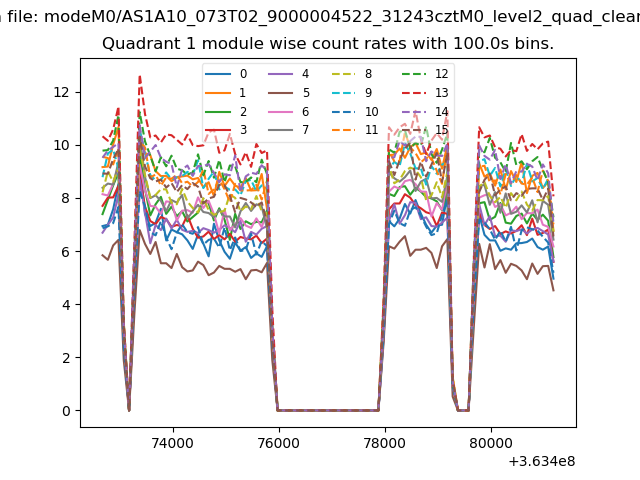
| Module-wise count rates for Quadrant A Data is divided into 100 sec bins |
 |
 |
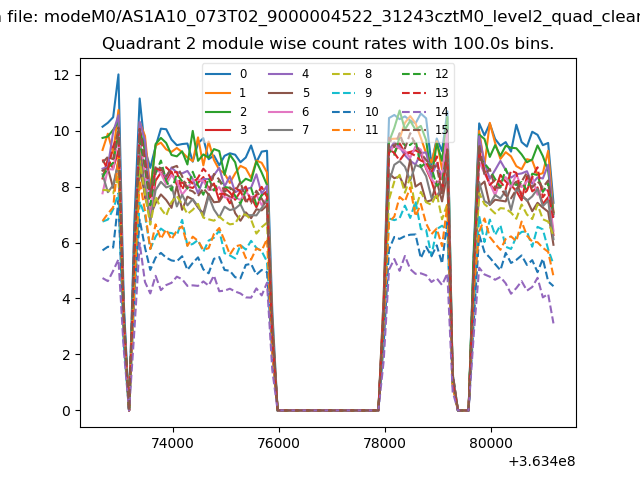
| Module-wise count rates for Quadrant B Data is divided into 100 sec bins |
 |
 |
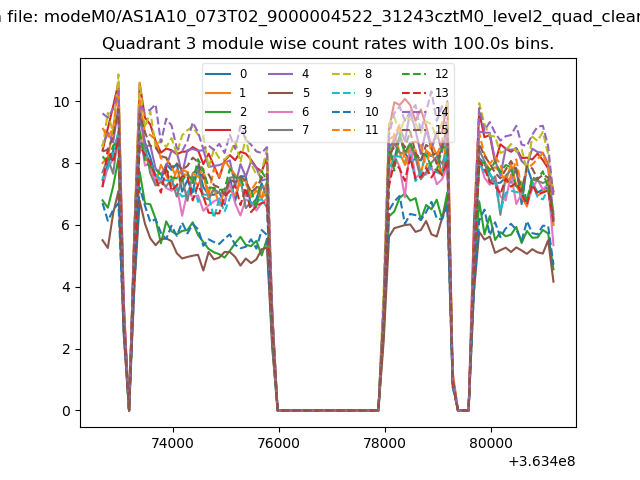
| Module-wise count rates for Quadrant C Data is divided into 100 sec bins |
 |
 |
| Module-wise count rates for Quadrant D Data is divided into 100 sec bins |
 |
 |
| Parameter | Plot |
|---|---|
| CZT HV Monitor | 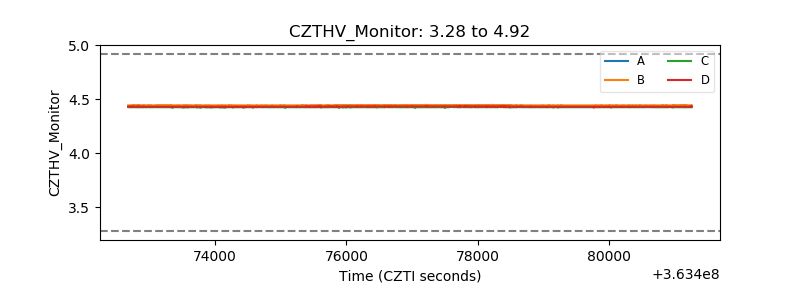 |
| D_VDD | 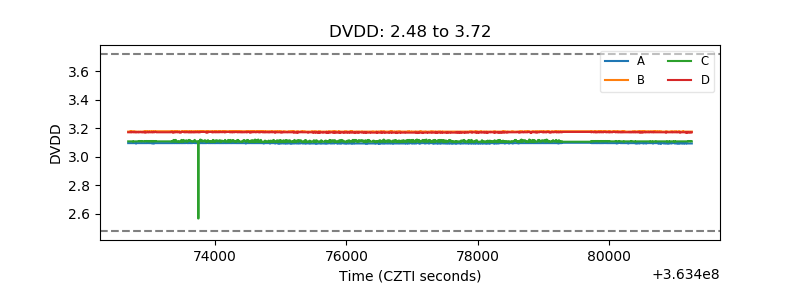 |
| Temperature 1 |  |
| Veto HV Monitor | 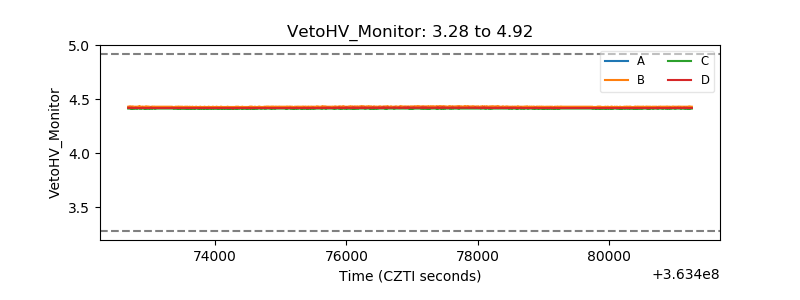 |
| Veto LLD |  |
| Alpha Counter | 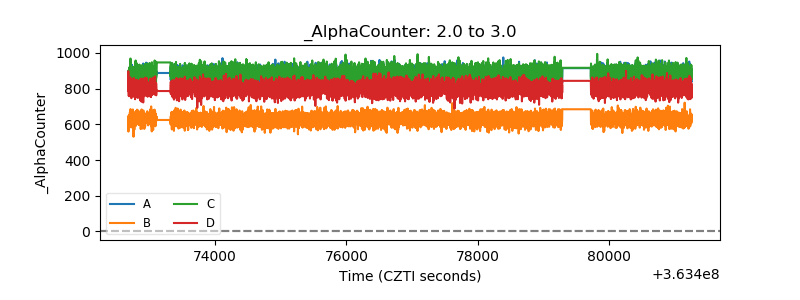 |
| _CPM_Rate | 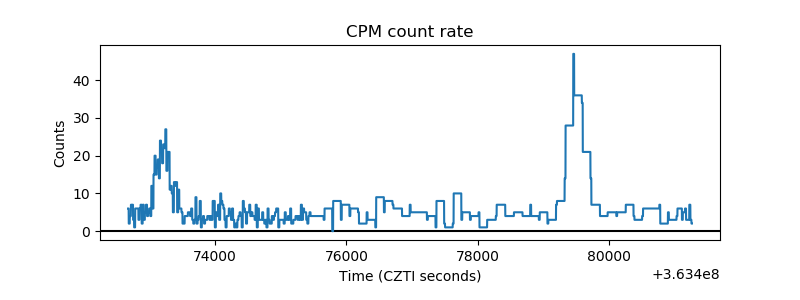 |
| CZT Counter | 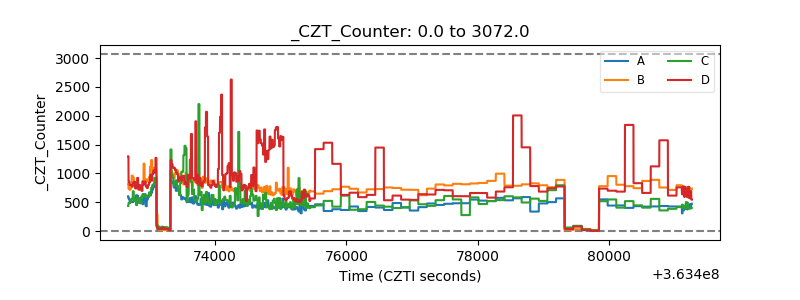 |
| +2.5 Volts monitor |  |
| +5 Volts monitor |  |
| _ROLL_ROT |  |
| _Roll_DEC | 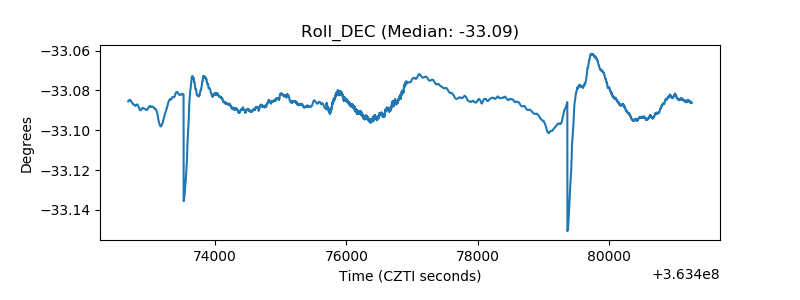 |
| _Roll_RA | 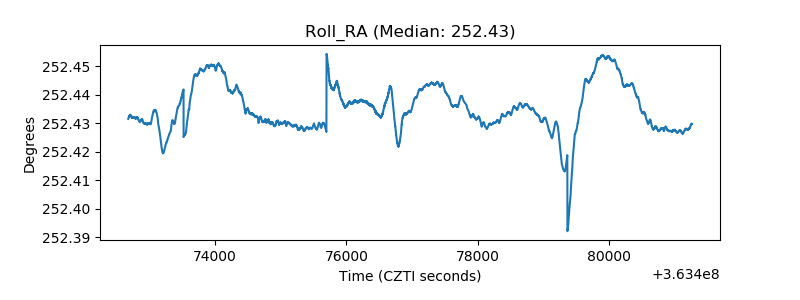 |
| Veto Counter | 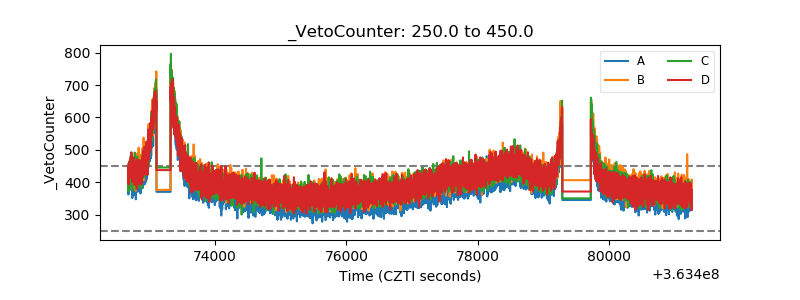 |