| Param | Original file | Final file |
|---|---|---|
| Filename | modeM0/AS1A10_073T02_9000004522_31245cztM0_level2.evt | modeM0/AS1A10_073T02_9000004522_31245cztM0_level2_quad_clean.evt |
| Size (bytes) | 804,597,120 | 97,174,080 |
| Size | 767.3 MB | 92.7 MB |
| Events in quadrant A | 3,517,416 | 649,314 |
| Events in quadrant B | 6,254,055 | 631,699 |
| Events in quadrant C | 3,810,368 | 618,218 |
| Events in quadrant D | 10,264,753 | 506,210 |
| Mode M9 | |||
|---|---|---|---|
| Quadrant | BADHDUFLAG | Total packets | Discarded packets |
| A | 0 | 5 | 0 |
| B | 0 | 5 | 0 |
| C | 0 | 5 | 0 |
| D | 0 | 5 | 0 |
| Mode SS | |||
|---|---|---|---|
| Quadrant | BADHDUFLAG | Total packets | Discarded packets |
| A | 0 | 156 | 0 |
| B | 0 | 156 | 0 |
| C | 0 | 156 | 0 |
| D | 0 | 156 | 0 |
| Mode M0 | |||
|---|---|---|---|
| Quadrant | BADHDUFLAG | Total packets | Discarded packets |
| A | 0 | 15642 | 1 |
| B | 0 | 24257 | 1 |
| C | 0 | 16314 | 1 |
| D | 0 | 35977 | 1 |
| Quadrant | Total seconds | Saturated seconds | Saturation percentage |
|---|---|---|---|
| A | 7706 | 17 | 0.220607% |
| B | 7706 | 213 | 2.764080% |
| C | 7707 | 83 | 1.076943% |
| D | 7707 | 2126 | 27.585312% |
Noise dominated data is calculated using 1-second bins in cleaned event files. If a bin has >2000 counts, and if more than 50% of those come from <1% of pixels, then it is considered to be noise-dominated and hence unusable.
| Quadrant | # 1 sec bins | Bins with >0 counts | Bins with >2000 counts | High rate bins dominated by noise | Noise dominated (total time) | Noise dominated (detector-on time) | Marked lightcurve |
|---|---|---|---|---|---|---|---|
| A | 8281 | 7707 | 0 | 0 | 0.00% | 0.00% | 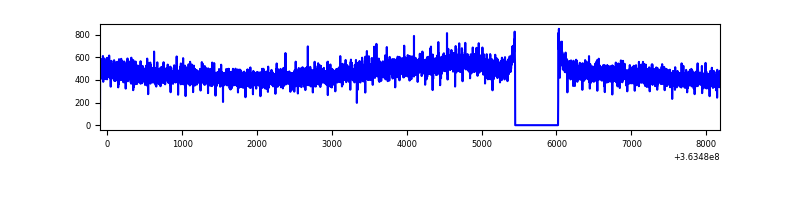 |
| B | 8281 | 7707 | 91 | 91 | 1.10% | 1.18% | 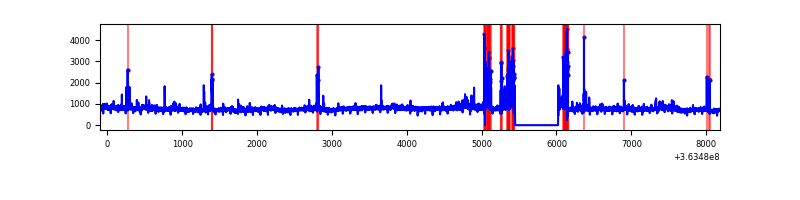 |
| C | 8282 | 7708 | 6 | 6 | 0.07% | 0.08% | 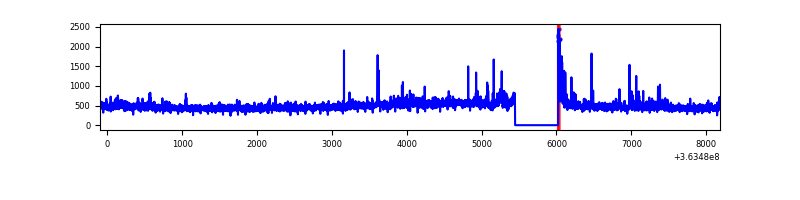 |
| D | 8282 | 7708 | 2081 | 2081 | 25.13% | 27.00% | 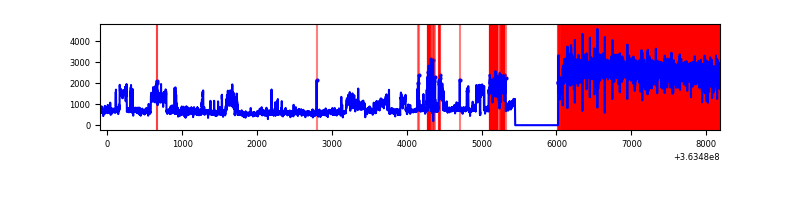 |
Top three noisy pixels from each quadrant. If the there are fewer than three noisy pixels in the level2.evt file, extra rows are filled as -1
| Pixel properties | Quadrant properties | ||||||
|---|---|---|---|---|---|---|---|
| Quadrant | DetID | PixID | Counts | Sigma | Mean | Median | Sigma |
| A | 13 | 254 | 14865 | 75.46 | 907 | 888 | 185.2 |
| A | 0 | 207 | 14122 | 71.45 | 907 | 888 | 185.2 |
| A | 3 | 137 | 9249 | 45.14 | 907 | 888 | 185.2 |
| B | 6 | 159 | 2200311 | 12804.94 | 890 | 866 | 171.8 |
| B | 0 | 190 | 323772 | 1879.93 | 890 | 866 | 171.8 |
| B | 4 | 80 | 139551 | 807.41 | 890 | 866 | 171.8 |
| C | 3 | 233 | 201060 | 974.61 | 863 | 868 | 205.4 |
| C | 14 | 238 | 139122 | 673.07 | 863 | 868 | 205.4 |
| C | 0 | 10 | 56511 | 270.89 | 863 | 868 | 205.4 |
| D | 8 | 195 | 7079112 | 34315.68 | 776 | 760 | 206.3 |
| D | 2 | 250 | 133993 | 645.91 | 776 | 760 | 206.3 |
| D | 12 | 233 | 69279 | 332.18 | 776 | 760 | 206.3 |
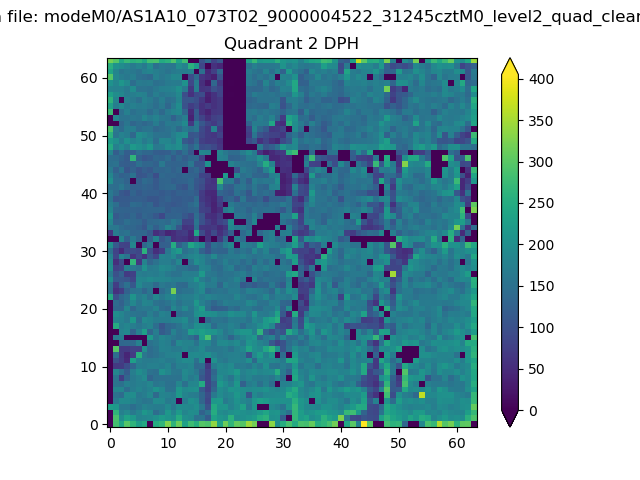
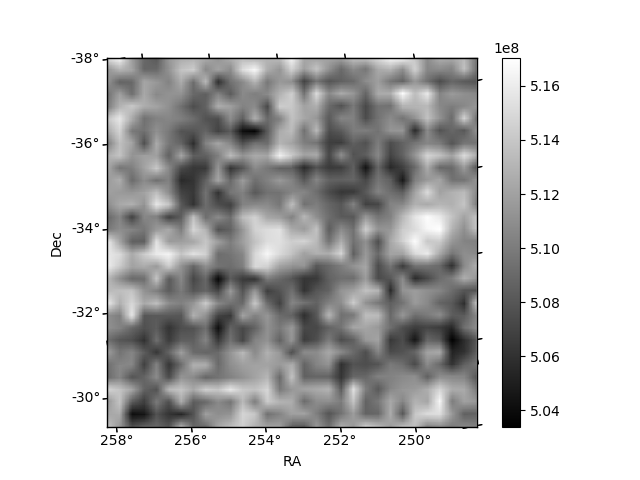
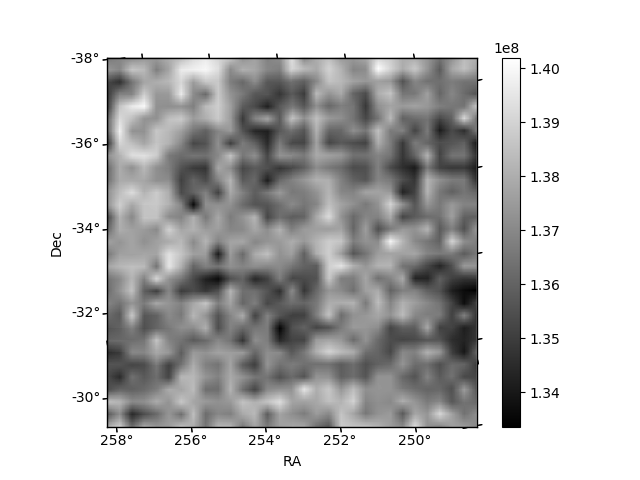
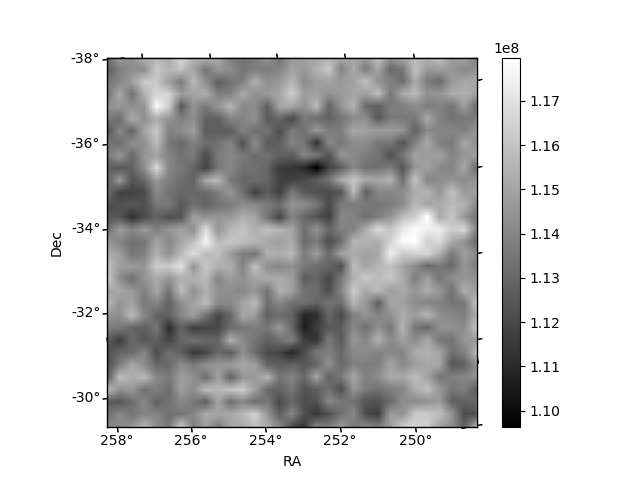
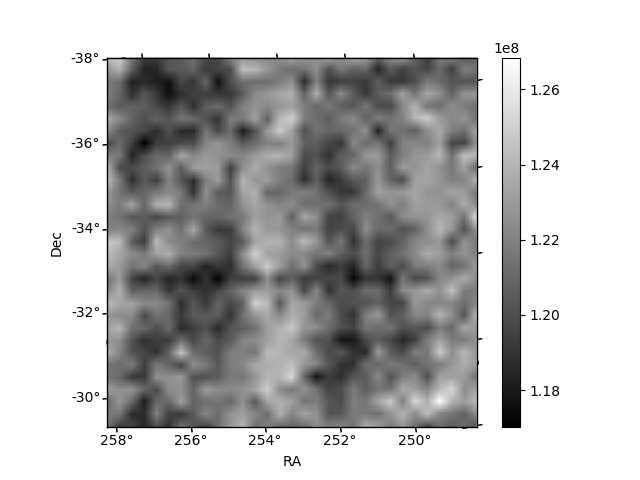
Histogram calculated using DETX and DETY for each event in the final _common_clean file
| Quadrant A | 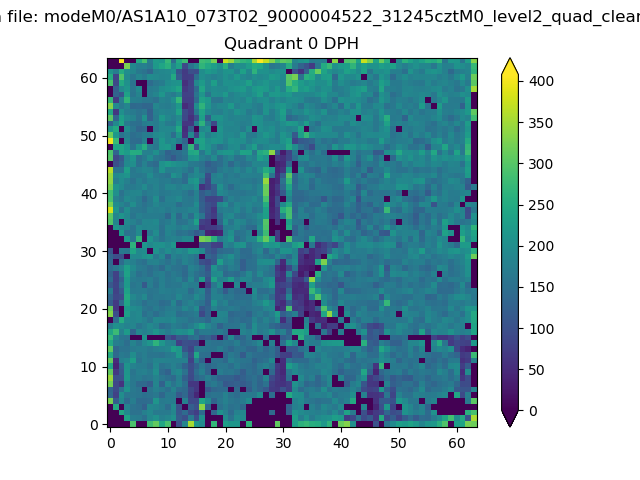 |
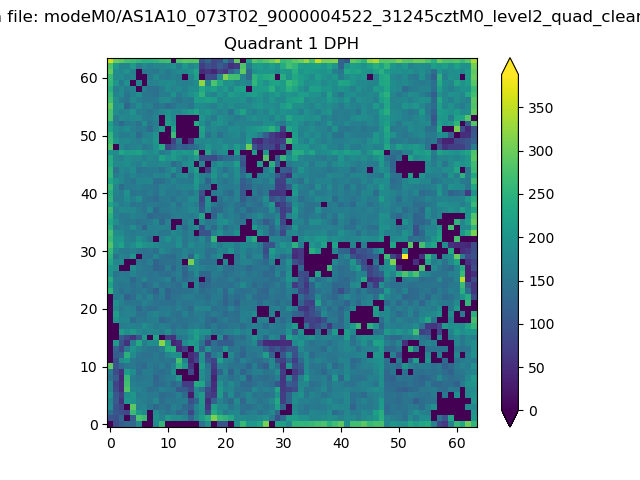 |
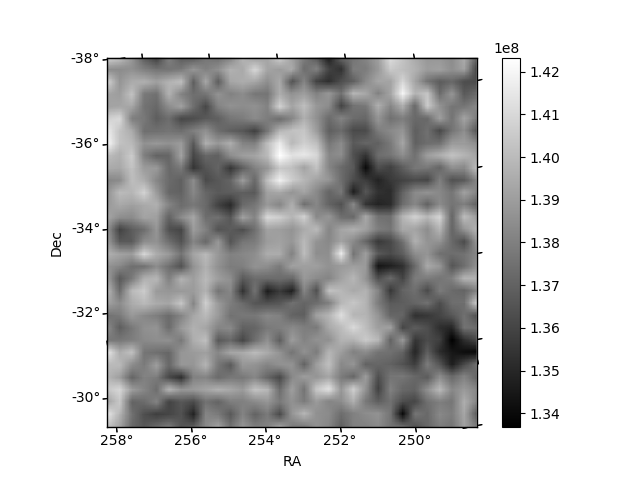
Quadrant B |
|---|---|---|---|
| Quadrant D | 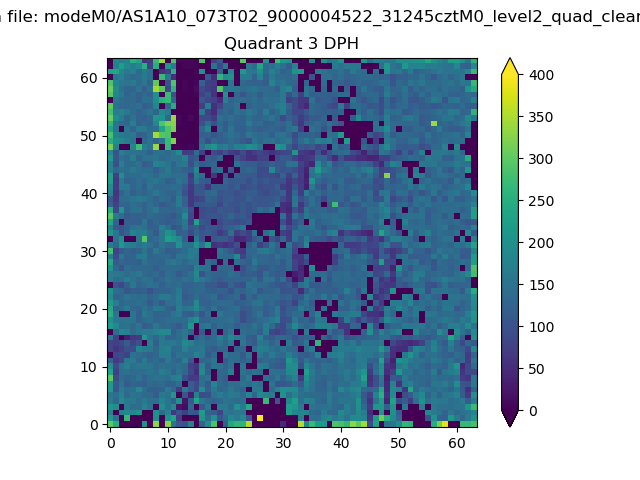 |
 |
Quadrant C |
| Plot type | Count rate plots | Images |
|---|---|---|
| Comparison with Poisson distribution Blue bars denote a histogram of data divided into 1 sec bins. Red curve is a Poisson curve with rate = median count rate of data. |
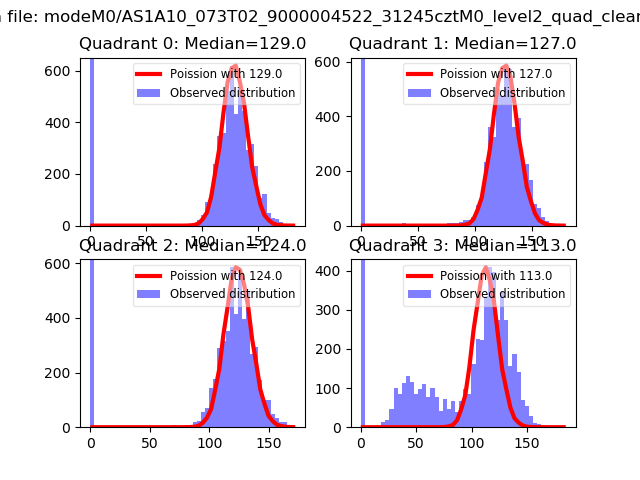 |
 |
| Quadrant-wise count rates Data is divided into 100 sec bins |
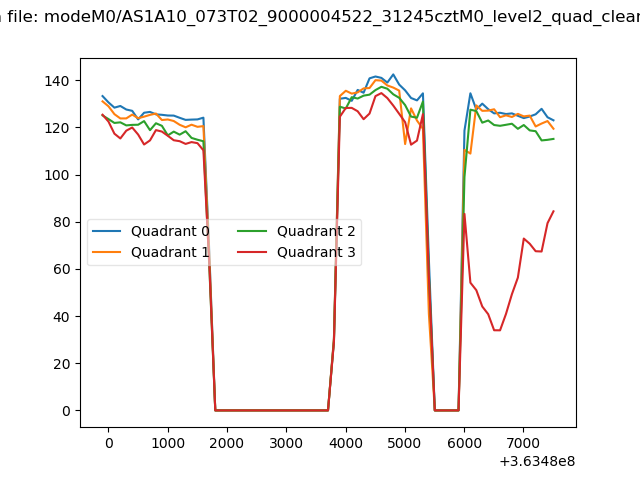 |
|
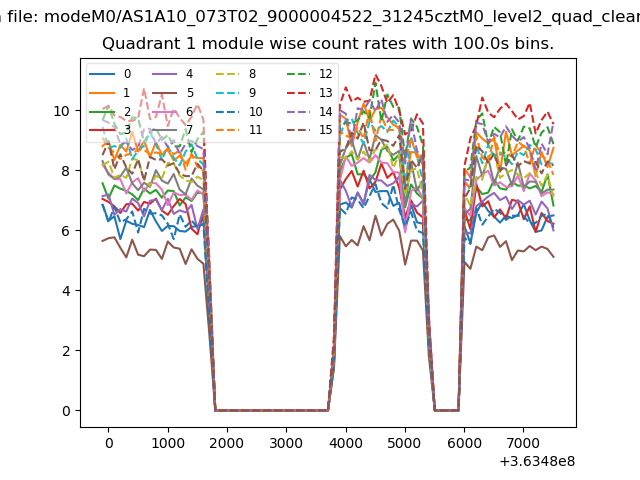
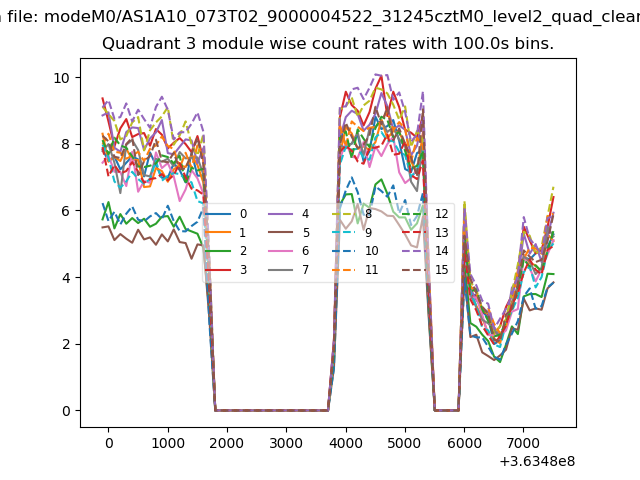
| Module-wise count rates for Quadrant A Data is divided into 100 sec bins |
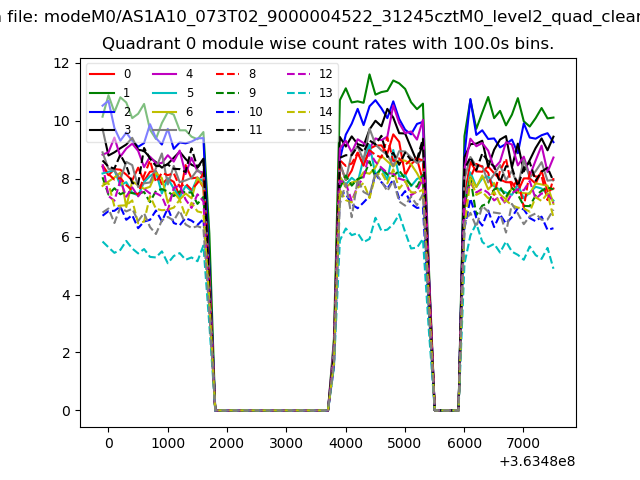 |
 |
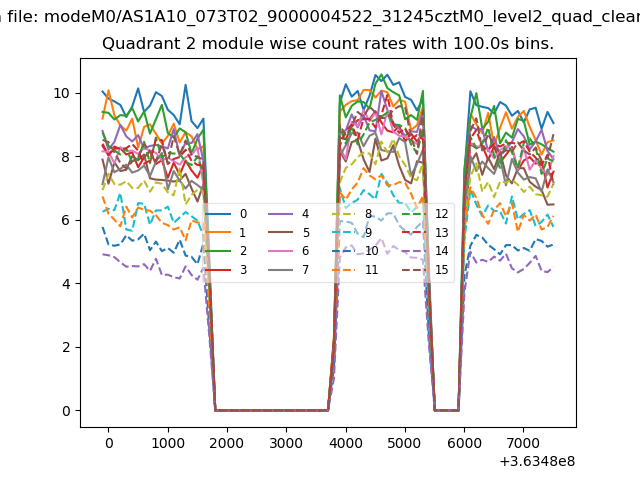
| Module-wise count rates for Quadrant B Data is divided into 100 sec bins |
 |
 |
| Module-wise count rates for Quadrant C Data is divided into 100 sec bins |
 |
 |
| Module-wise count rates for Quadrant D Data is divided into 100 sec bins |
 |
 |
| Parameter | Plot |
|---|---|
| CZT HV Monitor | 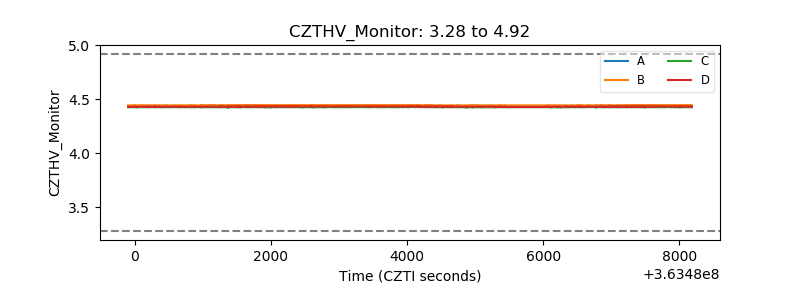 |
| D_VDD | 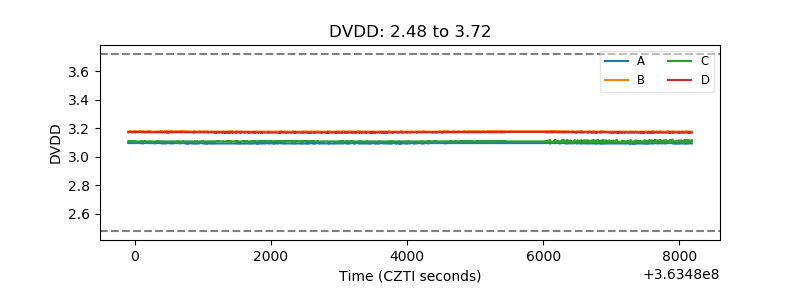 |
| Temperature 1 |  |
| Veto HV Monitor | 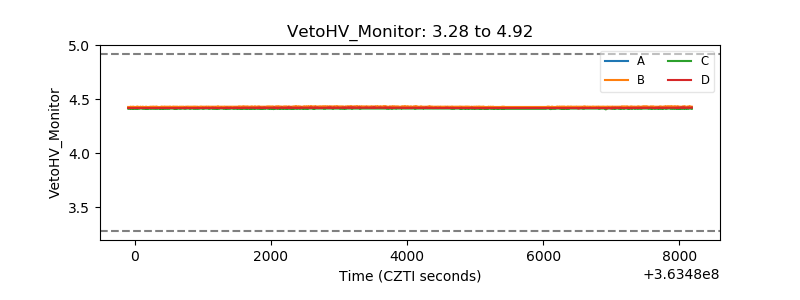 |
| Veto LLD | 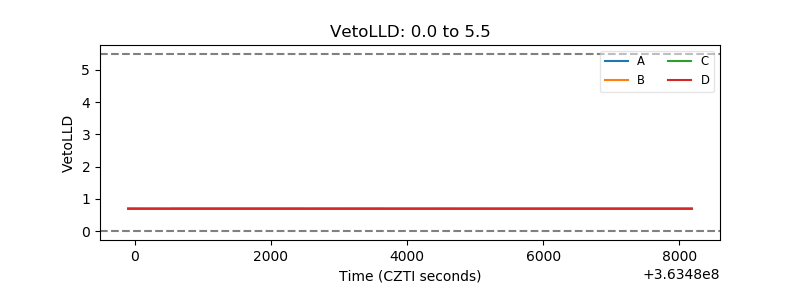 |
| Alpha Counter | 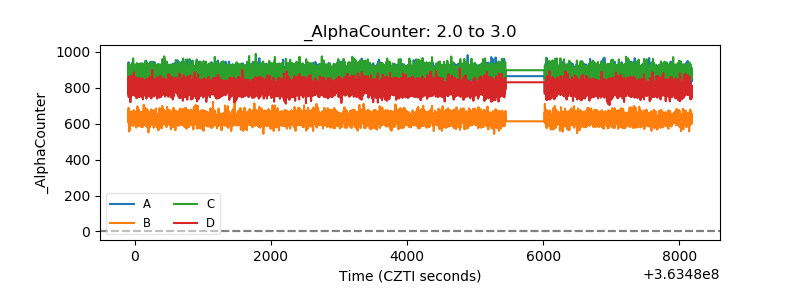 |
| _CPM_Rate | 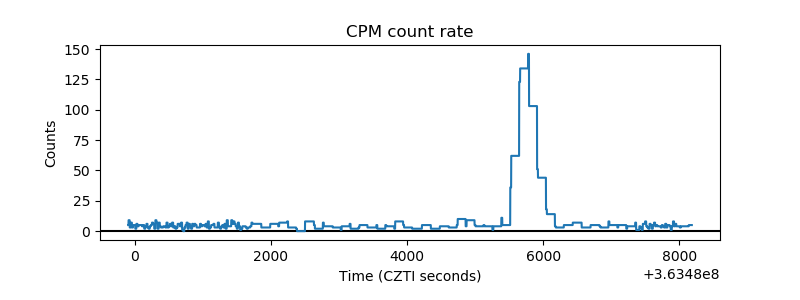 |
| CZT Counter | 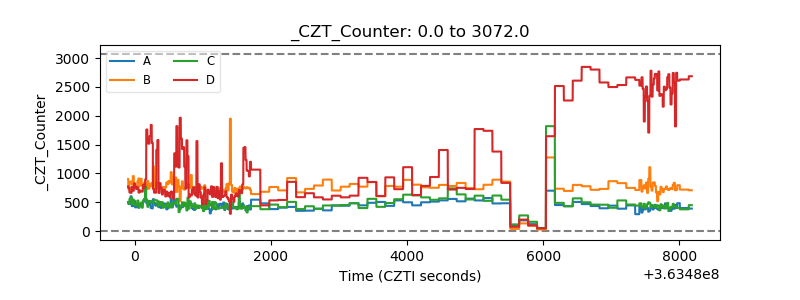 |
| +2.5 Volts monitor |  |
| +5 Volts monitor | 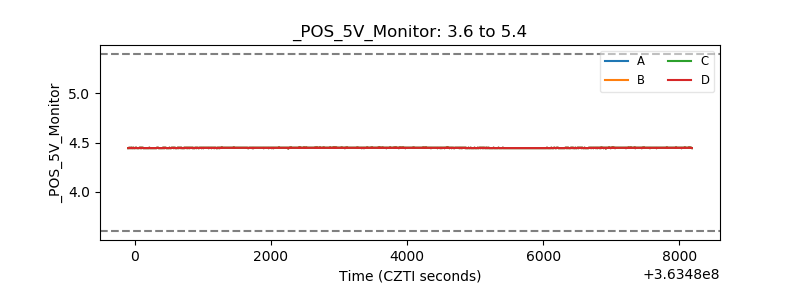 |
| _ROLL_ROT | 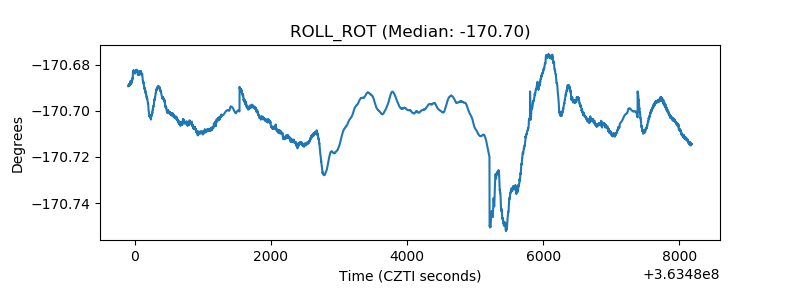 |
| _Roll_DEC | 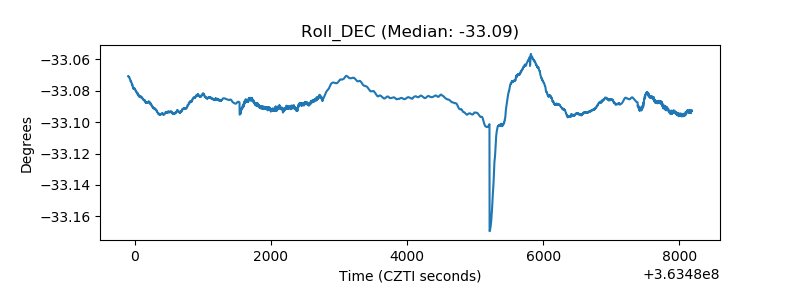 |
| _Roll_RA | 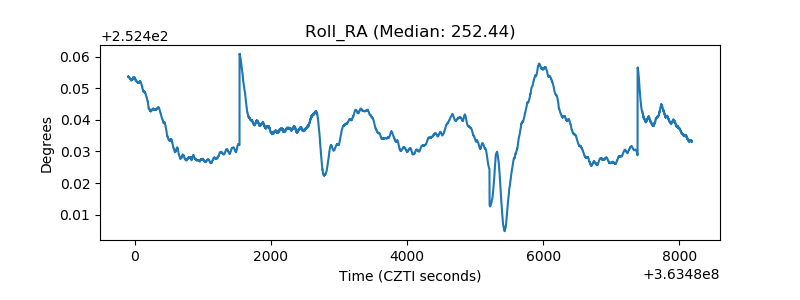 |
| Veto Counter |  |