| Param | Original file | Final file |
|---|---|---|
| Filename | modeM0/AS1A10_073T02_9000004522_31246cztM0_level2.evt | modeM0/AS1A10_073T02_9000004522_31246cztM0_level2_quad_clean.evt |
| Size (bytes) | 1,137,407,040 | 116,760,960 |
| Size | 1.1 GB | 111.4 MB |
| Events in quadrant A | 4,878,353 | 773,844 |
| Events in quadrant B | 8,242,816 | 770,451 |
| Events in quadrant C | 5,656,085 | 744,044 |
| Events in quadrant D | 14,974,311 | 531,444 |
| Mode M9 | |||
|---|---|---|---|
| Quadrant | BADHDUFLAG | Total packets | Discarded packets |
| A | 0 | 17 | 0 |
| B | 0 | 17 | 0 |
| C | 0 | 17 | 0 |
| D | 0 | 17 | 0 |
| Mode SS | |||
|---|---|---|---|
| Quadrant | BADHDUFLAG | Total packets | Discarded packets |
| A | 0 | 210 | 0 |
| B | 0 | 210 | 0 |
| C | 0 | 210 | 0 |
| D | 0 | 210 | 0 |
| Mode M0 | |||
|---|---|---|---|
| Quadrant | BADHDUFLAG | Total packets | Discarded packets |
| A | 0 | 20965 | 2 |
| B | 0 | 31850 | 2 |
| C | 0 | 23012 | 2 |
| D | 0 | 51522 | 2 |
| Quadrant | Total seconds | Saturated seconds | Saturation percentage |
|---|---|---|---|
| A | 10320 | 35 | 0.339147% |
| B | 10320 | 131 | 1.269380% |
| C | 10319 | 168 | 1.628065% |
| D | 10320 | 3699 | 35.843023% |
Noise dominated data is calculated using 1-second bins in cleaned event files. If a bin has >2000 counts, and if more than 50% of those come from <1% of pixels, then it is considered to be noise-dominated and hence unusable.
| Quadrant | # 1 sec bins | Bins with >0 counts | Bins with >2000 counts | High rate bins dominated by noise | Noise dominated (total time) | Noise dominated (detector-on time) | Marked lightcurve |
|---|---|---|---|---|---|---|---|
| A | 12000 | 10322 | 0 | 0 | 0.00% | 0.00% | 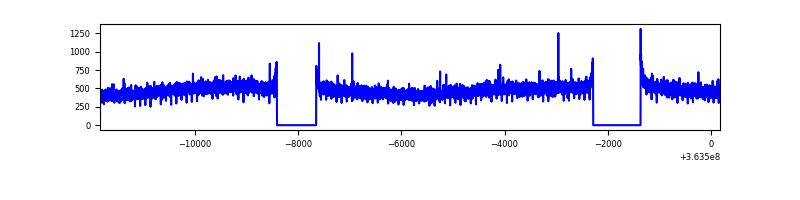 |
| B | 12000 | 10322 | 13 | 13 | 0.11% | 0.13% | 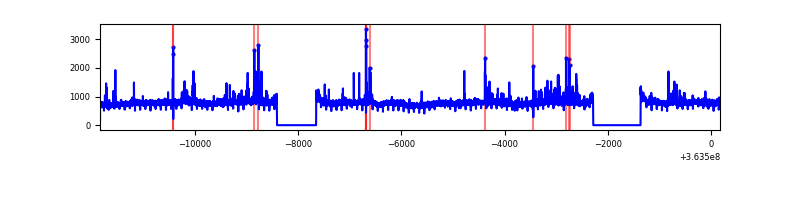 |
| C | 11999 | 10321 | 27 | 27 | 0.23% | 0.26% | 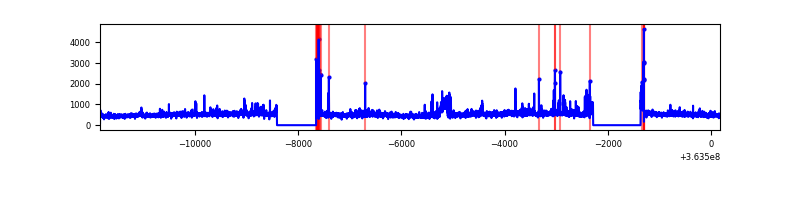 |
| D | 12000 | 10322 | 3557 | 3557 | 29.64% | 34.46% | 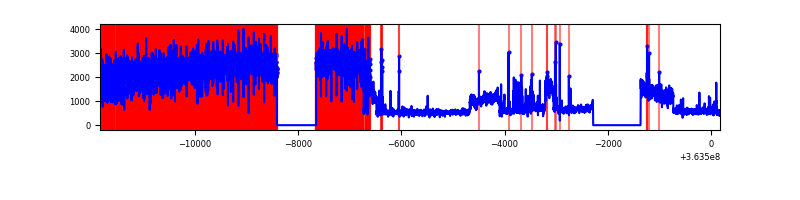 |
Top three noisy pixels from each quadrant. If the there are fewer than three noisy pixels in the level2.evt file, extra rows are filled as -1
| Pixel properties | Quadrant properties | ||||||
|---|---|---|---|---|---|---|---|
| Quadrant | DetID | PixID | Counts | Sigma | Mean | Median | Sigma |
| A | 11 | 47 | 30470 | 116.84 | 1255 | 1231 | 250.2 |
| A | 13 | 254 | 18979 | 70.92 | 1255 | 1231 | 250.2 |
| A | 3 | 137 | 12830 | 46.35 | 1255 | 1231 | 250.2 |
| B | 6 | 159 | 2959128 | 12455.27 | 1240 | 1208 | 237.5 |
| B | 0 | 190 | 216014 | 904.51 | 1240 | 1208 | 237.5 |
| B | 4 | 80 | 110690 | 461.01 | 1240 | 1208 | 237.5 |
| C | 3 | 233 | 514900 | 1806.61 | 1200 | 1204 | 284.3 |
| C | 14 | 238 | 196134 | 685.55 | 1200 | 1204 | 284.3 |
| C | 0 | 10 | 143441 | 500.23 | 1200 | 1204 | 284.3 |
| D | 8 | 195 | 10735842 | 42617.09 | 1016 | 990 | 251.9 |
| D | 2 | 250 | 210367 | 831.22 | 1016 | 990 | 251.9 |
| D | 12 | 233 | 85444 | 335.28 | 1016 | 990 | 251.9 |
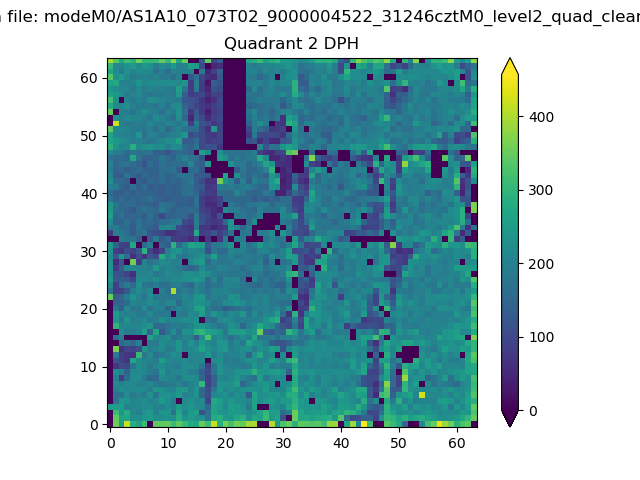
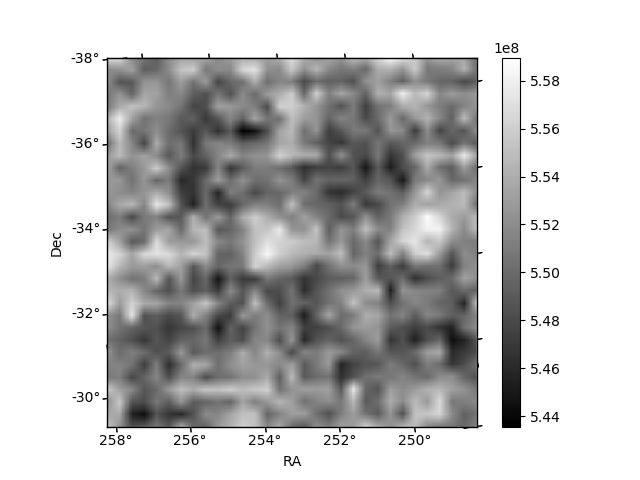
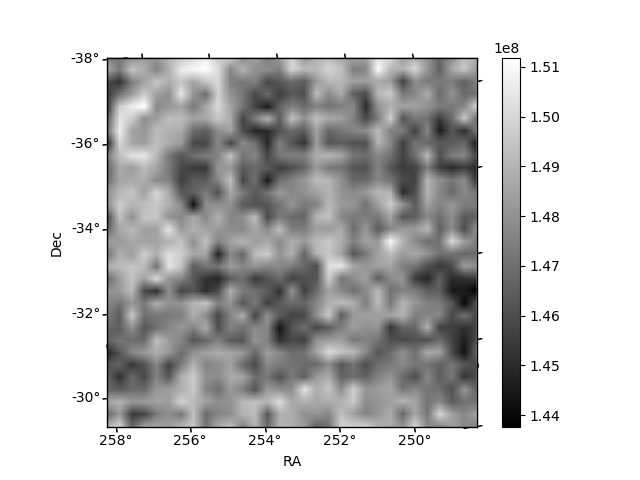
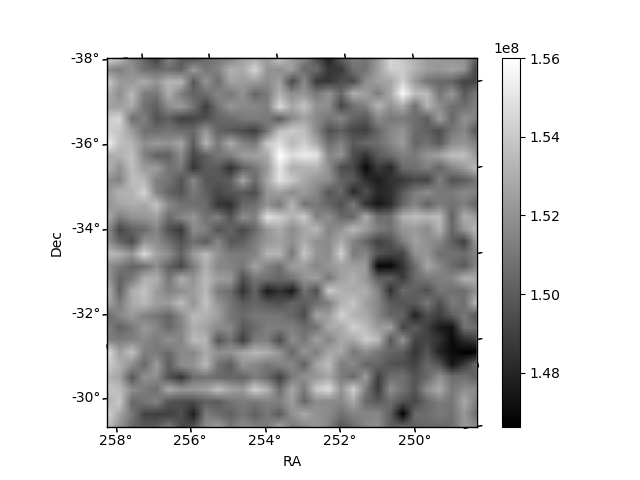
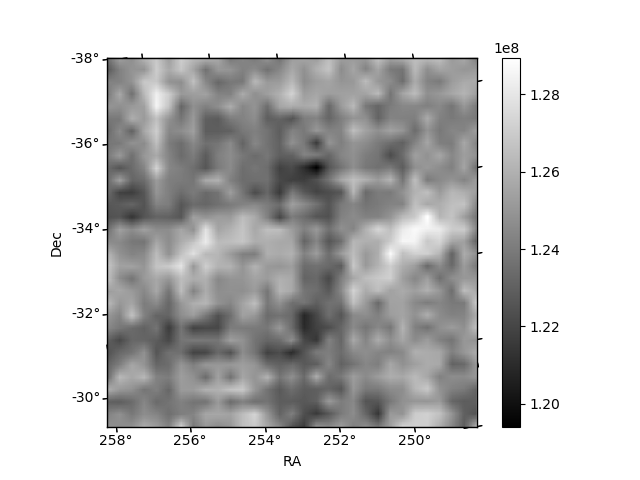
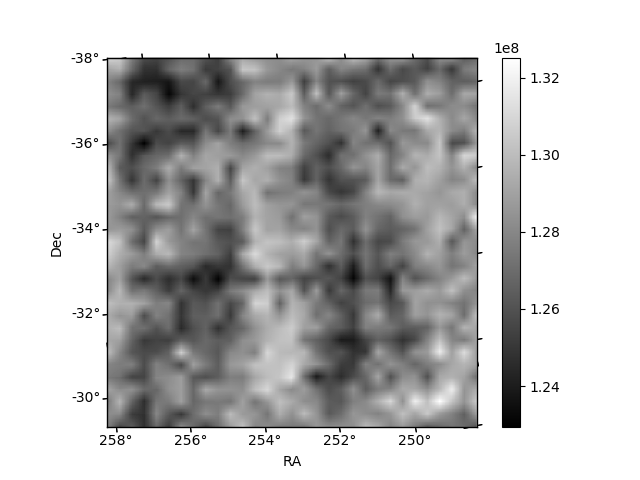
Histogram calculated using DETX and DETY for each event in the final _common_clean file
| Quadrant A | 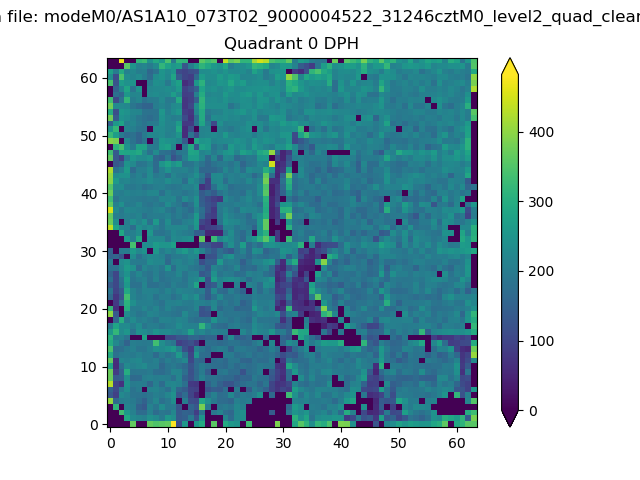 |
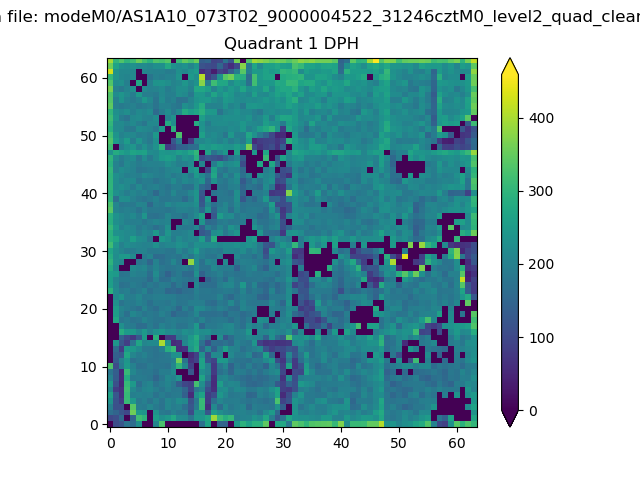 |
Quadrant B |
|---|---|---|---|
| Quadrant D | 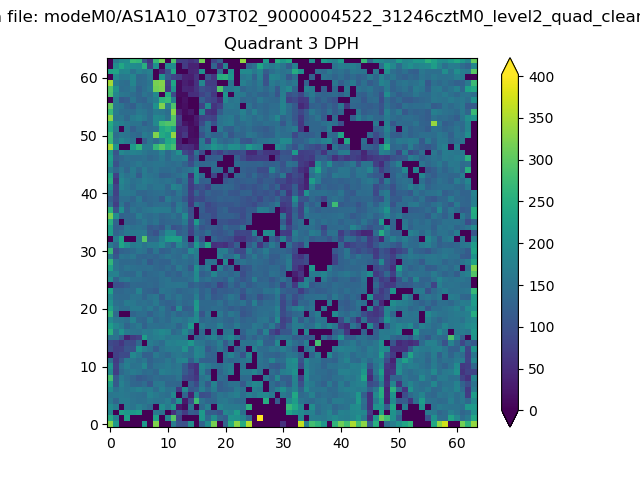 |
 |
Quadrant C |
| Plot type | Count rate plots | Images |
|---|---|---|
| Comparison with Poisson distribution Blue bars denote a histogram of data divided into 1 sec bins. Red curve is a Poisson curve with rate = median count rate of data. |
 |
 |
| Quadrant-wise count rates Data is divided into 100 sec bins |
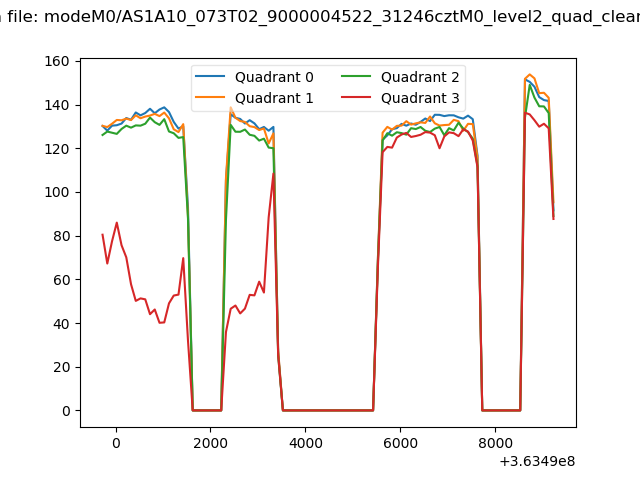 |
|
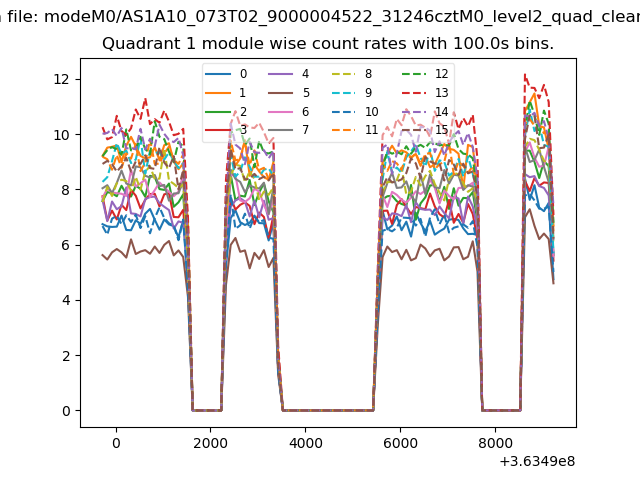
| Module-wise count rates for Quadrant A Data is divided into 100 sec bins |
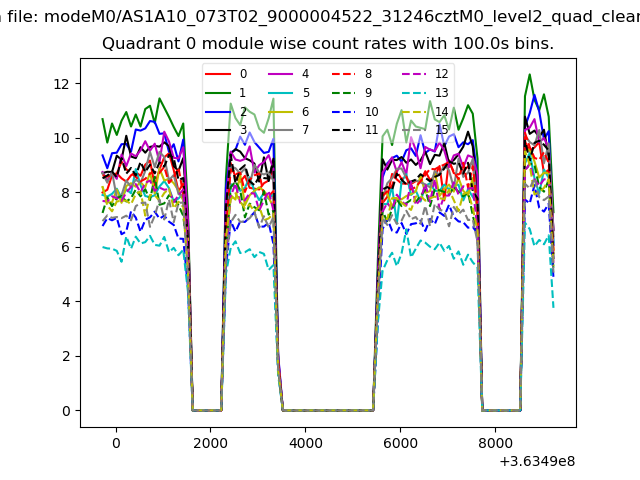 |
 |
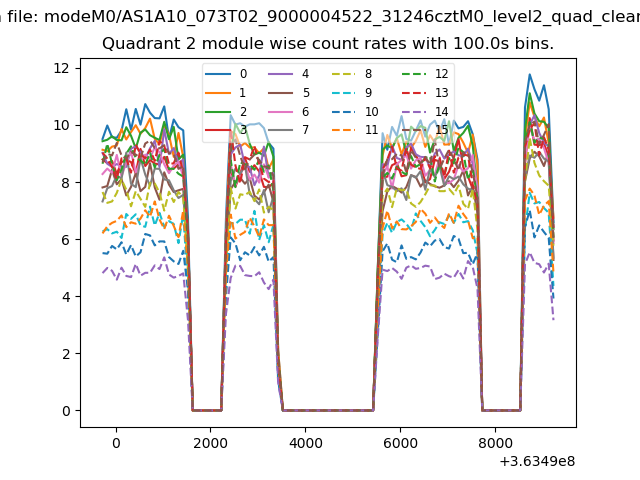
| Module-wise count rates for Quadrant B Data is divided into 100 sec bins |
 |
 |
| Module-wise count rates for Quadrant C Data is divided into 100 sec bins |
 |
 |
| Module-wise count rates for Quadrant D Data is divided into 100 sec bins |
 |
 |
| Parameter | Plot |
|---|---|
| CZT HV Monitor |  |
| D_VDD | 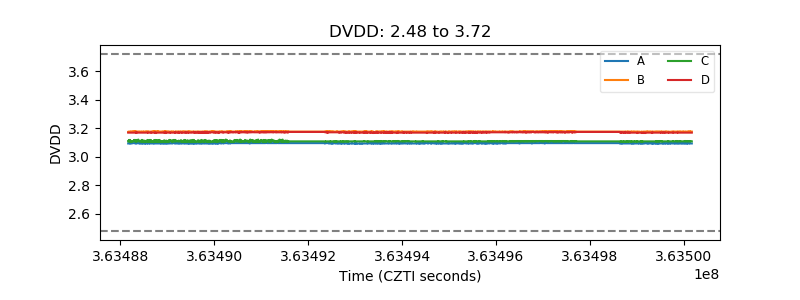 |
| Temperature 1 | 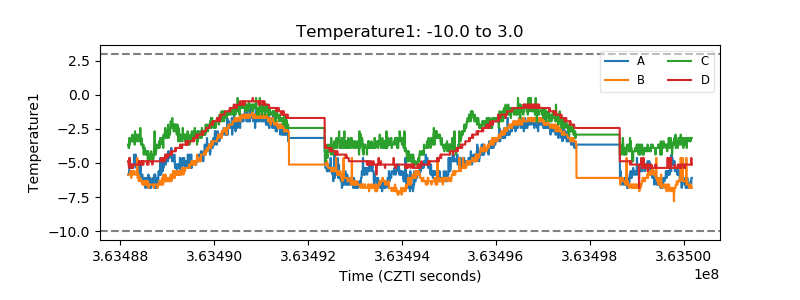 |
| Veto HV Monitor | 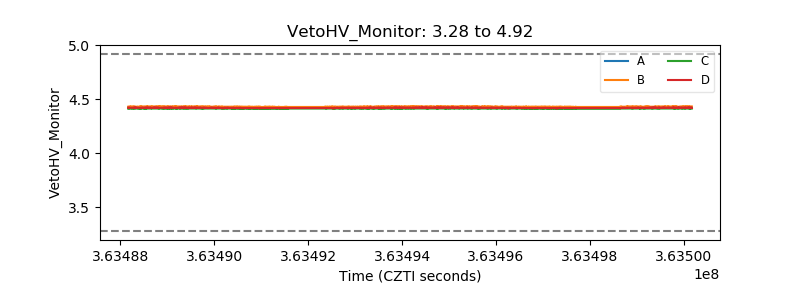 |
| Veto LLD |  |
| Alpha Counter | 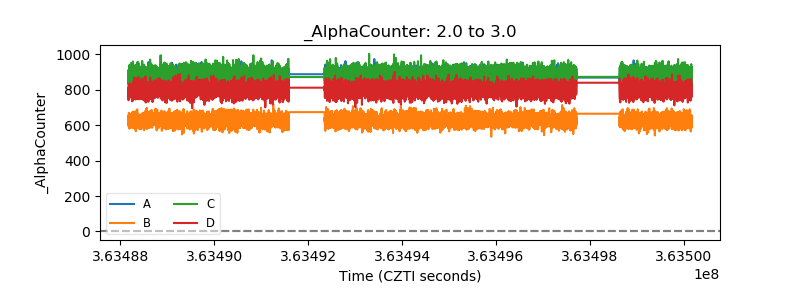 |
| _CPM_Rate | 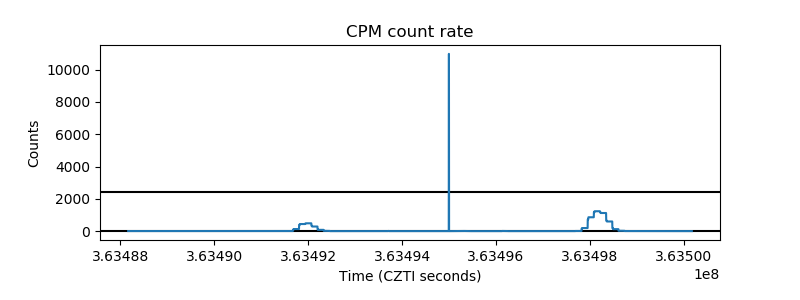 |
| CZT Counter | 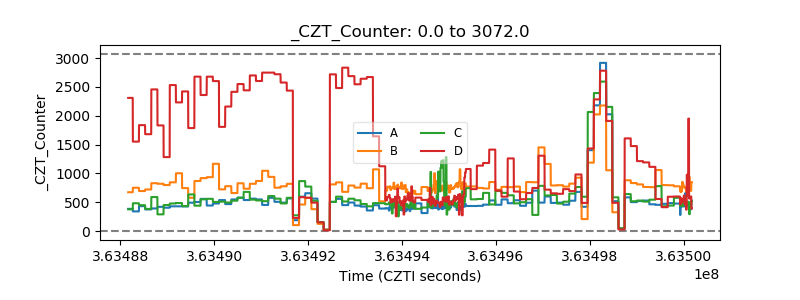 |
| +2.5 Volts monitor |  |
| +5 Volts monitor | 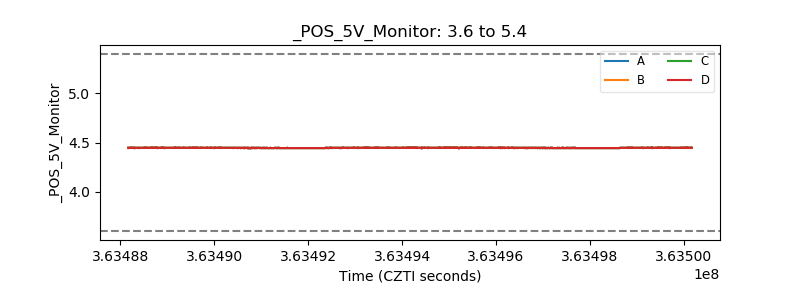 |
| _ROLL_ROT | 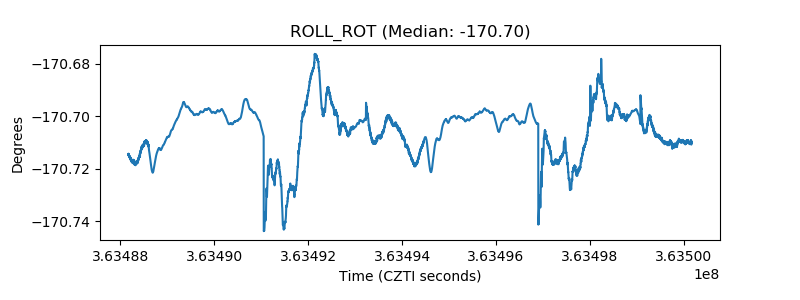 |
| _Roll_DEC | 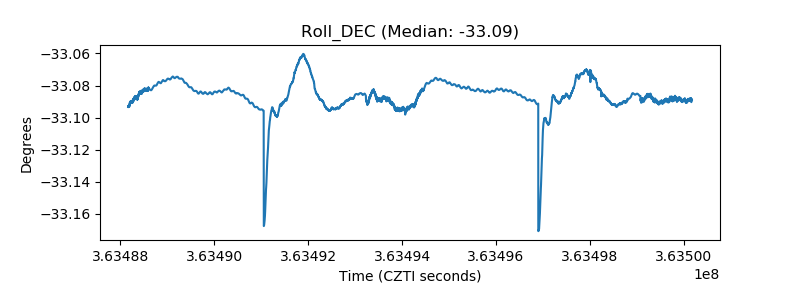 |
| _Roll_RA | 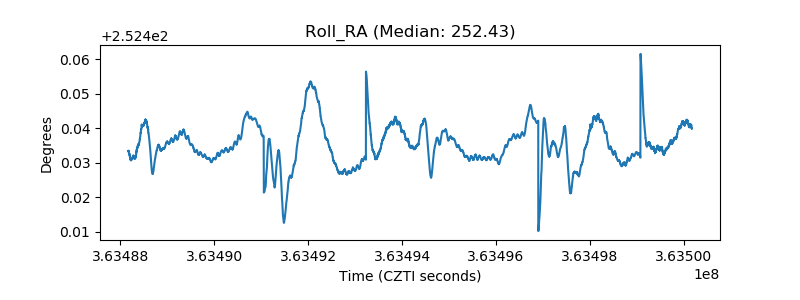 |
| Veto Counter | 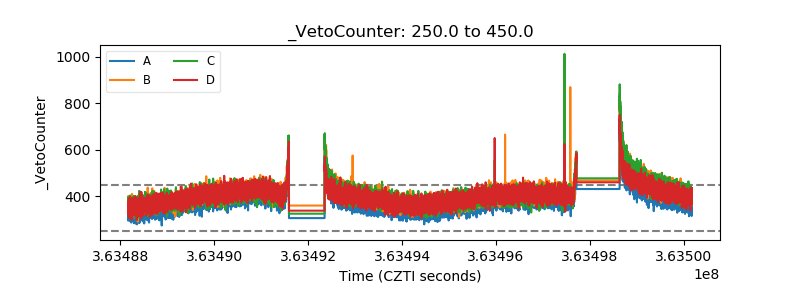 |