| Param | Original file | Final file |
|---|---|---|
| Filename | modeM0/AS1A10_073T02_9000004522_31247cztM0_level2.evt | modeM0/AS1A10_073T02_9000004522_31247cztM0_level2_quad_clean.evt |
| Size (bytes) | 644,339,520 | 73,584,000 |
| Size | 614.5 MB | 70.2 MB |
| Events in quadrant A | 3,195,658 | 459,400 |
| Events in quadrant B | 5,375,677 | 457,153 |
| Events in quadrant C | 3,607,972 | 436,258 |
| Events in quadrant D | 6,888,056 | 414,267 |
| Mode M9 | |||
|---|---|---|---|
| Quadrant | BADHDUFLAG | Total packets | Discarded packets |
| A | 0 | 11 | 0 |
| B | 0 | 12 | 0 |
| C | 0 | 12 | 0 |
| D | 0 | 12 | 0 |
| Mode SS | |||
|---|---|---|---|
| Quadrant | BADHDUFLAG | Total packets | Discarded packets |
| A | 0 | 136 | 0 |
| B | 0 | 136 | 0 |
| C | 0 | 136 | 0 |
| D | 0 | 136 | 0 |
| Mode M0 | |||
|---|---|---|---|
| Quadrant | BADHDUFLAG | Total packets | Discarded packets |
| A | 0 | 13577 | 2 |
| B | 0 | 20578 | 2 |
| C | 0 | 14568 | 2 |
| D | 0 | 25083 | 2 |
| Quadrant | Total seconds | Saturated seconds | Saturation percentage |
|---|---|---|---|
| A | 6604 | 23 | 0.348274% |
| B | 6604 | 127 | 1.923077% |
| C | 6604 | 150 | 2.271351% |
| D | 6604 | 513 | 7.768019% |
Noise dominated data is calculated using 1-second bins in cleaned event files. If a bin has >2000 counts, and if more than 50% of those come from <1% of pixels, then it is considered to be noise-dominated and hence unusable.
| Quadrant | # 1 sec bins | Bins with >0 counts | Bins with >2000 counts | High rate bins dominated by noise | Noise dominated (total time) | Noise dominated (detector-on time) | Marked lightcurve |
|---|---|---|---|---|---|---|---|
| A | 7674 | 6605 | 0 | 0 | 0.00% | 0.00% | 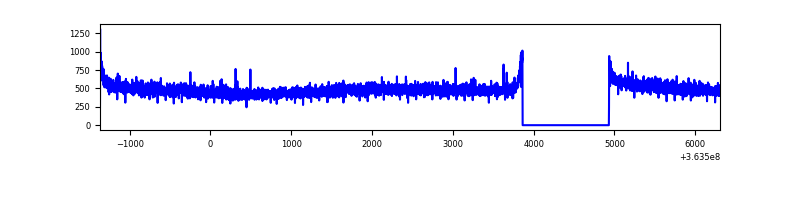 |
| B | 7674 | 6605 | 25 | 25 | 0.33% | 0.38% | 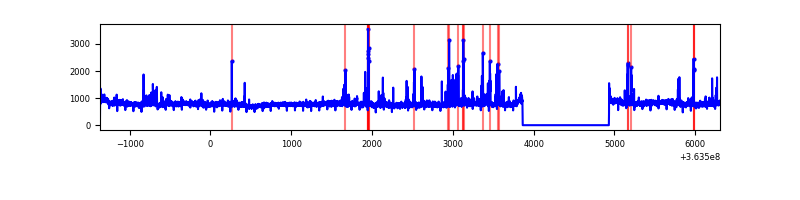 |
| C | 7674 | 6605 | 45 | 45 | 0.59% | 0.68% | 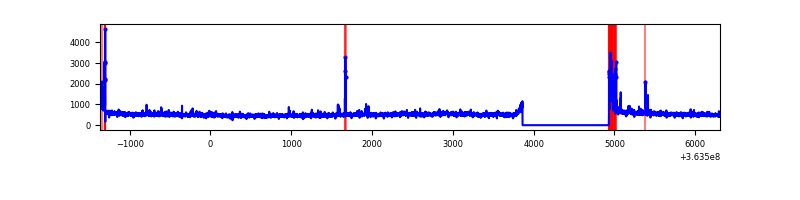 |
| D | 7674 | 6605 | 381 | 381 | 4.96% | 5.77% | 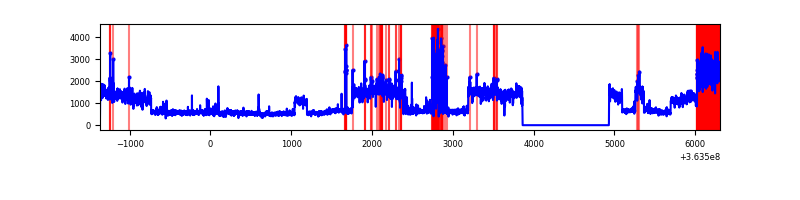 |
Top three noisy pixels from each quadrant. If the there are fewer than three noisy pixels in the level2.evt file, extra rows are filled as -1
| Pixel properties | Quadrant properties | ||||||
|---|---|---|---|---|---|---|---|
| Quadrant | DetID | PixID | Counts | Sigma | Mean | Median | Sigma |
| A | 11 | 47 | 15131 | 86.64 | 824 | 808 | 165.3 |
| A | 13 | 254 | 11903 | 67.11 | 824 | 808 | 165.3 |
| A | 3 | 137 | 8079 | 43.98 | 824 | 808 | 165.3 |
| B | 6 | 159 | 1805565 | 11534.96 | 818 | 797 | 156.5 |
| B | 4 | 80 | 195814 | 1246.43 | 818 | 797 | 156.5 |
| B | 0 | 190 | 112006 | 710.78 | 818 | 797 | 156.5 |
| C | 0 | 10 | 287869 | 1553.89 | 790 | 796 | 184.7 |
| C | 14 | 238 | 129271 | 695.42 | 790 | 796 | 184.7 |
| C | 3 | 233 | 72744 | 389.44 | 790 | 796 | 184.7 |
| D | 8 | 195 | 3582181 | 18212.64 | 769 | 751 | 196.6 |
| D | 12 | 233 | 244034 | 1237.17 | 769 | 751 | 196.6 |
| D | 2 | 250 | 79836 | 402.17 | 769 | 751 | 196.6 |
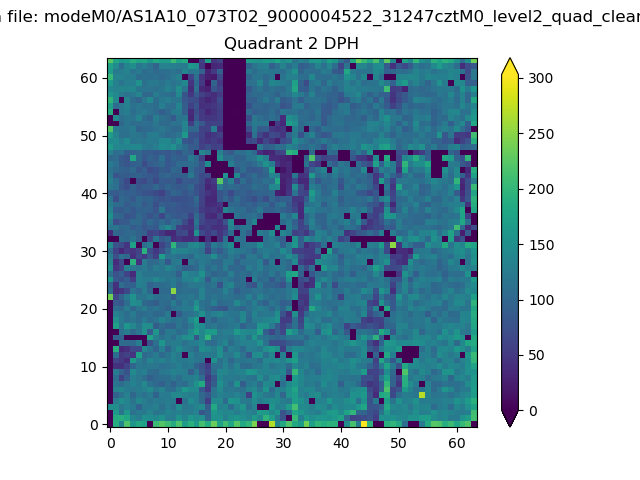
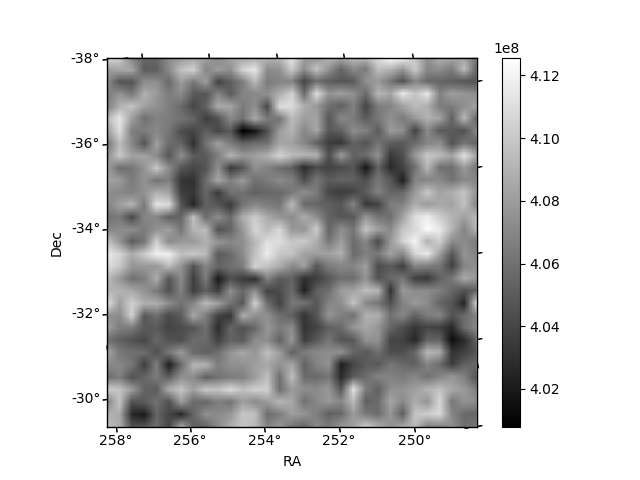
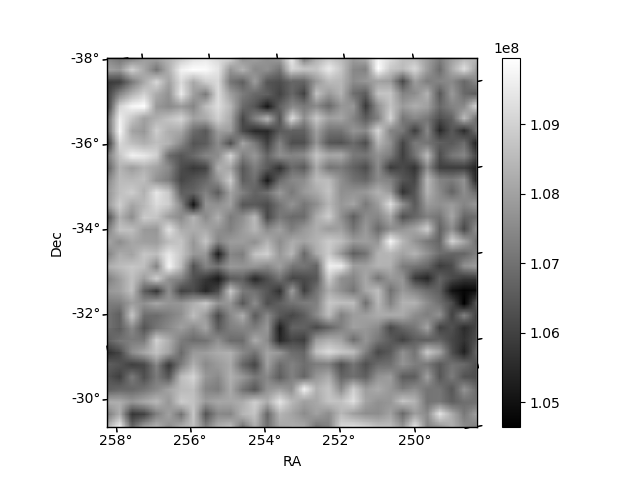
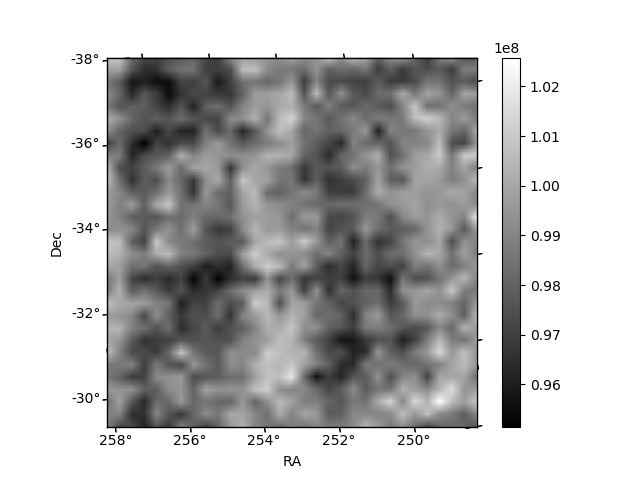
Histogram calculated using DETX and DETY for each event in the final _common_clean file
| Quadrant A | 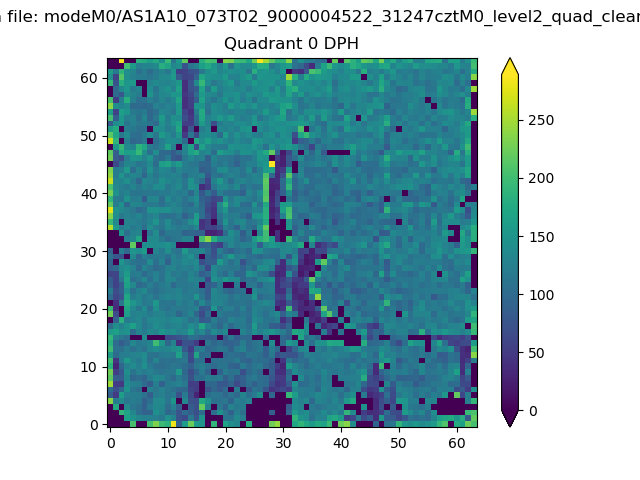 |
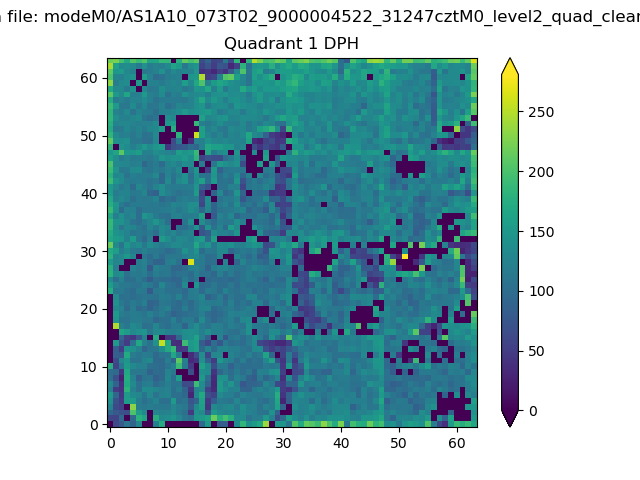 |
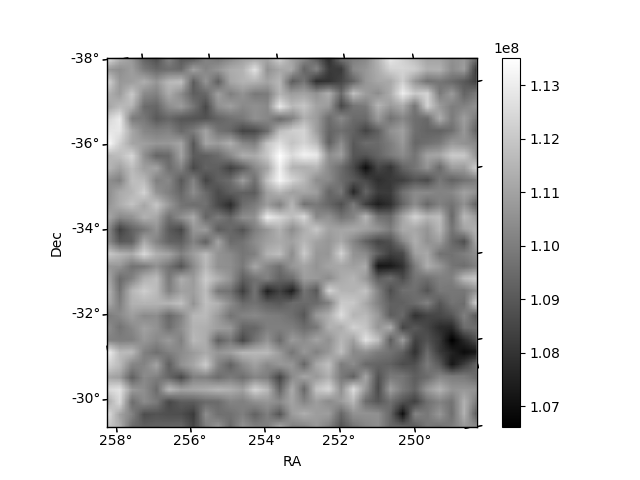
Quadrant B |
|---|---|---|---|
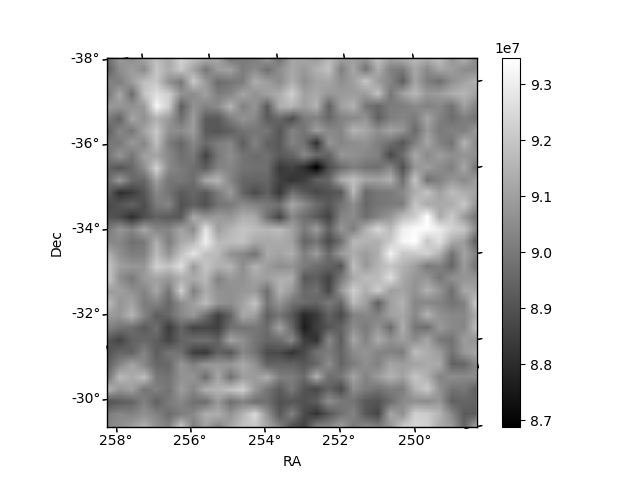
| Quadrant D | 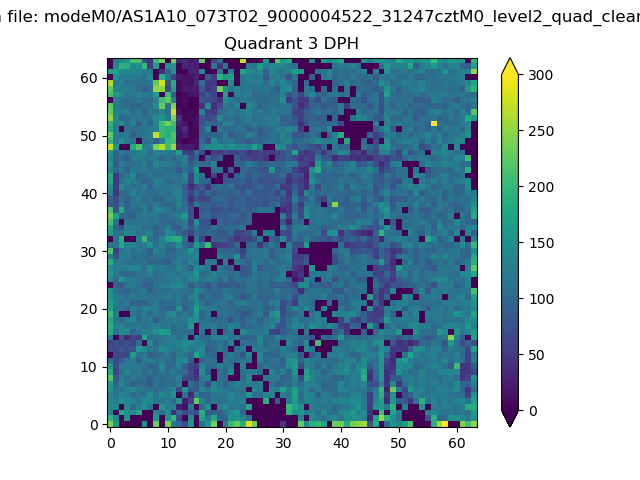 |
 |
Quadrant C |
| Plot type | Count rate plots | Images |
|---|---|---|
| Comparison with Poisson distribution Blue bars denote a histogram of data divided into 1 sec bins. Red curve is a Poisson curve with rate = median count rate of data. |
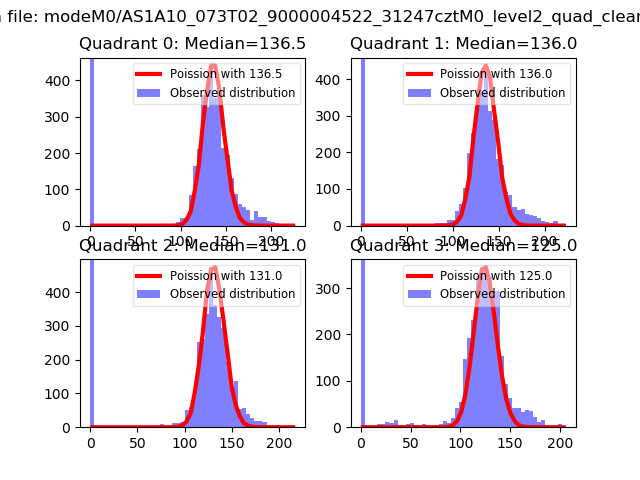 |
 |
| Quadrant-wise count rates Data is divided into 100 sec bins |
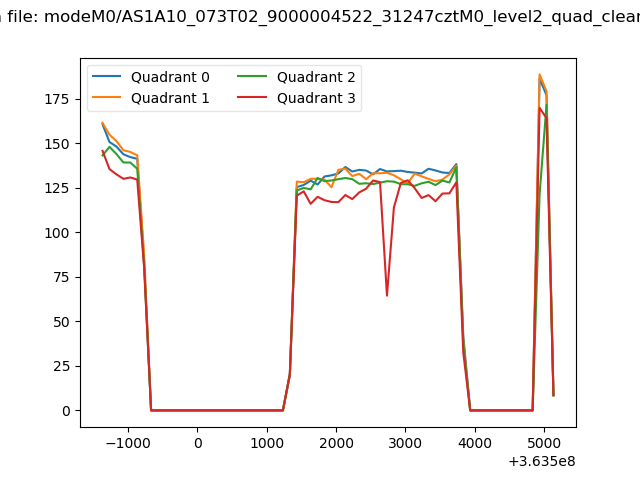 |
|
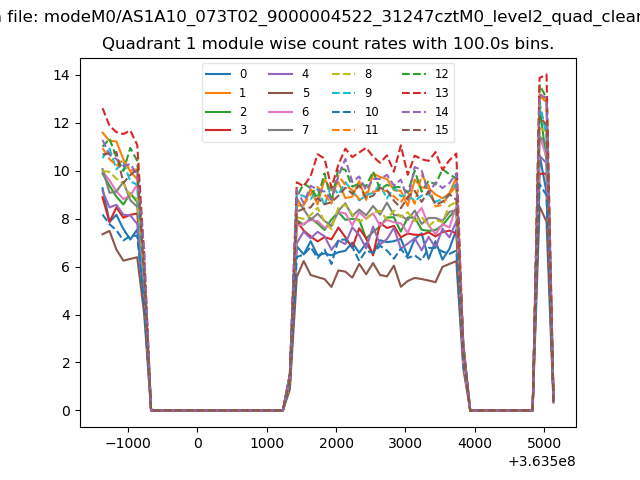
| Module-wise count rates for Quadrant A Data is divided into 100 sec bins |
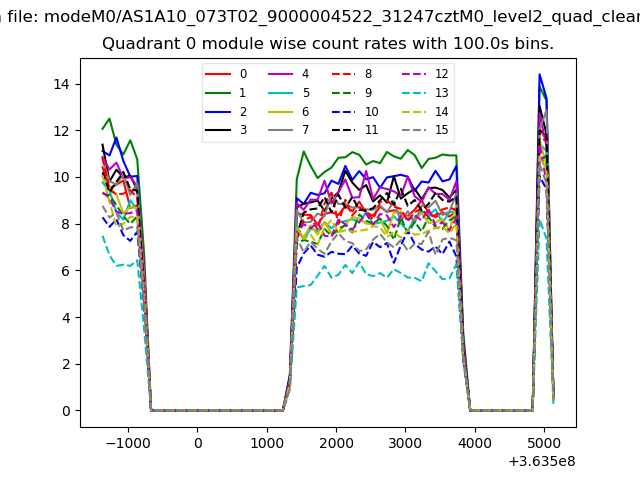 |
 |
| Module-wise count rates for Quadrant B Data is divided into 100 sec bins |
 |
 |
| Module-wise count rates for Quadrant C Data is divided into 100 sec bins |
 |
 |
| Module-wise count rates for Quadrant D Data is divided into 100 sec bins |
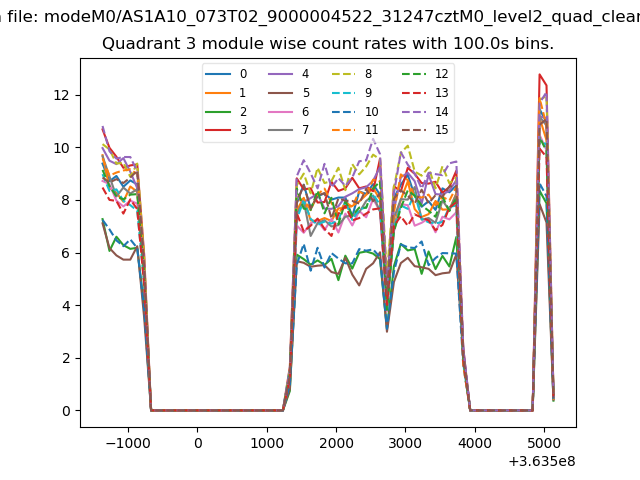 |
 |
| Parameter | Plot |
|---|---|
| CZT HV Monitor | 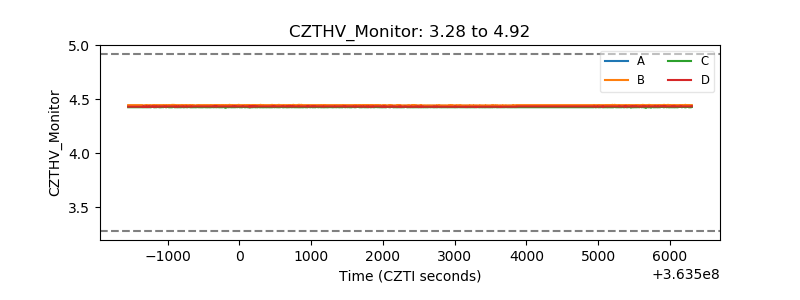 |
| D_VDD | 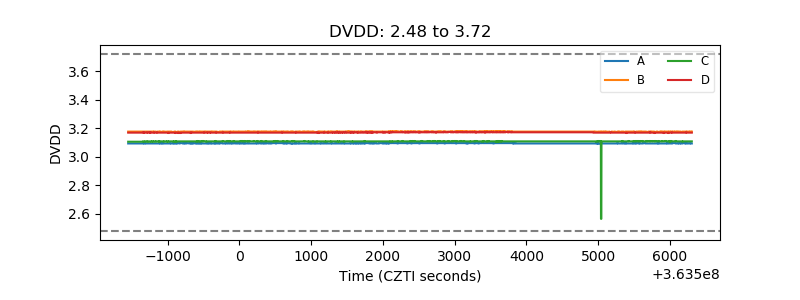 |
| Temperature 1 | 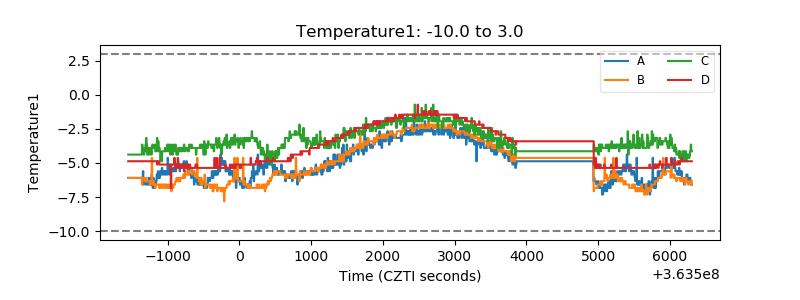 |
| Veto HV Monitor | 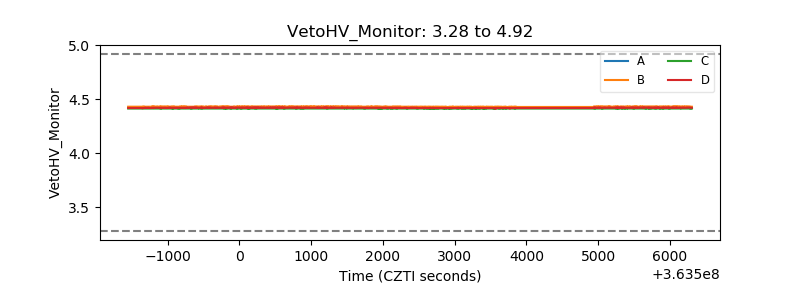 |
| Veto LLD | 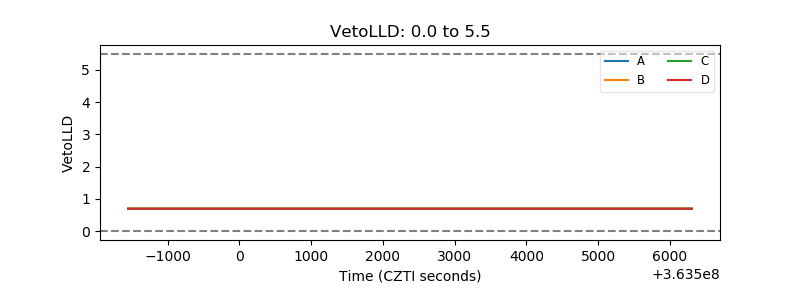 |
| Alpha Counter | 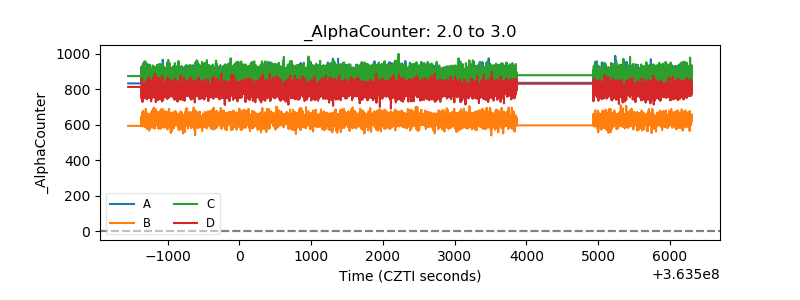 |
| _CPM_Rate | 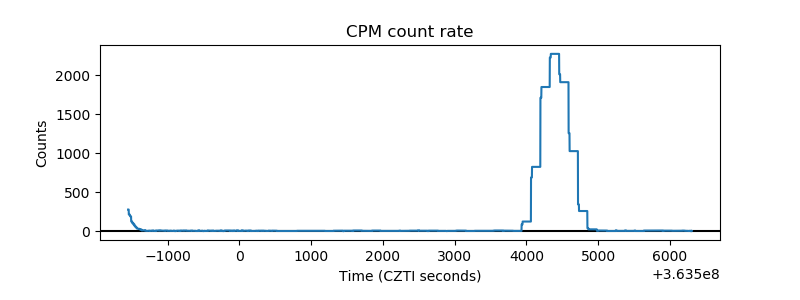 |
| CZT Counter | 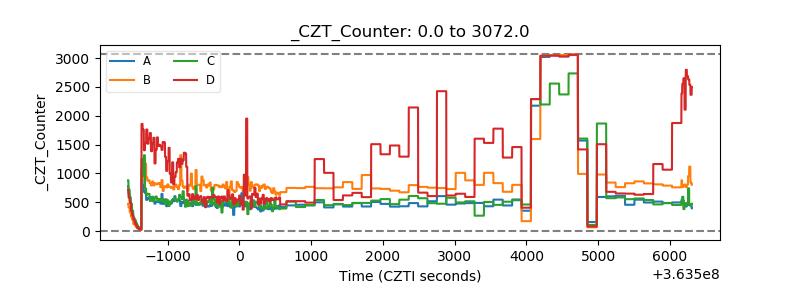 |
| +2.5 Volts monitor |  |
| +5 Volts monitor | 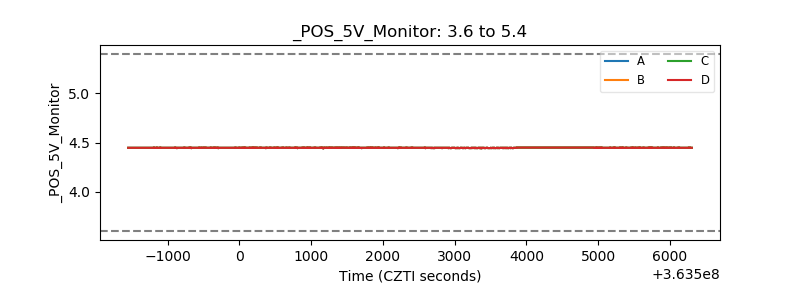 |
| _ROLL_ROT | 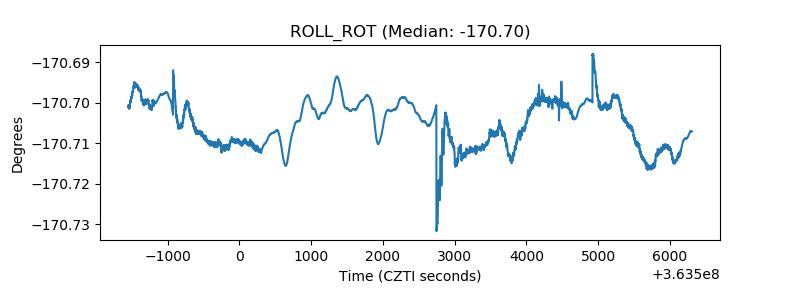 |
| _Roll_DEC | 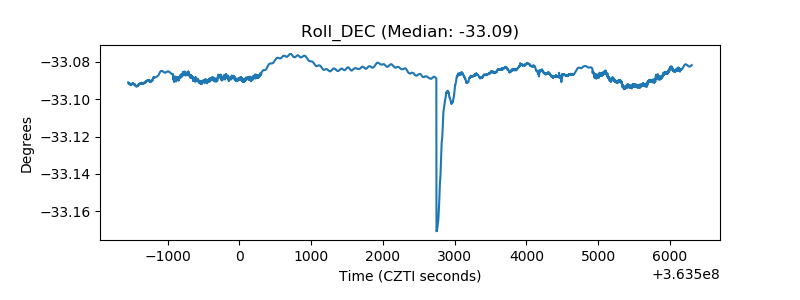 |
| _Roll_RA | 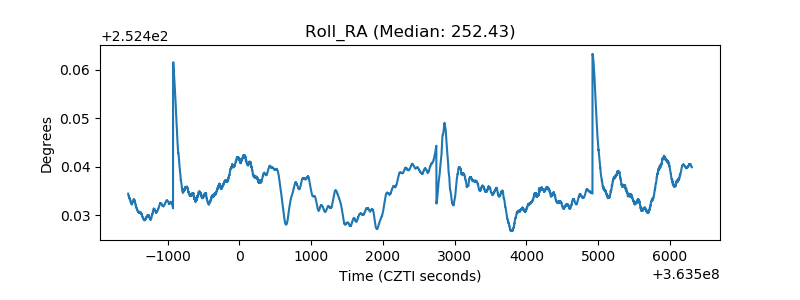 |
| Veto Counter | 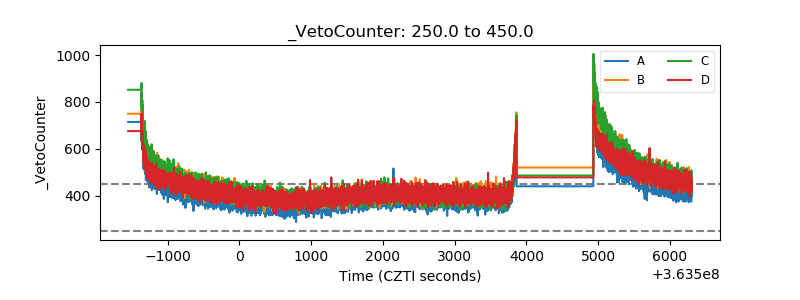 |