| Param | Original file | Final file |
|---|---|---|
| Filename | modeM0/AS1A10_073T02_9000004522_31249cztM0_level2.evt | modeM0/AS1A10_073T02_9000004522_31249cztM0_level2_quad_clean.evt |
| Size (bytes) | 657,555,840 | 66,850,560 |
| Size | 627.1 MB | 63.8 MB |
| Events in quadrant A | 3,297,826 | 412,587 |
| Events in quadrant B | 5,843,262 | 380,942 |
| Events in quadrant C | 3,856,003 | 393,880 |
| Events in quadrant D | 6,480,048 | 385,141 |
| Mode M9 | |||
|---|---|---|---|
| Quadrant | BADHDUFLAG | Total packets | Discarded packets |
| A | 0 | 17 | 0 |
| B | 0 | 18 | 0 |
| C | 0 | 18 | 0 |
| D | 0 | 18 | 0 |
| Mode SS | |||
|---|---|---|---|
| Quadrant | BADHDUFLAG | Total packets | Discarded packets |
| A | 0 | 132 | 0 |
| B | 0 | 132 | 0 |
| C | 0 | 132 | 0 |
| D | 0 | 132 | 0 |
| Mode M0 | |||
|---|---|---|---|
| Quadrant | BADHDUFLAG | Total packets | Discarded packets |
| A | 0 | 13708 | 2 |
| B | 0 | 21816 | 2 |
| C | 0 | 15457 | 3 |
| D | 0 | 24012 | 2 |
| Quadrant | Total seconds | Saturated seconds | Saturation percentage |
|---|---|---|---|
| A | 6466 | 30 | 0.463965% |
| B | 6466 | 598 | 9.248376% |
| C | 6465 | 205 | 3.170920% |
| D | 6465 | 616 | 9.528229% |
Noise dominated data is calculated using 1-second bins in cleaned event files. If a bin has >2000 counts, and if more than 50% of those come from <1% of pixels, then it is considered to be noise-dominated and hence unusable.
| Quadrant | # 1 sec bins | Bins with >0 counts | Bins with >2000 counts | High rate bins dominated by noise | Noise dominated (total time) | Noise dominated (detector-on time) | Marked lightcurve |
|---|---|---|---|---|---|---|---|
| A | 7646 | 6467 | 0 | 0 | 0.00% | 0.00% | 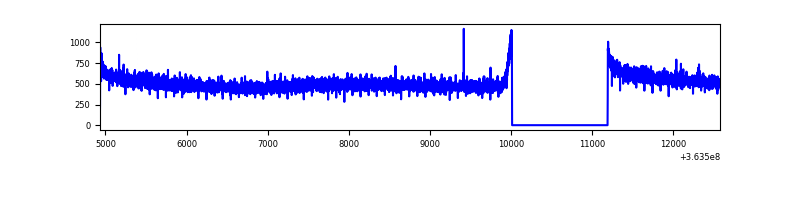 |
| B | 7646 | 6467 | 163 | 163 | 2.13% | 2.52% | 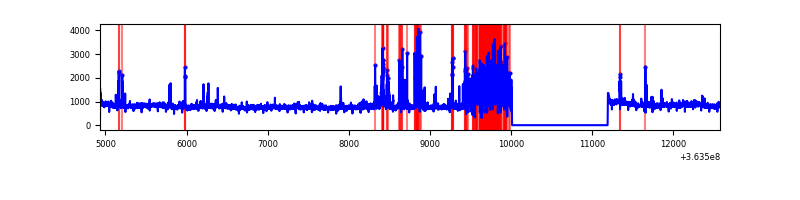 |
| C | 7645 | 6466 | 56 | 56 | 0.73% | 0.87% | 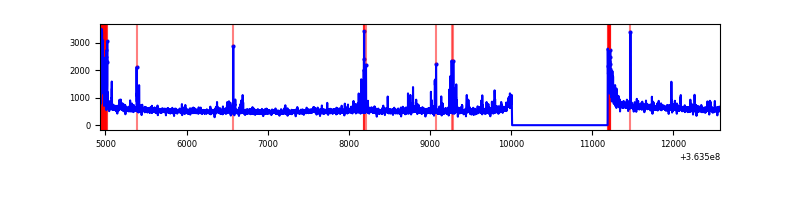 |
| D | 7645 | 6466 | 500 | 500 | 6.54% | 7.73% | 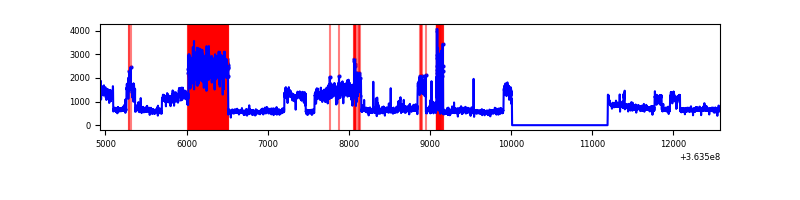 |
Top three noisy pixels from each quadrant. If the there are fewer than three noisy pixels in the level2.evt file, extra rows are filled as -1
| Pixel properties | Quadrant properties | ||||||
|---|---|---|---|---|---|---|---|
| Quadrant | DetID | PixID | Counts | Sigma | Mean | Median | Sigma |
| A | 13 | 254 | 11793 | 64.48 | 854 | 840 | 169.9 |
| A | 3 | 137 | 8187 | 43.25 | 854 | 840 | 169.9 |
| A | 0 | 226 | 7268 | 37.84 | 854 | 840 | 169.9 |
| B | 6 | 159 | 1654207 | 10715.16 | 822 | 804 | 154.3 |
| B | 12 | 18 | 348753 | 2254.94 | 822 | 804 | 154.3 |
| B | 4 | 80 | 306808 | 1983.11 | 822 | 804 | 154.3 |
| C | 0 | 10 | 232041 | 1227.42 | 817 | 822 | 188.4 |
| C | 3 | 233 | 160742 | 848.93 | 817 | 822 | 188.4 |
| C | 14 | 238 | 138179 | 729.16 | 817 | 822 | 188.4 |
| D | 8 | 195 | 3244786 | 15834.99 | 803 | 787 | 204.9 |
| D | 12 | 233 | 137129 | 665.53 | 803 | 787 | 204.9 |
| D | 2 | 250 | 43768 | 209.8 | 803 | 787 | 204.9 |
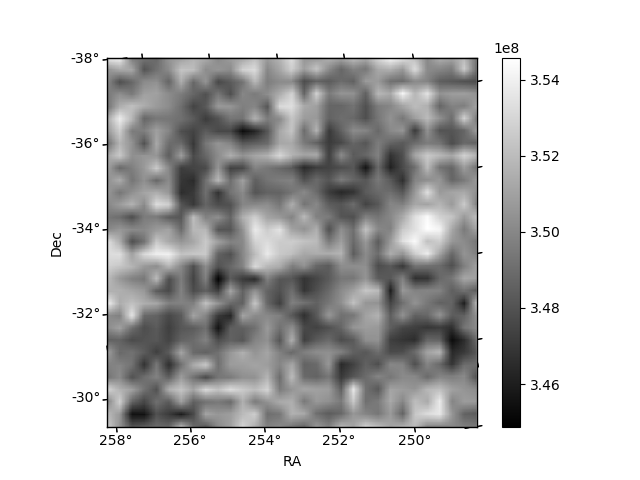
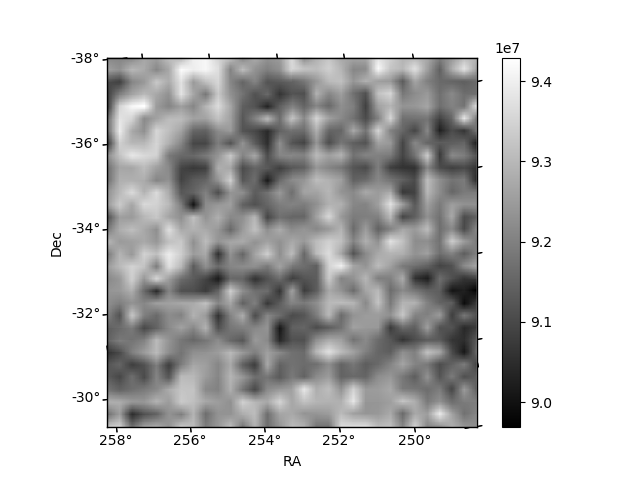
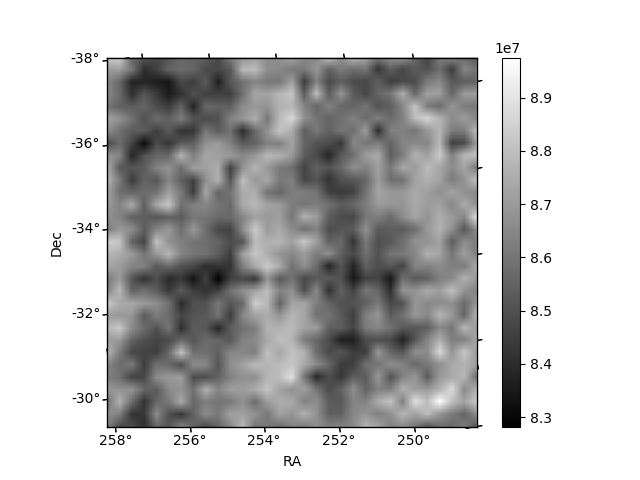
Histogram calculated using DETX and DETY for each event in the final _common_clean file
| Quadrant A | 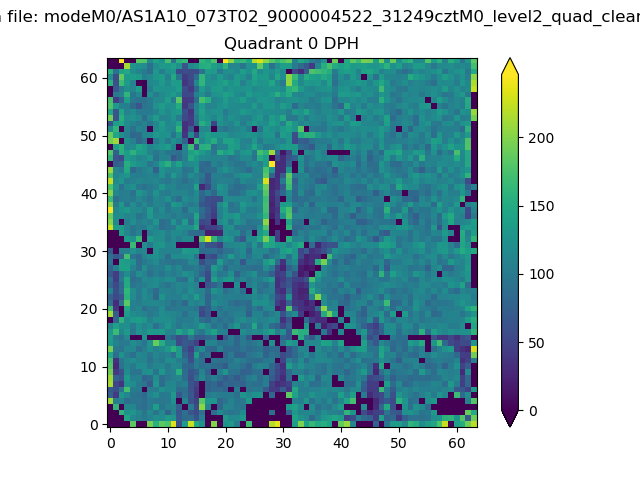 |
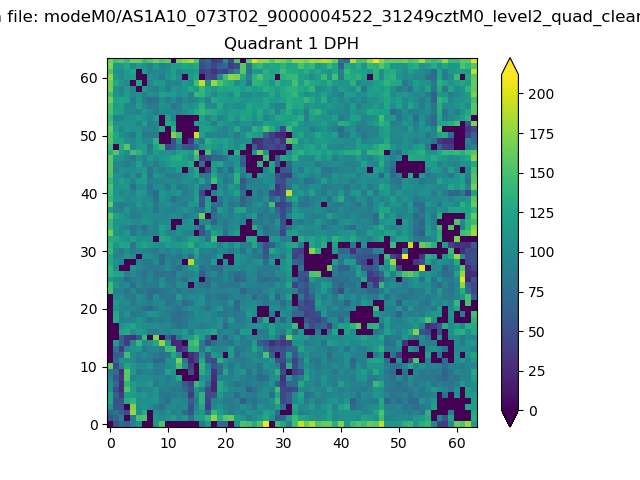 |
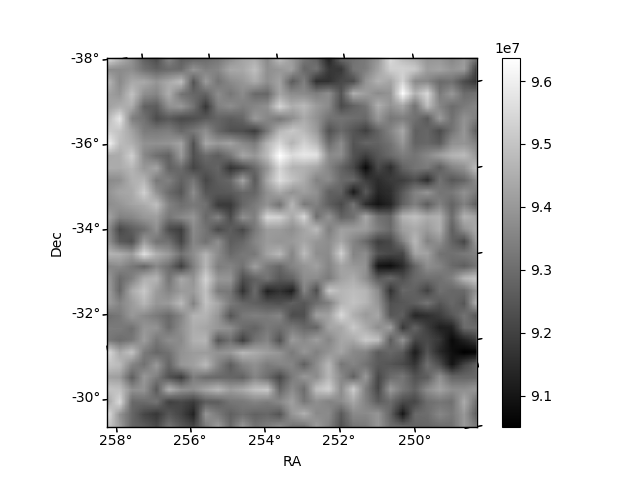
Quadrant B |
|---|---|---|---|
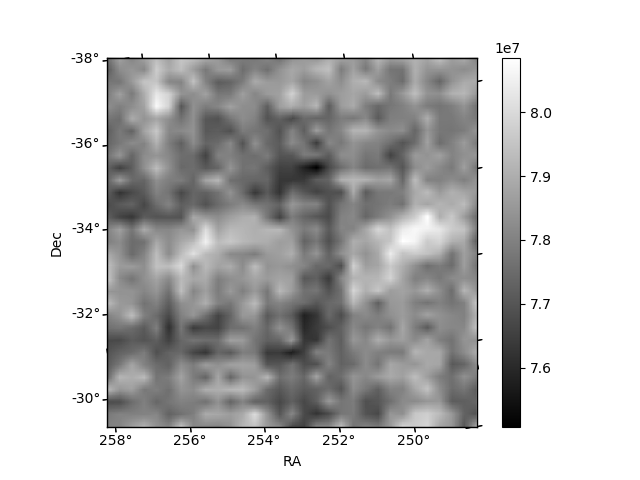
| Quadrant D | 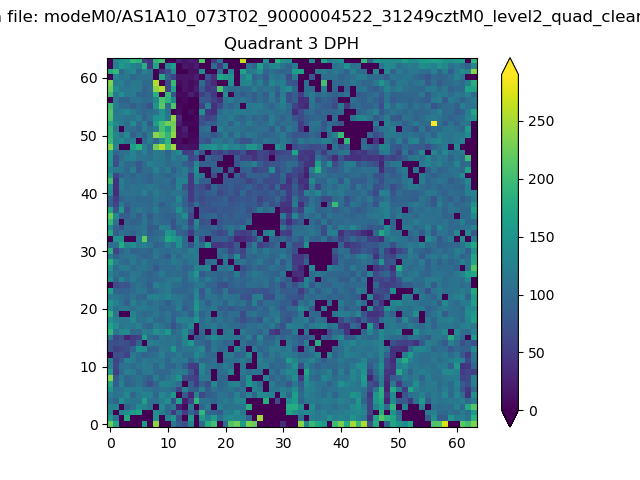 |
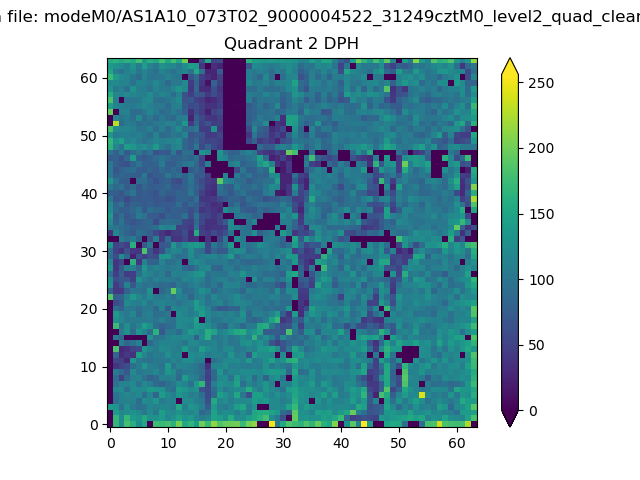 |
Quadrant C |
| Plot type | Count rate plots | Images |
|---|---|---|
| Comparison with Poisson distribution Blue bars denote a histogram of data divided into 1 sec bins. Red curve is a Poisson curve with rate = median count rate of data. |
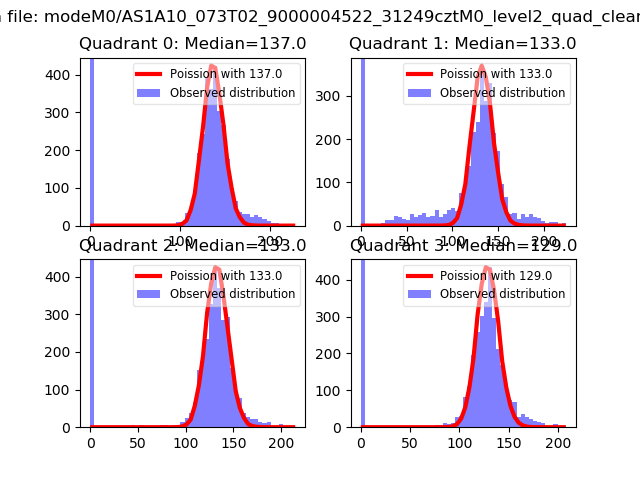 |
 |
| Quadrant-wise count rates Data is divided into 100 sec bins |
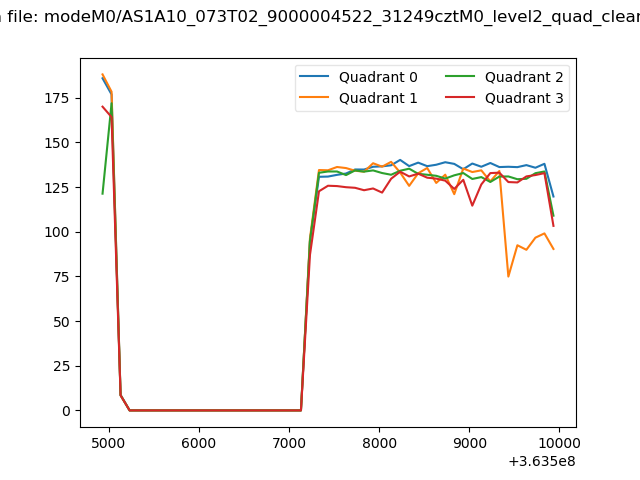 |
|
| Module-wise count rates for Quadrant A Data is divided into 100 sec bins |
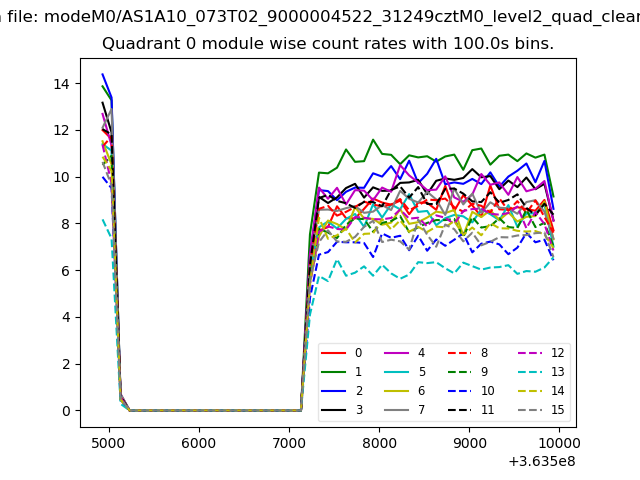 |
 |
| Module-wise count rates for Quadrant B Data is divided into 100 sec bins |
 |
 |
| Module-wise count rates for Quadrant C Data is divided into 100 sec bins |
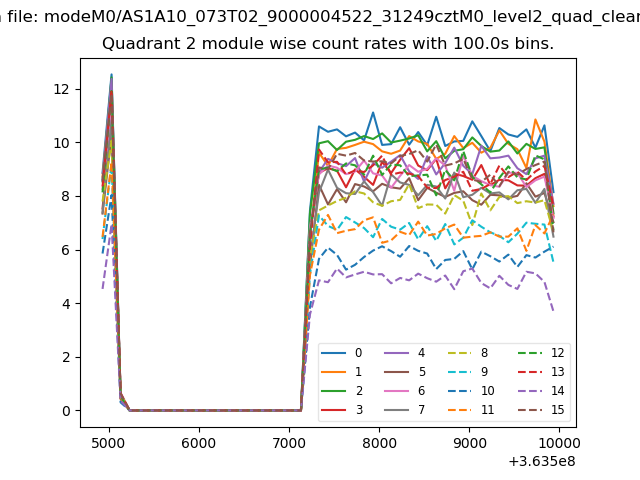 |
 |
| Module-wise count rates for Quadrant D Data is divided into 100 sec bins |
 |
 |
| Parameter | Plot |
|---|---|
| CZT HV Monitor | 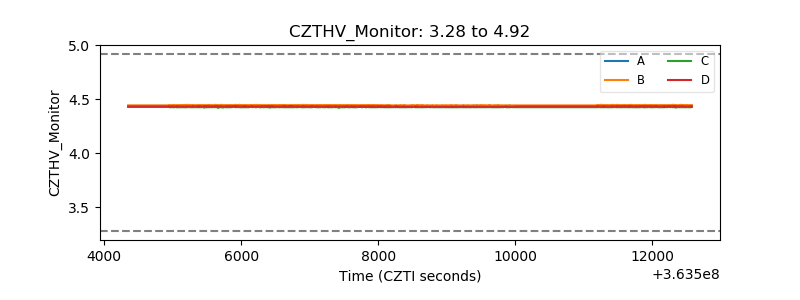 |
| D_VDD | 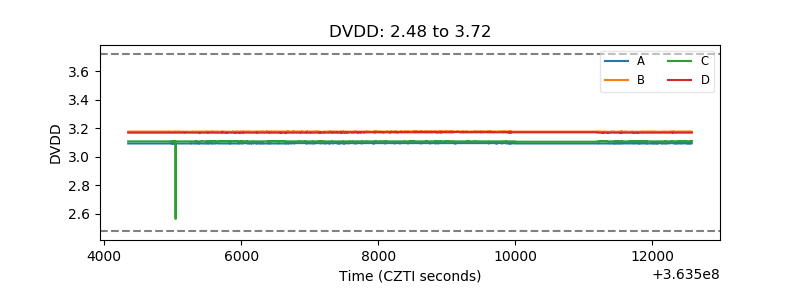 |
| Temperature 1 | 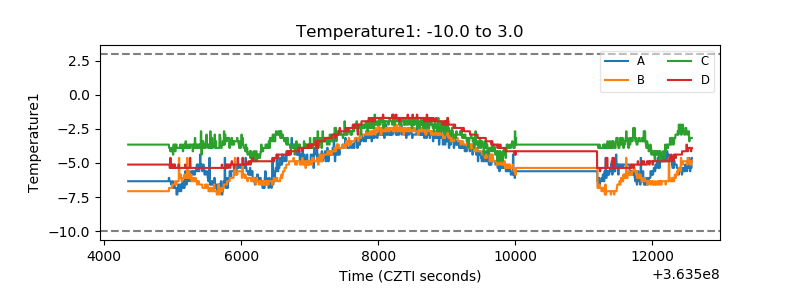 |
| Veto HV Monitor | 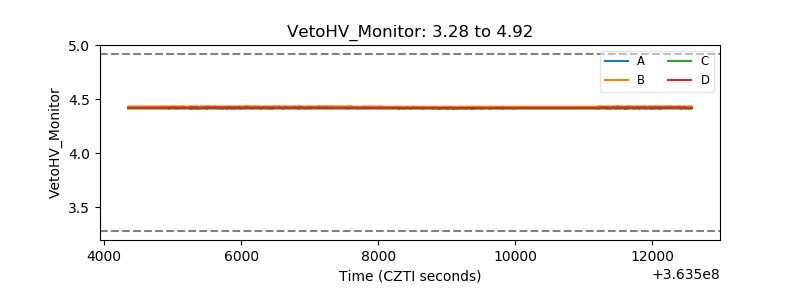 |
| Veto LLD |  |
| Alpha Counter | 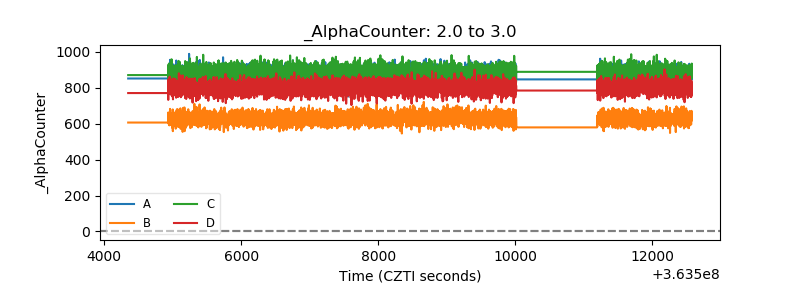 |
| _CPM_Rate | 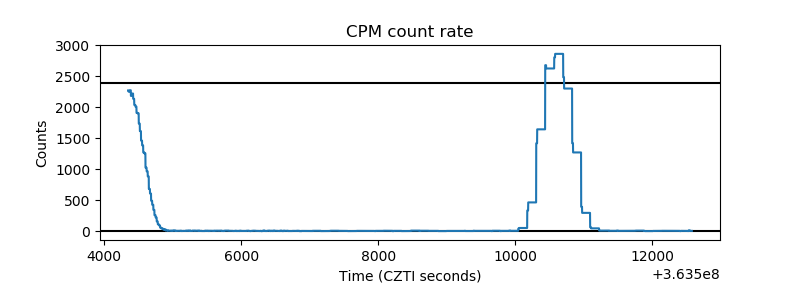 |
| CZT Counter | 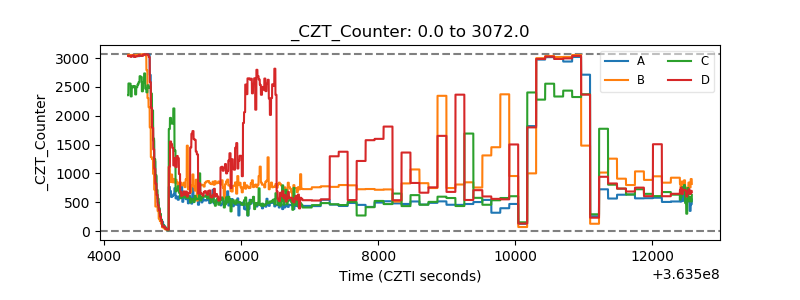 |
| +2.5 Volts monitor |  |
| +5 Volts monitor |  |
| _ROLL_ROT | 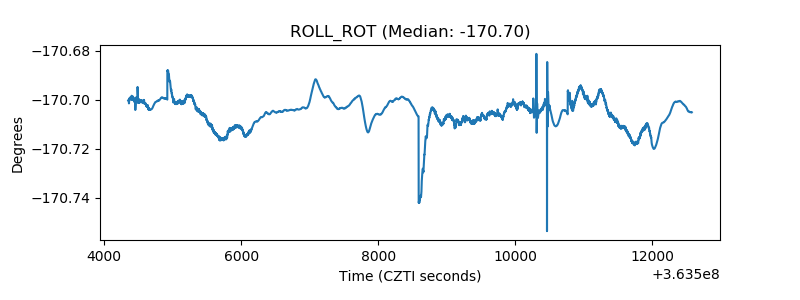 |
| _Roll_DEC | 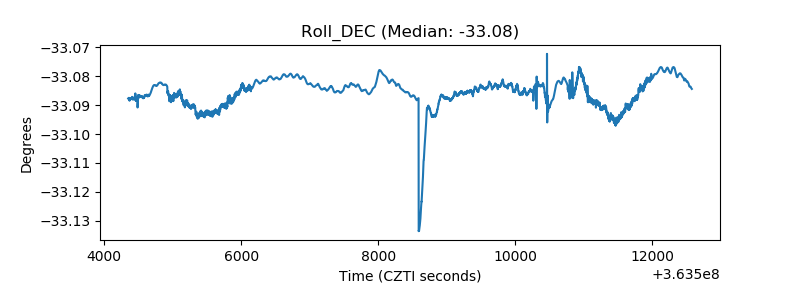 |
| _Roll_RA | 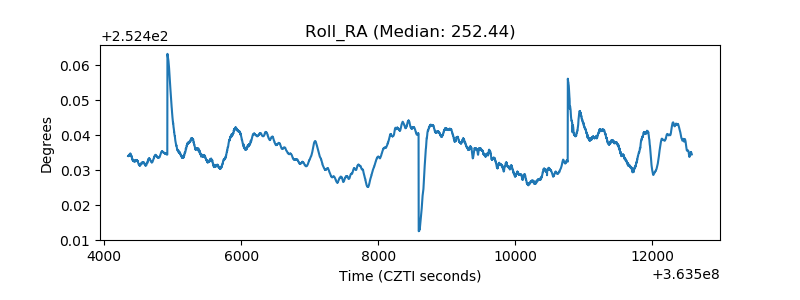 |
| Veto Counter | 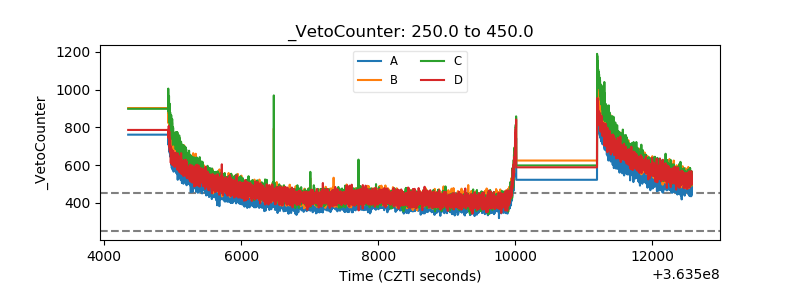 |