| Param | Original file | Final file |
|---|---|---|
| Filename | modeM0/AS1A10_073T02_9000004522_31250cztM0_level2.evt | modeM0/AS1A10_073T02_9000004522_31250cztM0_level2_quad_clean.evt |
| Size (bytes) | 618,163,200 | 71,691,840 |
| Size | 589.5 MB | 68.4 MB |
| Events in quadrant A | 3,442,306 | 442,972 |
| Events in quadrant B | 5,304,814 | 441,035 |
| Events in quadrant C | 3,898,382 | 431,598 |
| Events in quadrant D | 5,648,222 | 413,336 |
| Mode M9 | |||
|---|---|---|---|
| Quadrant | BADHDUFLAG | Total packets | Discarded packets |
| A | 0 | 12 | 0 |
| B | 0 | 12 | 0 |
| C | 0 | 12 | 0 |
| D | 0 | 12 | 0 |
| Mode SS | |||
|---|---|---|---|
| Quadrant | BADHDUFLAG | Total packets | Discarded packets |
| A | 0 | 130 | 0 |
| B | 0 | 130 | 0 |
| C | 0 | 130 | 0 |
| D | 0 | 130 | 0 |
| Mode M0 | |||
|---|---|---|---|
| Quadrant | BADHDUFLAG | Total packets | Discarded packets |
| A | 0 | 14100 | 2 |
| B | 0 | 19977 | 2 |
| C | 0 | 15714 | 2 |
| D | 0 | 21667 | 2 |
| Quadrant | Total seconds | Saturated seconds | Saturation percentage |
|---|---|---|---|
| A | 6323 | 51 | 0.806579% |
| B | 6324 | 142 | 2.245414% |
| C | 6324 | 235 | 3.716003% |
| D | 6324 | 184 | 2.909551% |
Noise dominated data is calculated using 1-second bins in cleaned event files. If a bin has >2000 counts, and if more than 50% of those come from <1% of pixels, then it is considered to be noise-dominated and hence unusable.
| Quadrant | # 1 sec bins | Bins with >0 counts | Bins with >2000 counts | High rate bins dominated by noise | Noise dominated (total time) | Noise dominated (detector-on time) | Marked lightcurve |
|---|---|---|---|---|---|---|---|
| A | 7583 | 6324 | 0 | 0 | 0.00% | 0.00% | 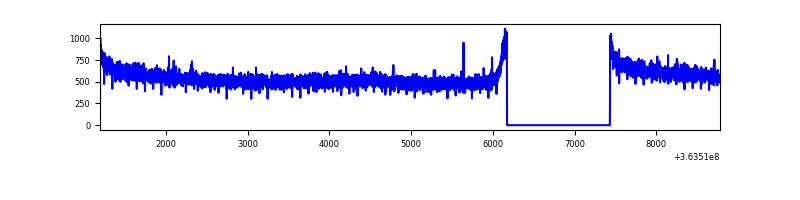 |
| B | 7584 | 6325 | 8 | 8 | 0.11% | 0.13% | 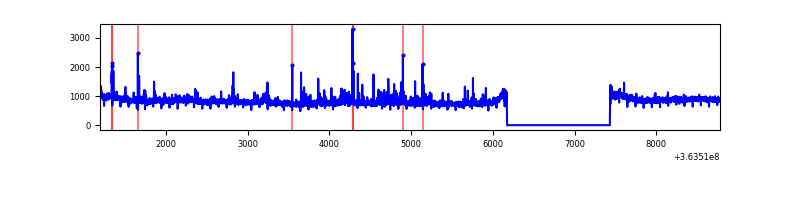 |
| C | 7584 | 6325 | 37 | 37 | 0.49% | 0.58% | 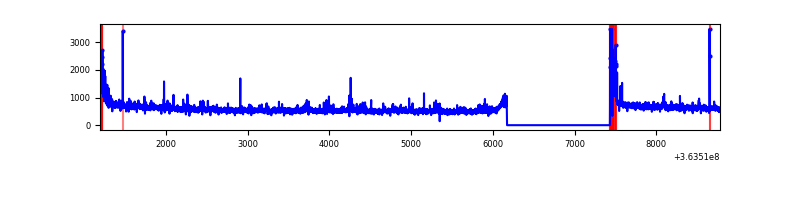 |
| D | 7584 | 6325 | 138 | 138 | 1.82% | 2.18% | 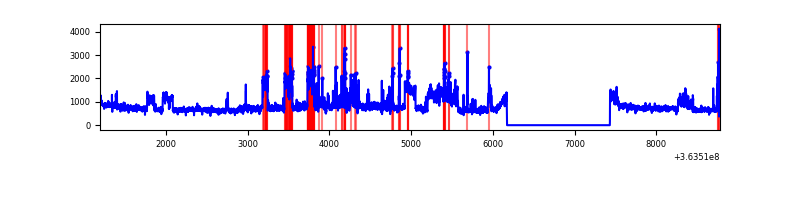 |
Top three noisy pixels from each quadrant. If the there are fewer than three noisy pixels in the level2.evt file, extra rows are filled as -1
| Pixel properties | Quadrant properties | ||||||
|---|---|---|---|---|---|---|---|
| Quadrant | DetID | PixID | Counts | Sigma | Mean | Median | Sigma |
| A | 13 | 254 | 11650 | 61.72 | 892 | 879 | 174.5 |
| A | 3 | 137 | 8088 | 41.31 | 892 | 879 | 174.5 |
| A | 0 | 226 | 7512 | 38.01 | 892 | 879 | 174.5 |
| B | 6 | 159 | 1655979 | 10112.62 | 880 | 861 | 163.7 |
| B | 4 | 80 | 106922 | 648.02 | 880 | 861 | 163.7 |
| B | 0 | 190 | 56787 | 341.7 | 880 | 861 | 163.7 |
| C | 0 | 10 | 192567 | 980.63 | 852 | 860 | 195.5 |
| C | 3 | 233 | 169679 | 863.55 | 852 | 860 | 195.5 |
| C | 14 | 238 | 140680 | 715.21 | 852 | 860 | 195.5 |
| D | 8 | 195 | 2116209 | 9744.98 | 860 | 841 | 217.1 |
| D | 12 | 233 | 166389 | 762.64 | 860 | 841 | 217.1 |
| D | 2 | 250 | 88217 | 402.52 | 860 | 841 | 217.1 |
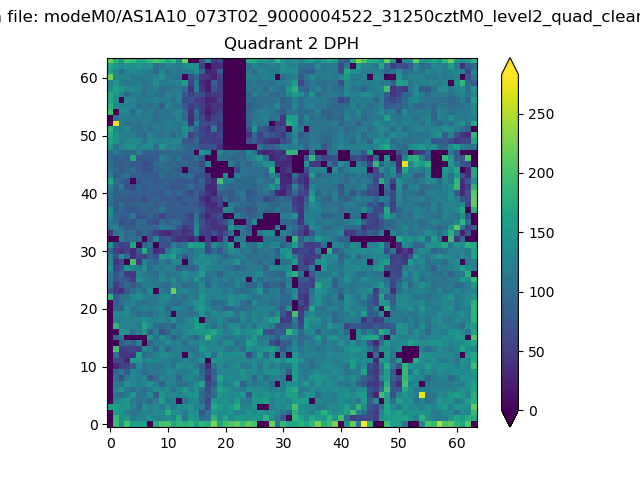
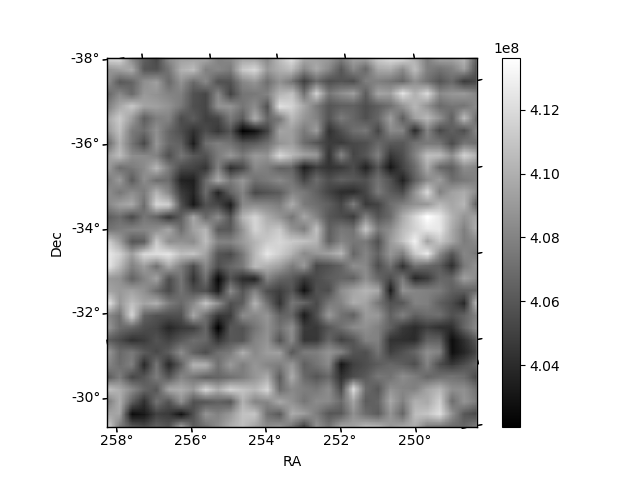
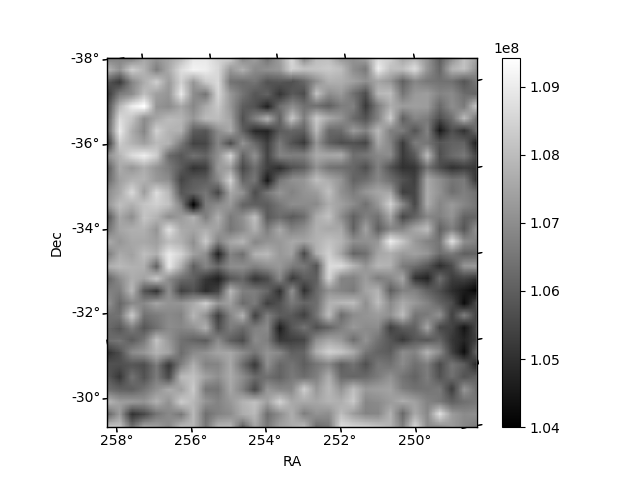
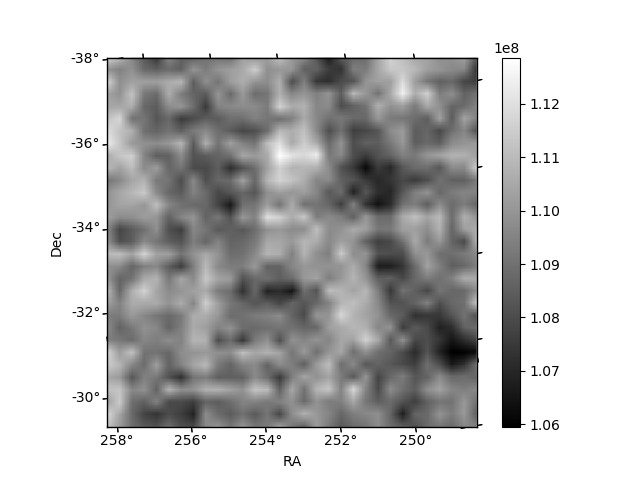
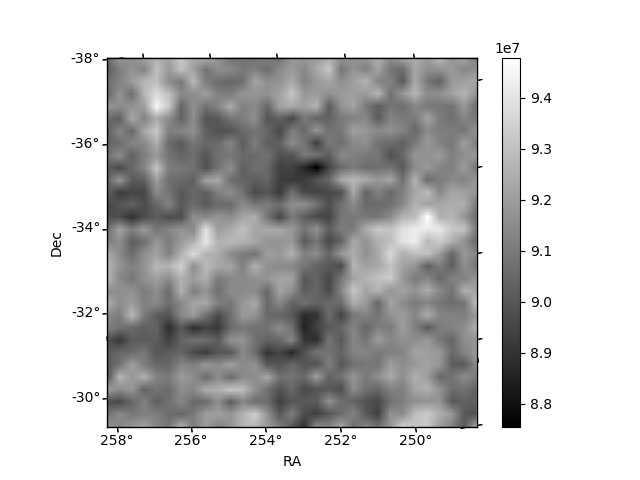
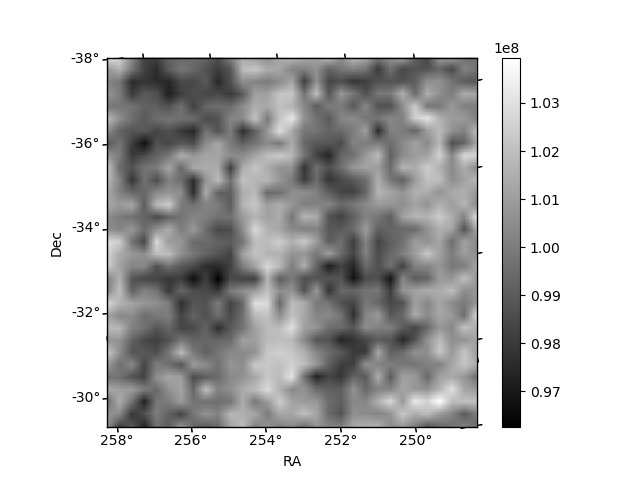
Histogram calculated using DETX and DETY for each event in the final _common_clean file
| Quadrant A | 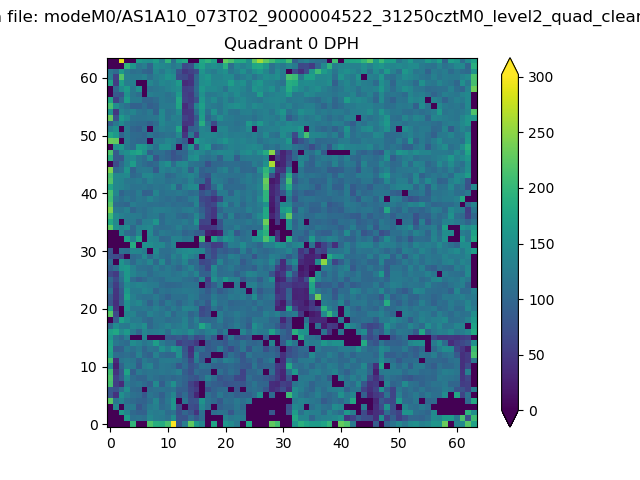 |
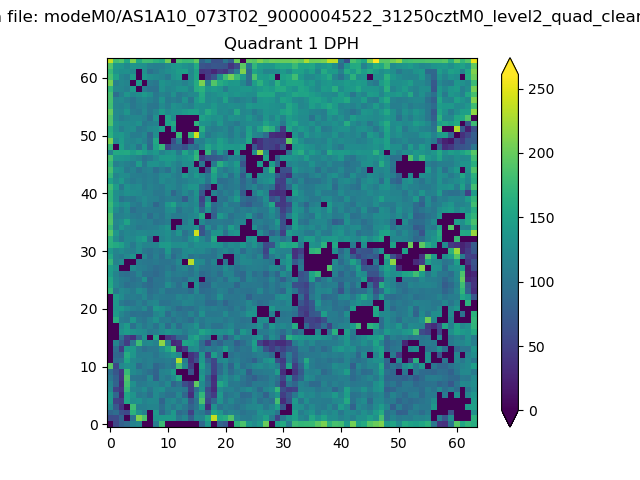 |
Quadrant B |
|---|---|---|---|
| Quadrant D | 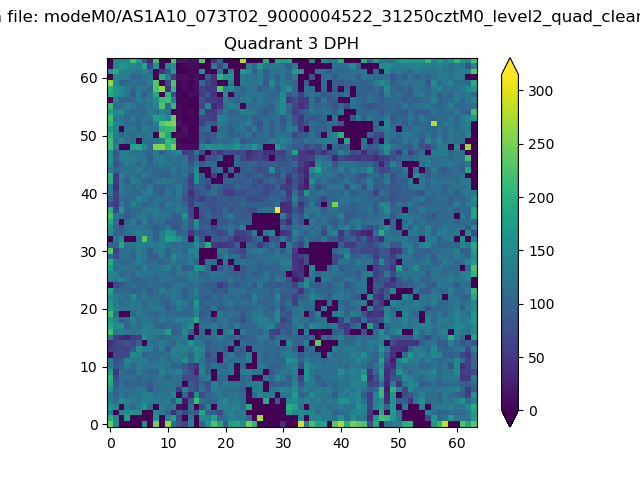 |
 |
Quadrant C |
| Plot type | Count rate plots | Images |
|---|---|---|
| Comparison with Poisson distribution Blue bars denote a histogram of data divided into 1 sec bins. Red curve is a Poisson curve with rate = median count rate of data. |
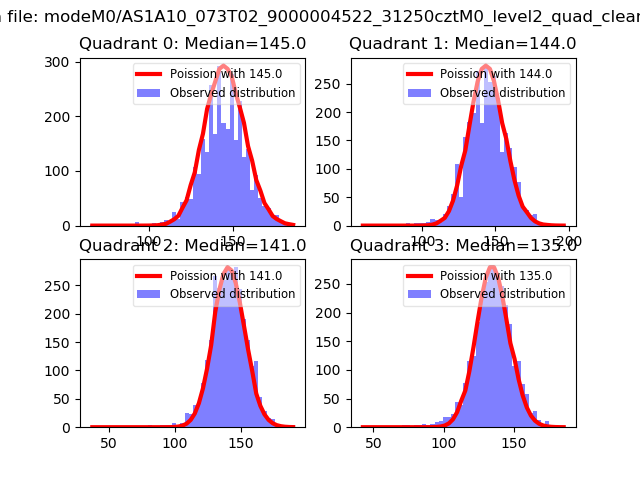 |
 |
| Quadrant-wise count rates Data is divided into 100 sec bins |
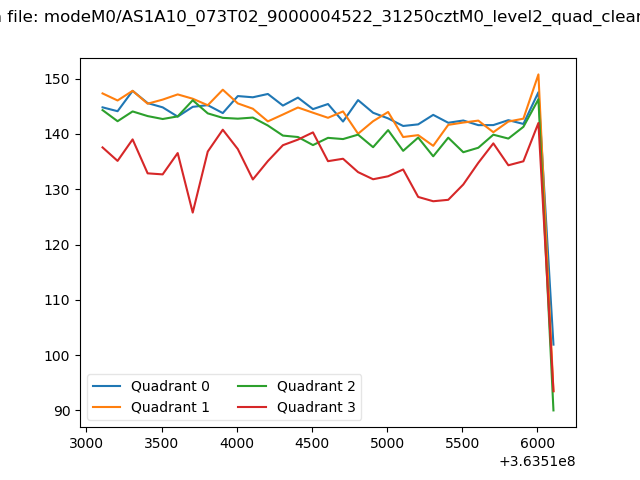 |
|
| Module-wise count rates for Quadrant A Data is divided into 100 sec bins |
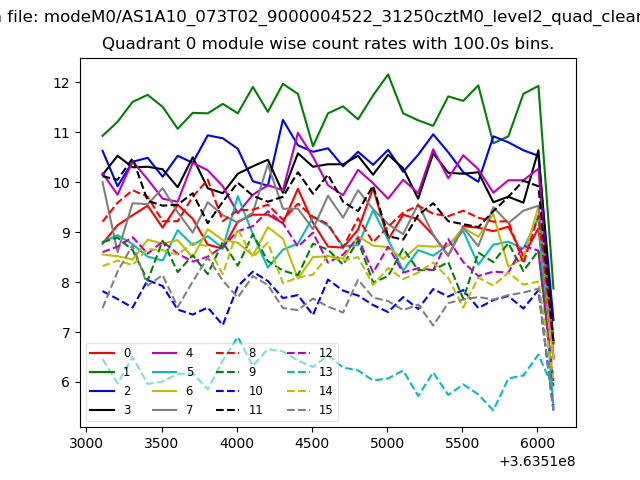 |
 |
| Module-wise count rates for Quadrant B Data is divided into 100 sec bins |
 |
 |
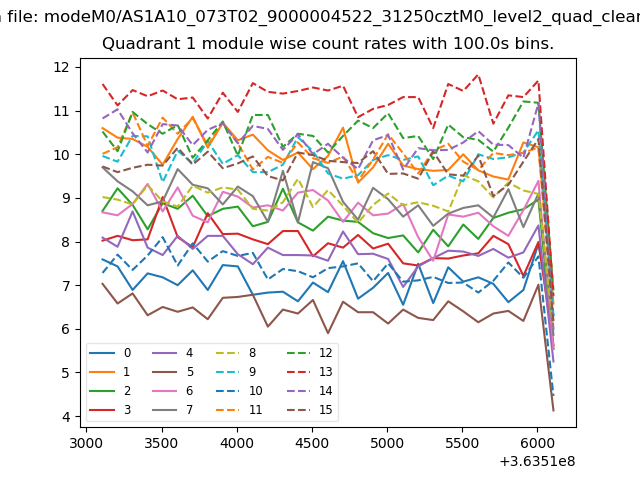
| Module-wise count rates for Quadrant C Data is divided into 100 sec bins |
 |
 |
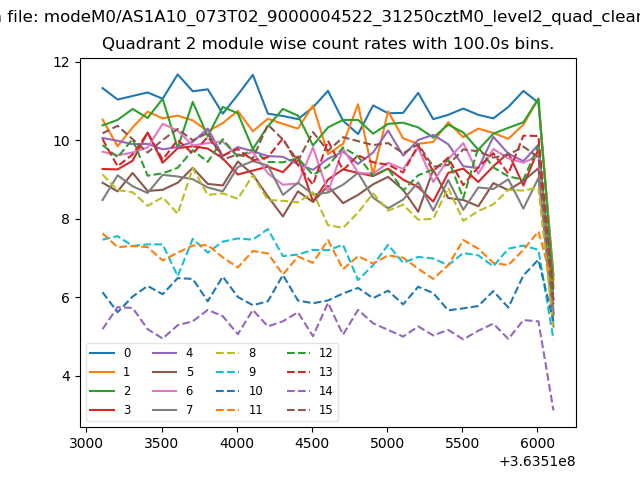
| Module-wise count rates for Quadrant D Data is divided into 100 sec bins |
 |
 |
| Parameter | Plot |
|---|---|
| CZT HV Monitor | 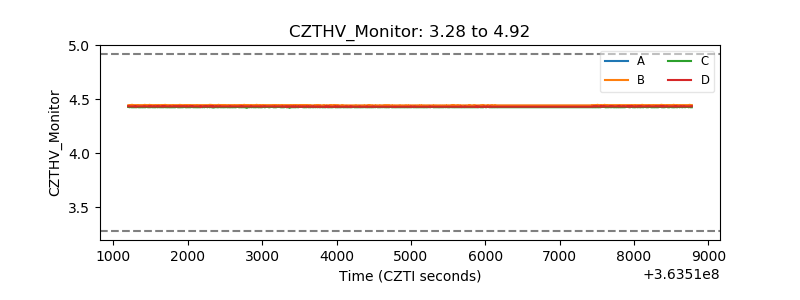 |
| D_VDD | 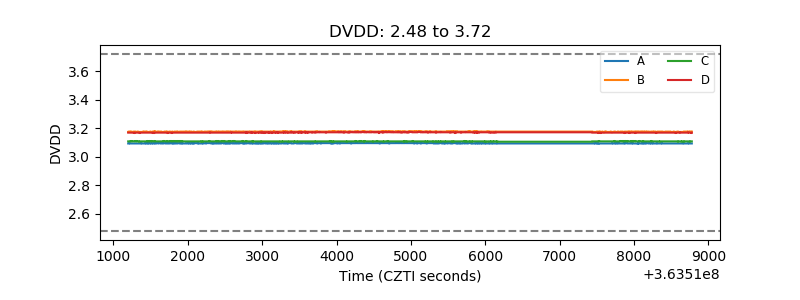 |
| Temperature 1 |  |
| Veto HV Monitor | 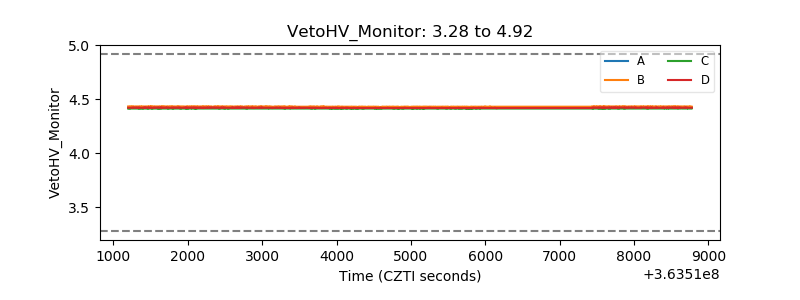 |
| Veto LLD |  |
| Alpha Counter | 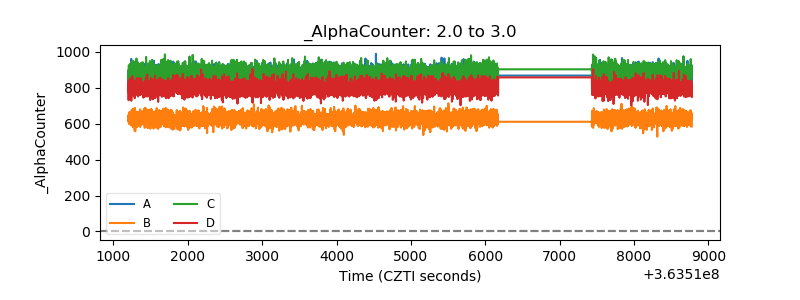 |
| _CPM_Rate | 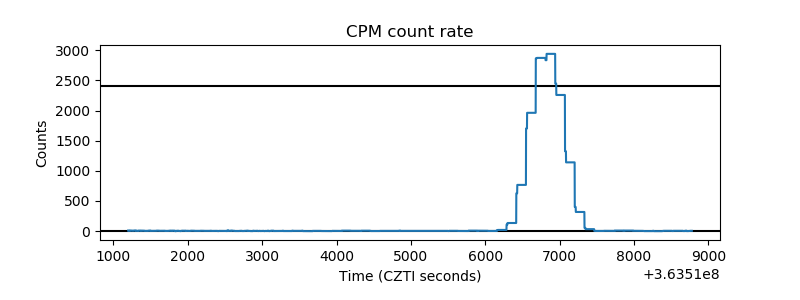 |
| CZT Counter | 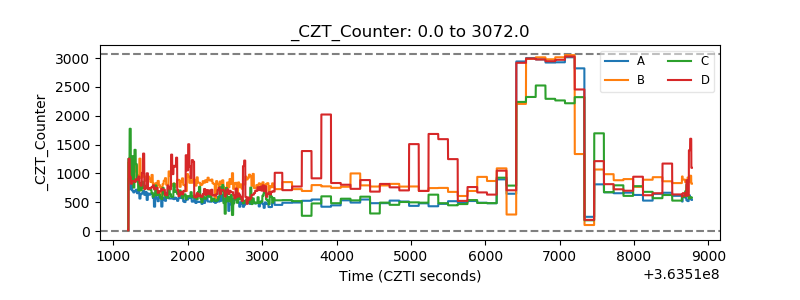 |
| +2.5 Volts monitor |  |
| +5 Volts monitor | 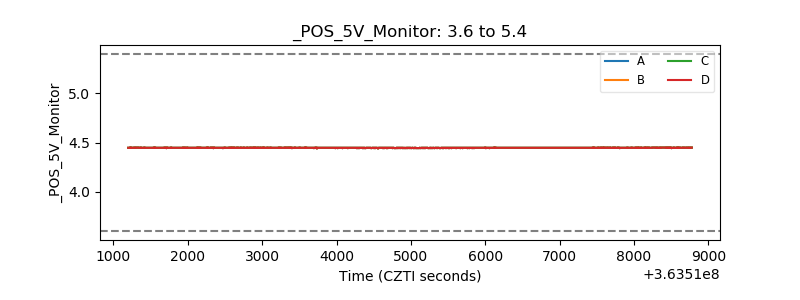 |
| _ROLL_ROT | 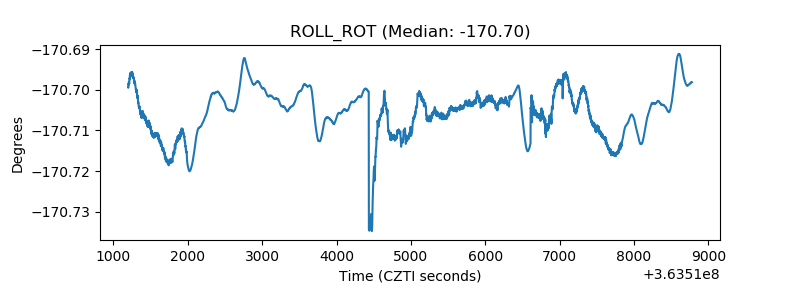 |
| _Roll_DEC | 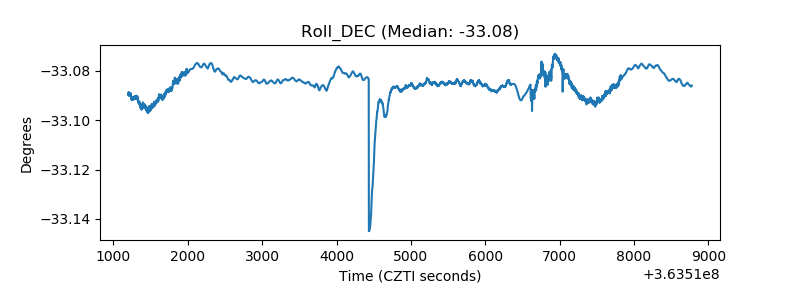 |
| _Roll_RA | 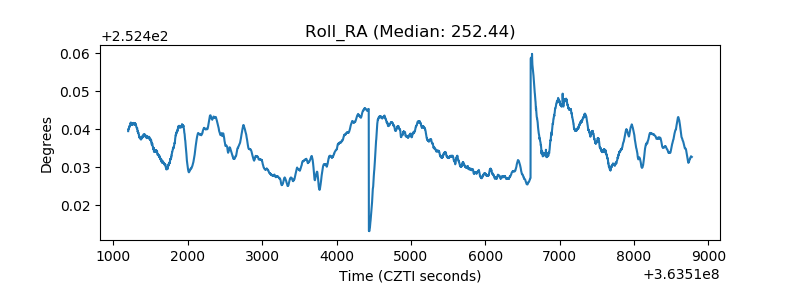 |
| Veto Counter | 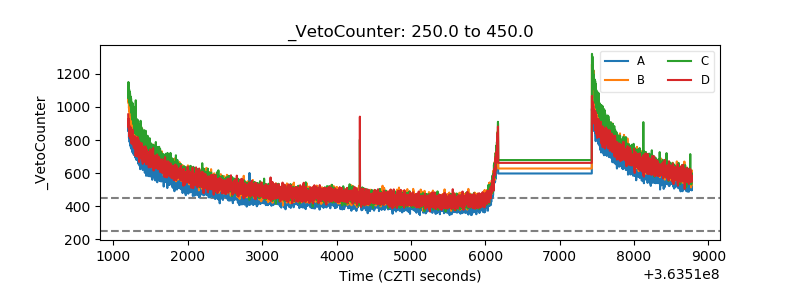 |