| Param | Original file | Final file |
|---|---|---|
| Filename | modeM0/AS1A10_073T02_9000004522_31251cztM0_level2.evt | modeM0/AS1A10_073T02_9000004522_31251cztM0_level2_quad_clean.evt |
| Size (bytes) | 585,432,000 | 82,742,400 |
| Size | 558.3 MB | 78.9 MB |
| Events in quadrant A | 3,304,861 | 542,478 |
| Events in quadrant B | 4,860,023 | 535,592 |
| Events in quadrant C | 4,092,209 | 518,334 |
| Events in quadrant D | 5,080,291 | 503,180 |
| Mode M9 | |||
|---|---|---|---|
| Quadrant | BADHDUFLAG | Total packets | Discarded packets |
| A | 0 | 17 | 0 |
| B | 0 | 17 | 0 |
| C | 0 | 18 | 1 |
| D | 0 | 18 | 1 |
| Mode SS | |||
|---|---|---|---|
| Quadrant | BADHDUFLAG | Total packets | Discarded packets |
| A | 0 | 130 | 14 |
| B | 0 | 130 | 10 |
| C | 0 | 130 | 10 |
| D | 0 | 131 | 11 |
| Mode M0 | |||
|---|---|---|---|
| Quadrant | BADHDUFLAG | Total packets | Discarded packets |
| A | 0 | 14681 | 1156 |
| B | 0 | 20183 | 1877 |
| C | 0 | 17915 | 1473 |
| D | 0 | 21609 | 2025 |
| Quadrant | Total seconds | Saturated seconds | Saturation percentage |
|---|---|---|---|
| A | 5867 | 90 | 1.534004% |
| B | 5769 | 197 | 3.414803% |
| C | 5822 | 275 | 4.723463% |
| D | 5771 | 158 | 2.737827% |
Noise dominated data is calculated using 1-second bins in cleaned event files. If a bin has >2000 counts, and if more than 50% of those come from <1% of pixels, then it is considered to be noise-dominated and hence unusable.
| Quadrant | # 1 sec bins | Bins with >0 counts | Bins with >2000 counts | High rate bins dominated by noise | Noise dominated (total time) | Noise dominated (detector-on time) | Marked lightcurve |
|---|---|---|---|---|---|---|---|
| A | 7612 | 6042 | 0 | 0 | 0.00% | 0.00% | 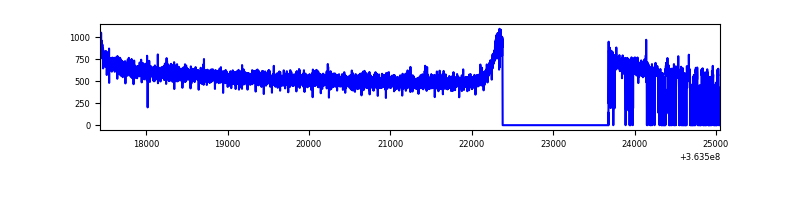 |
| B | 7600 | 5917 | 2 | 2 | 0.03% | 0.03% | 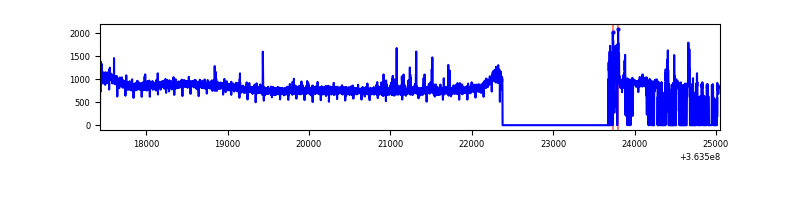 |
| C | 7616 | 5997 | 30 | 30 | 0.39% | 0.50% | 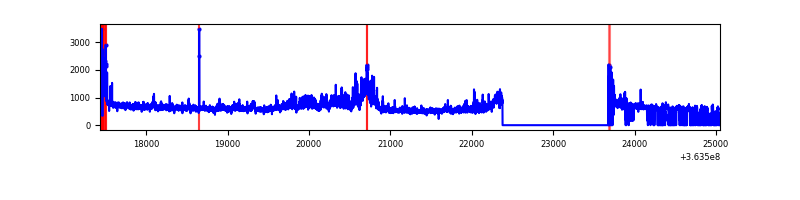 |
| D | 7599 | 5915 | 36 | 36 | 0.47% | 0.61% | 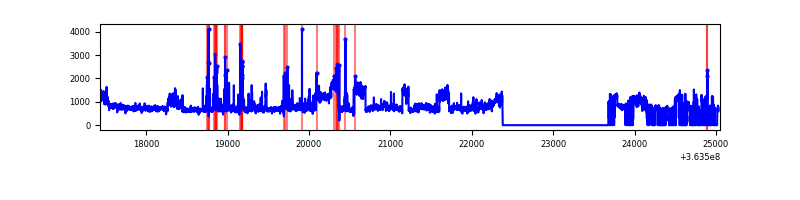 |
Top three noisy pixels from each quadrant. If the there are fewer than three noisy pixels in the level2.evt file, extra rows are filled as -1
| Pixel properties | Quadrant properties | ||||||
|---|---|---|---|---|---|---|---|
| Quadrant | DetID | PixID | Counts | Sigma | Mean | Median | Sigma |
| A | 13 | 254 | 10653 | 58.3 | 856 | 845 | 168.2 |
| A | 3 | 137 | 7706 | 40.78 | 856 | 845 | 168.2 |
| A | 0 | 226 | 7200 | 37.77 | 856 | 845 | 168.2 |
| B | 6 | 159 | 1506536 | 9861.31 | 822 | 806 | 152.7 |
| B | 15 | 33 | 66936 | 433.1 | 822 | 806 | 152.7 |
| B | 0 | 190 | 44142 | 283.82 | 822 | 806 | 152.7 |
| C | 3 | 233 | 628862 | 3428.98 | 803 | 811 | 183.2 |
| C | 0 | 10 | 148252 | 804.99 | 803 | 811 | 183.2 |
| C | 14 | 238 | 134478 | 729.78 | 803 | 811 | 183.2 |
| D | 8 | 195 | 1751085 | 8541.29 | 809 | 794 | 204.9 |
| D | 12 | 233 | 196239 | 953.76 | 809 | 794 | 204.9 |
| D | 2 | 250 | 61482 | 296.15 | 809 | 794 | 204.9 |
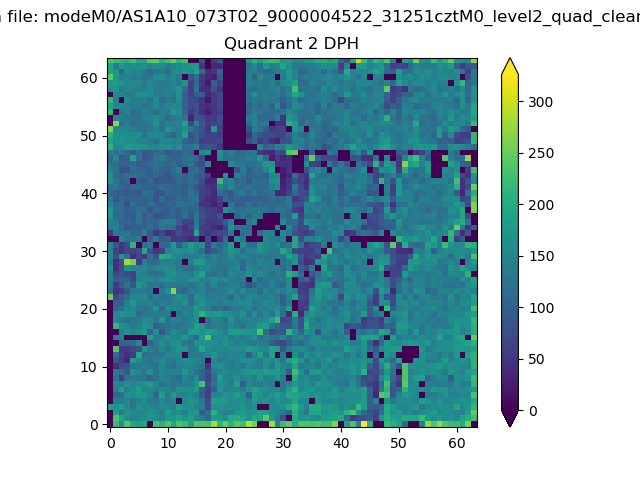
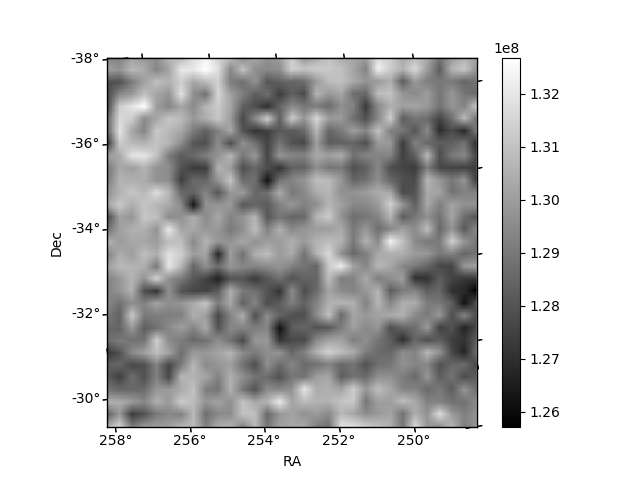
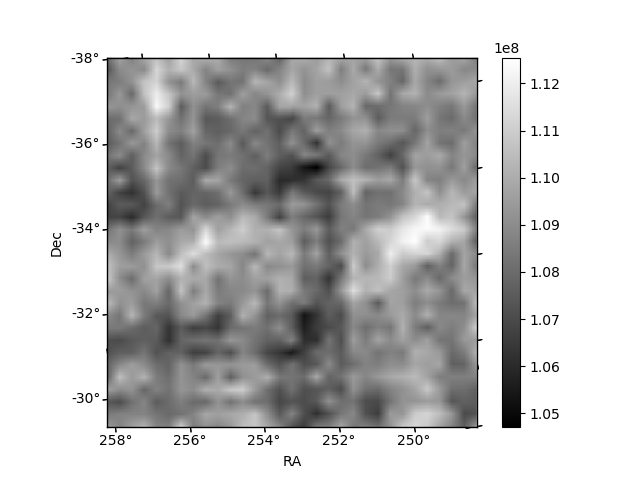
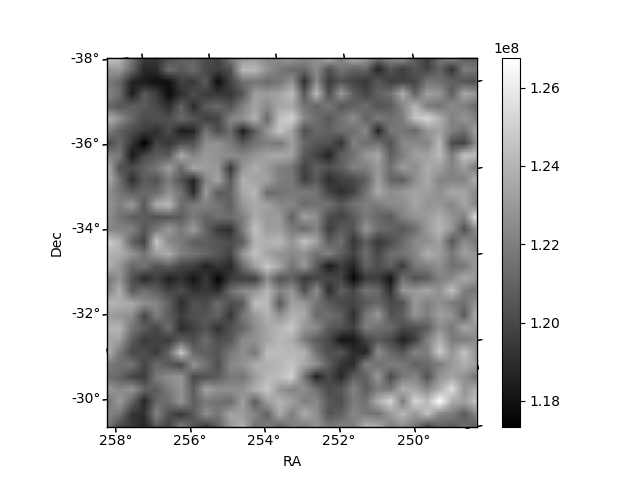
Histogram calculated using DETX and DETY for each event in the final _common_clean file
| Quadrant A | 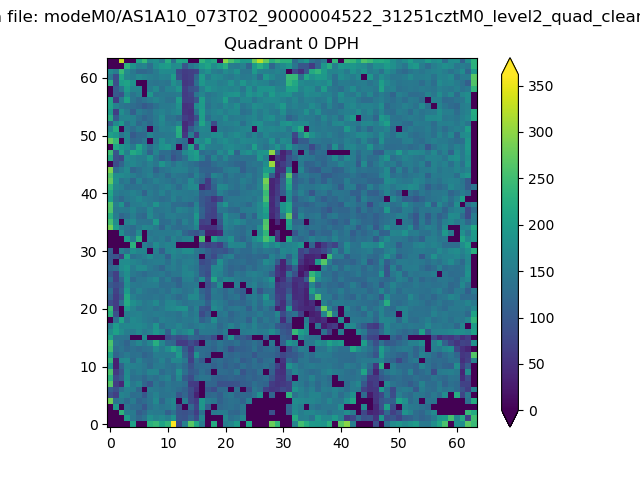 |
 |
Quadrant B |
|---|---|---|---|
| Quadrant D |  |
 |
Quadrant C |
| Plot type | Count rate plots | Images |
|---|---|---|
| Comparison with Poisson distribution Blue bars denote a histogram of data divided into 1 sec bins. Red curve is a Poisson curve with rate = median count rate of data. |
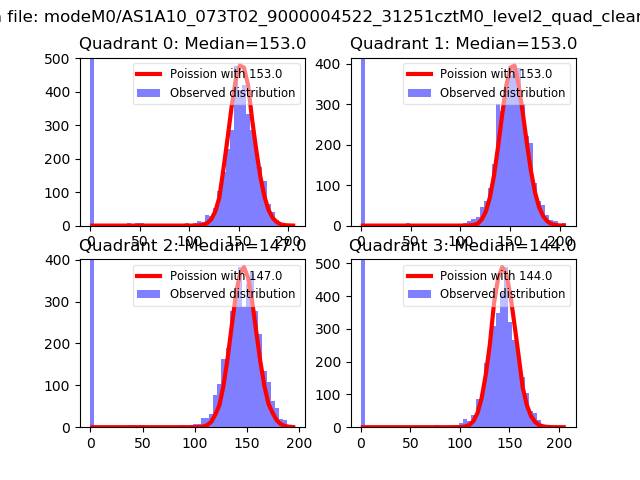 |
 |
| Quadrant-wise count rates Data is divided into 100 sec bins |
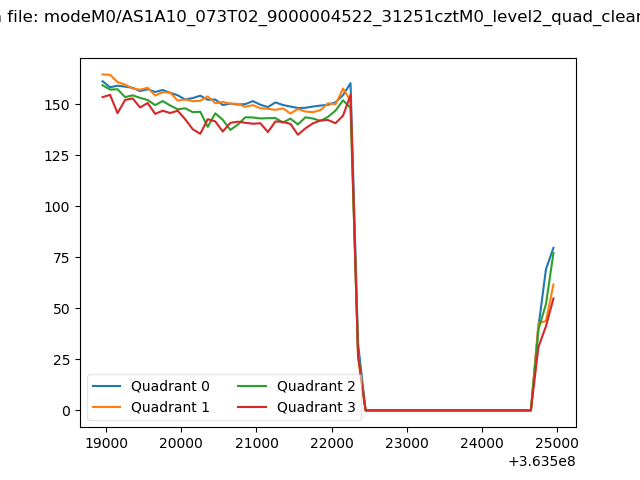 |
|
| Module-wise count rates for Quadrant A Data is divided into 100 sec bins |
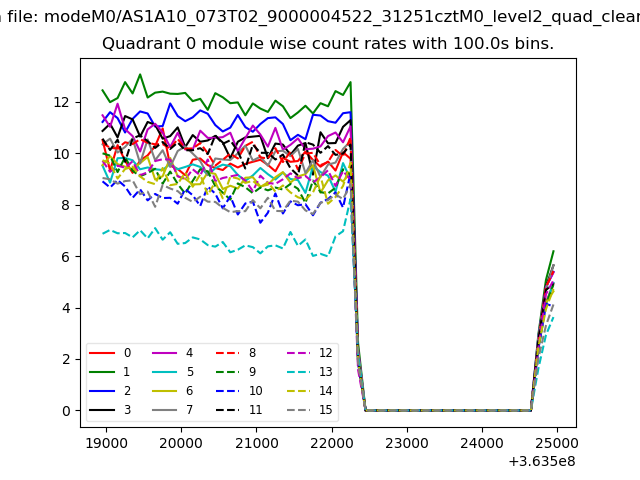 |
 |
| Module-wise count rates for Quadrant B Data is divided into 100 sec bins |
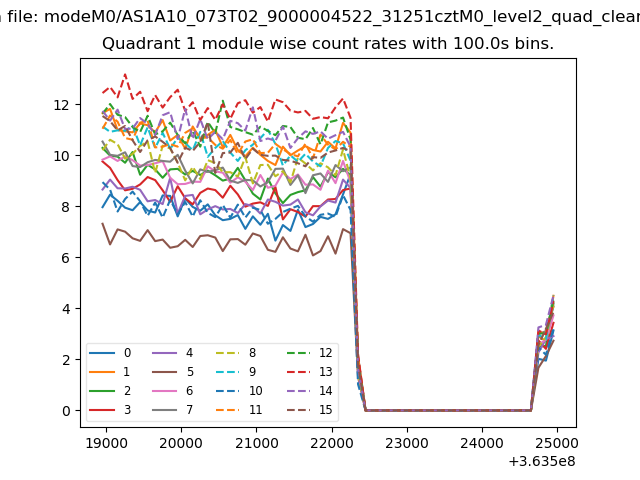 |
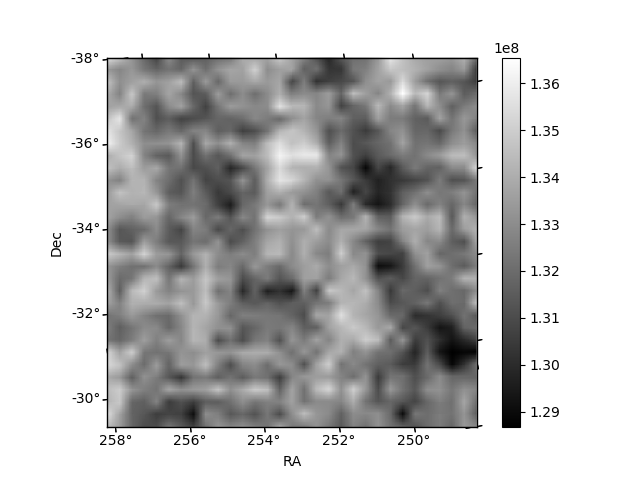 |
| Module-wise count rates for Quadrant C Data is divided into 100 sec bins |
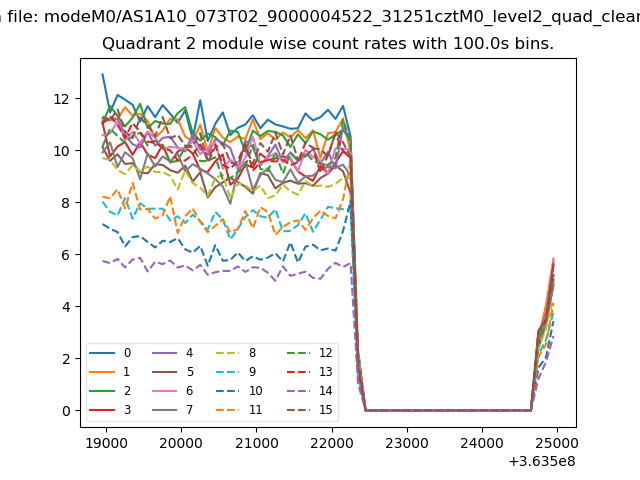 |
 |
| Module-wise count rates for Quadrant D Data is divided into 100 sec bins |
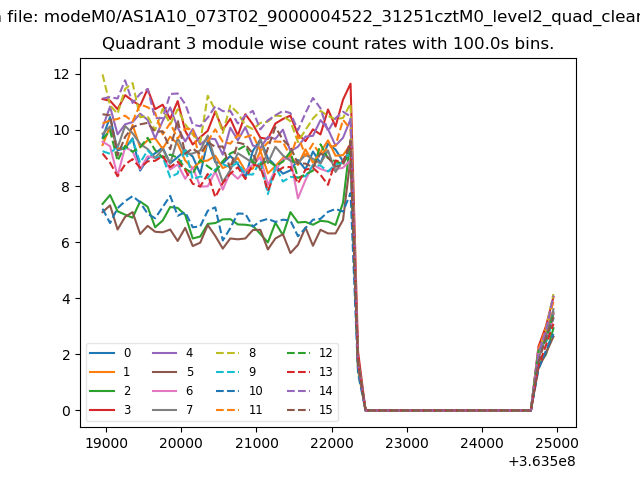 |
 |
| Parameter | Plot |
|---|---|
| CZT HV Monitor |  |
| D_VDD | 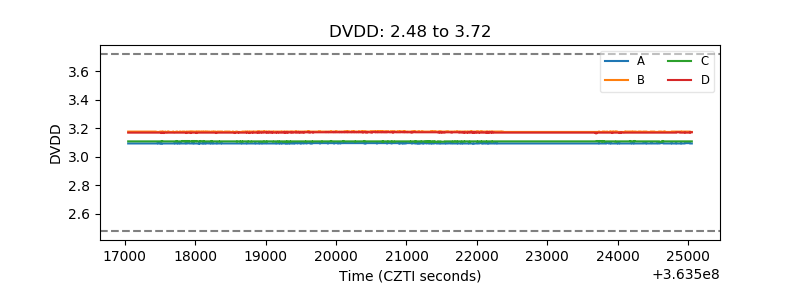 |
| Temperature 1 | 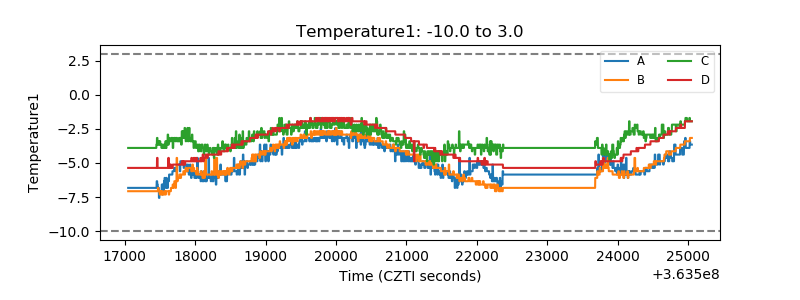 |
| Veto HV Monitor | 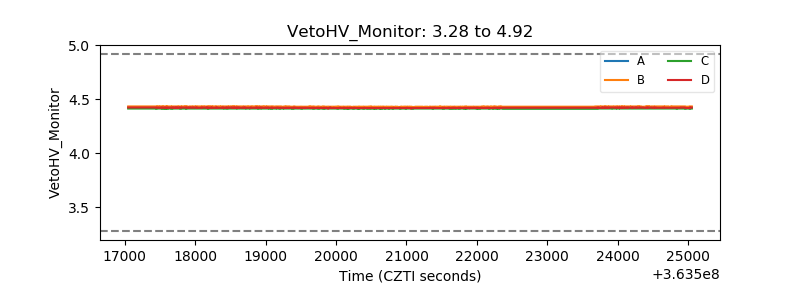 |
| Veto LLD | 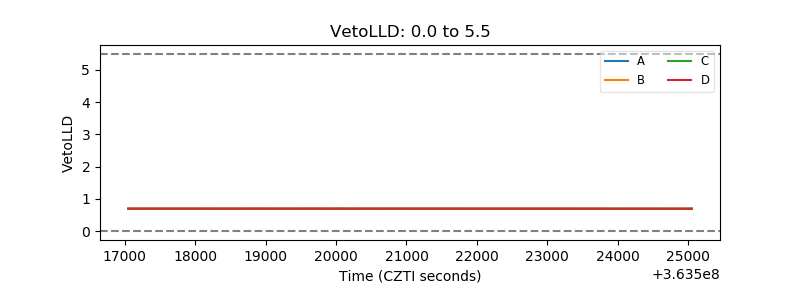 |
| Alpha Counter | 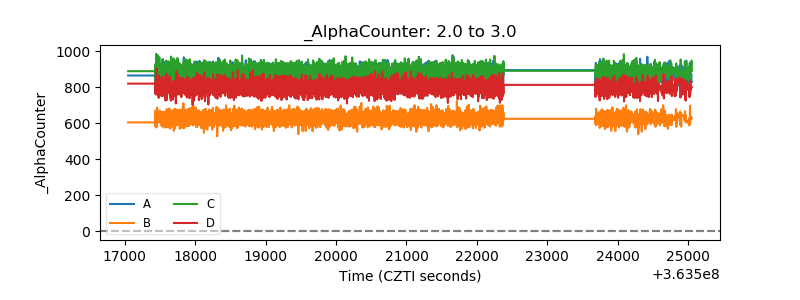 |
| _CPM_Rate | 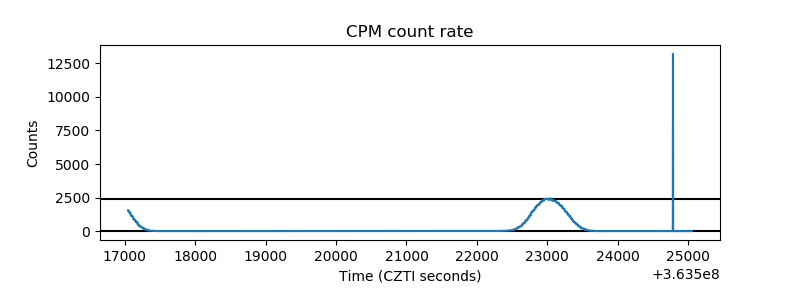 |
| CZT Counter | 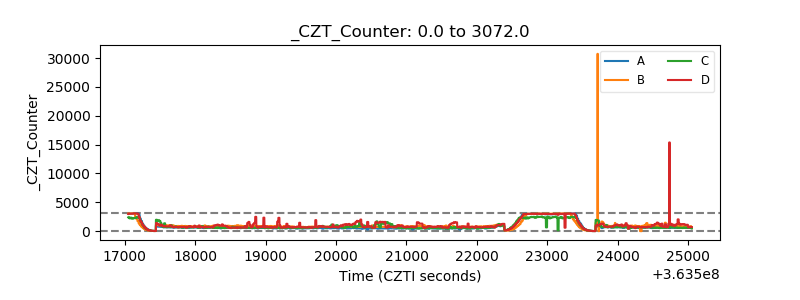 |
| +2.5 Volts monitor |  |
| +5 Volts monitor | 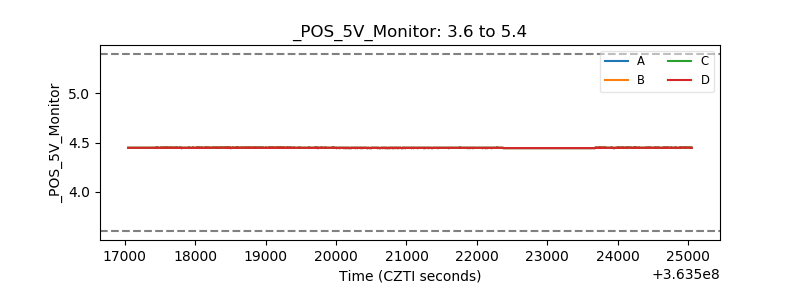 |
| _ROLL_ROT | 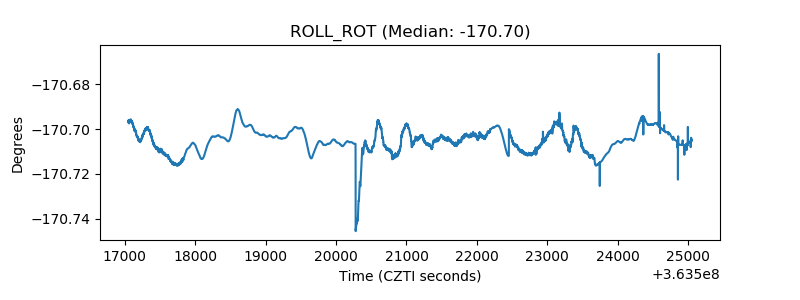 |
| _Roll_DEC | 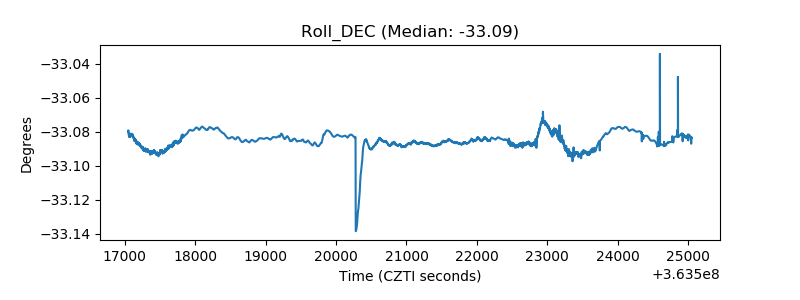 |
| _Roll_RA | 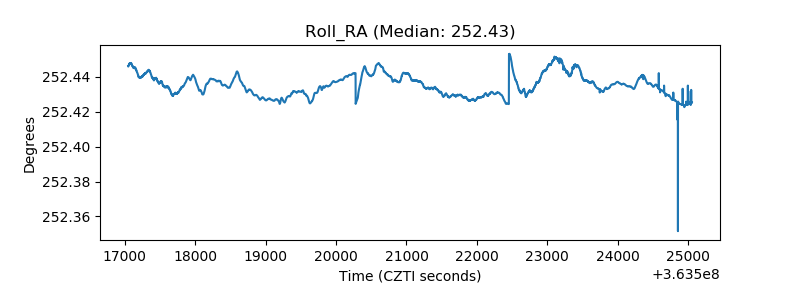 |
| Veto Counter | 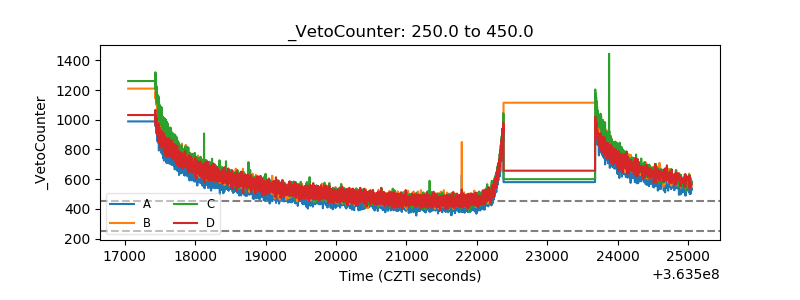 |