| Param | Original file | Final file |
|---|---|---|
| Filename | modeM0/AS1A10_073T02_9000004522_31252cztM0_level2.evt | modeM0/AS1A10_073T02_9000004522_31252cztM0_level2_quad_clean.evt |
| Size (bytes) | 267,122,880 | 44,841,600 |
| Size | 254.7 MB | 42.8 MB |
| Events in quadrant A | 1,550,167 | 299,517 |
| Events in quadrant B | 2,306,943 | 297,592 |
| Events in quadrant C | 1,775,386 | 284,943 |
| Events in quadrant D | 2,271,632 | 281,220 |
| Mode M9 | |||
|---|---|---|---|
| Quadrant | BADHDUFLAG | Total packets | Discarded packets |
| A | 0 | 13 | 0 |
| B | 0 | 13 | 0 |
| C | 0 | 13 | 0 |
| D | 0 | 14 | 1 |
| Mode SS | |||
|---|---|---|---|
| Quadrant | BADHDUFLAG | Total packets | Discarded packets |
| A | 0 | 58 | 0 |
| B | 0 | 58 | 0 |
| C | 0 | 58 | 0 |
| D | 0 | 58 | 0 |
| Mode M0 | |||
|---|---|---|---|
| Quadrant | BADHDUFLAG | Total packets | Discarded packets |
| A | 0 | 6368 | 4 |
| B | 0 | 8681 | 12 |
| C | 0 | 7138 | 24 |
| D | 0 | 8959 | 31 |
| Quadrant | Total seconds | Saturated seconds | Saturation percentage |
|---|---|---|---|
| A | 2713 | 78 | 2.875046% |
| B | 2711 | 149 | 5.496127% |
| C | 2710 | 213 | 7.859779% |
| D | 2709 | 144 | 5.315615% |
Noise dominated data is calculated using 1-second bins in cleaned event files. If a bin has >2000 counts, and if more than 50% of those come from <1% of pixels, then it is considered to be noise-dominated and hence unusable.
| Quadrant | # 1 sec bins | Bins with >0 counts | Bins with >2000 counts | High rate bins dominated by noise | Noise dominated (total time) | Noise dominated (detector-on time) | Marked lightcurve |
|---|---|---|---|---|---|---|---|
| A | 4299 | 2720 | 0 | 0 | 0.00% | 0.00% | 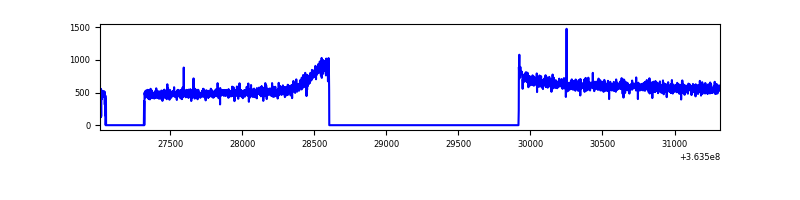 |
| B | 4298 | 2718 | 1 | 1 | 0.02% | 0.04% | 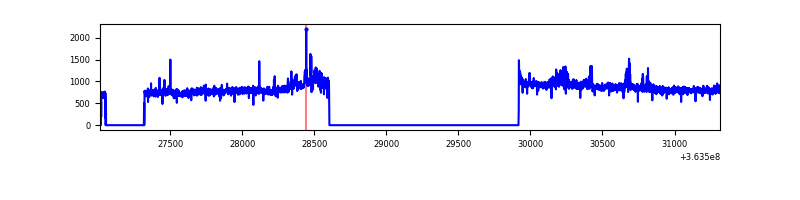 |
| C | 4302 | 2718 | 17 | 17 | 0.40% | 0.63% | 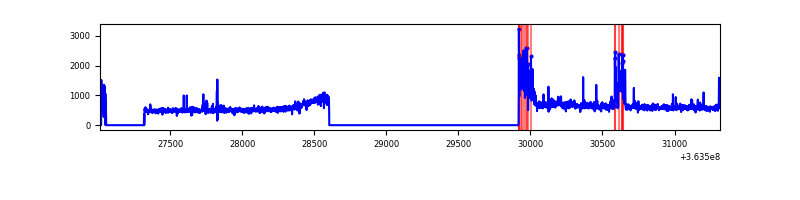 |
| D | 4302 | 2717 | 14 | 14 | 0.33% | 0.52% | 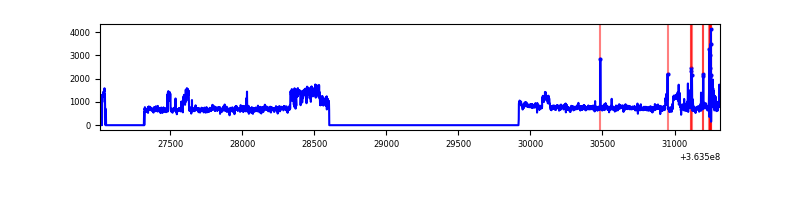 |
Top three noisy pixels from each quadrant. If the there are fewer than three noisy pixels in the level2.evt file, extra rows are filled as -1
| Pixel properties | Quadrant properties | ||||||
|---|---|---|---|---|---|---|---|
| Quadrant | DetID | PixID | Counts | Sigma | Mean | Median | Sigma |
| A | 13 | 254 | 4966 | 56.38 | 401 | 394 | 81.1 |
| A | 3 | 137 | 3789 | 41.87 | 401 | 394 | 81.1 |
| A | 0 | 226 | 3396 | 37.02 | 401 | 394 | 81.1 |
| B | 6 | 159 | 699030 | 9345.11 | 389 | 380 | 74.8 |
| B | 0 | 190 | 48103 | 638.34 | 389 | 380 | 74.8 |
| B | 15 | 33 | 19982 | 262.2 | 389 | 380 | 74.8 |
| C | 0 | 10 | 134076 | 1532.23 | 375 | 379 | 87.3 |
| C | 14 | 238 | 65870 | 750.56 | 375 | 379 | 87.3 |
| C | 10 | 22 | 47730 | 542.66 | 375 | 379 | 87.3 |
| D | 8 | 195 | 731735 | 7258.42 | 384 | 375 | 100.8 |
| D | 2 | 250 | 53384 | 526.09 | 384 | 375 | 100.8 |
| D | 12 | 233 | 23508 | 229.58 | 384 | 375 | 100.8 |
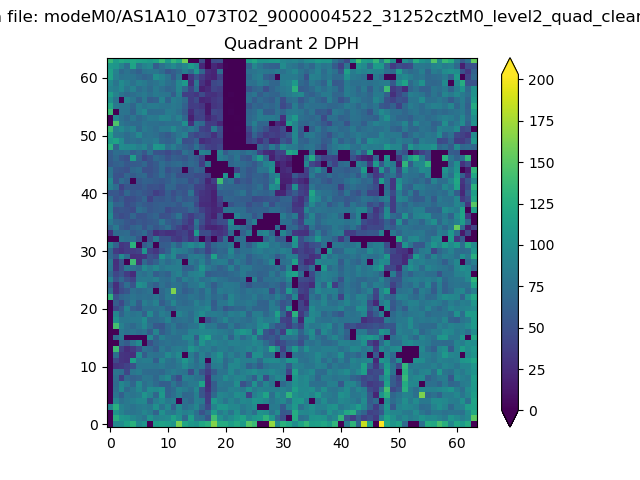
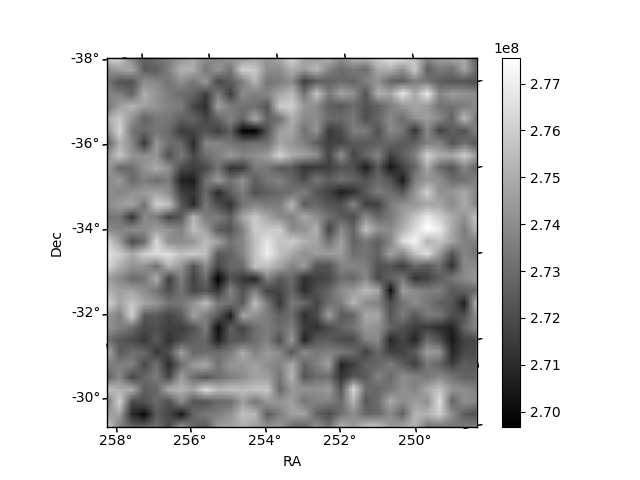
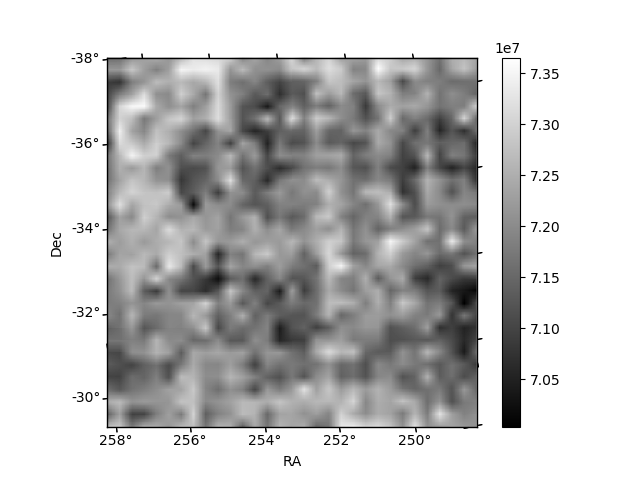
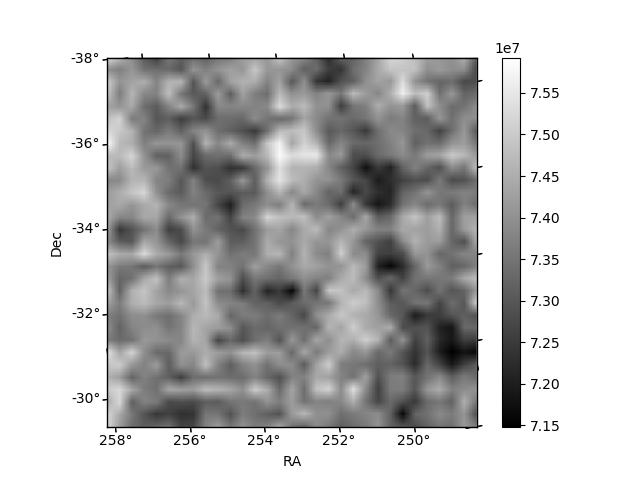
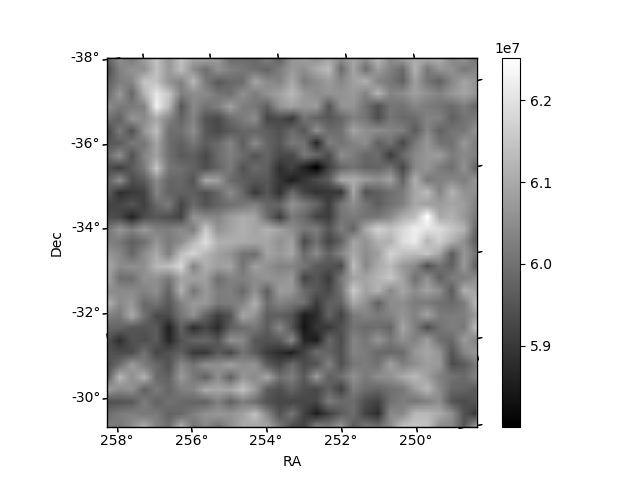
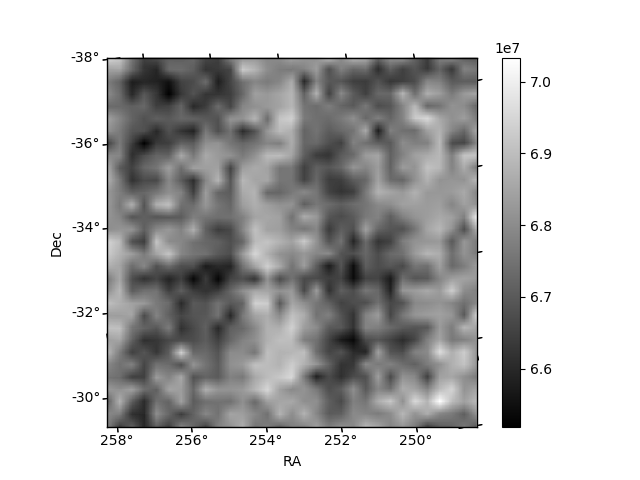
Histogram calculated using DETX and DETY for each event in the final _common_clean file
| Quadrant A | 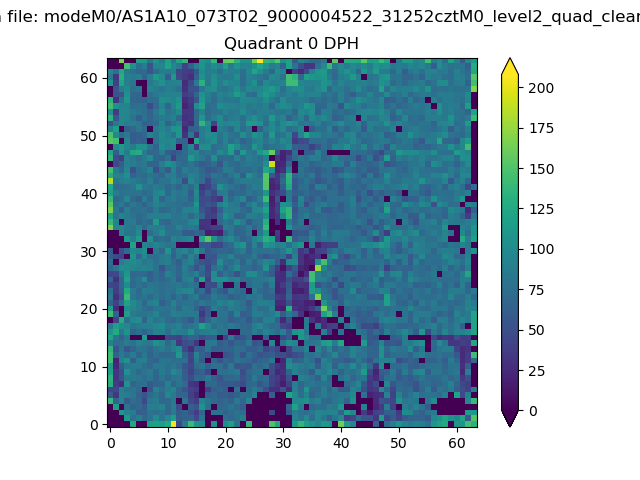 |
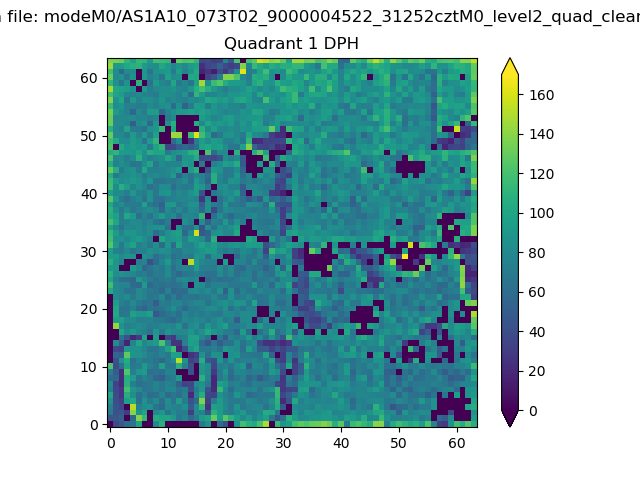 |
Quadrant B |
|---|---|---|---|
| Quadrant D | 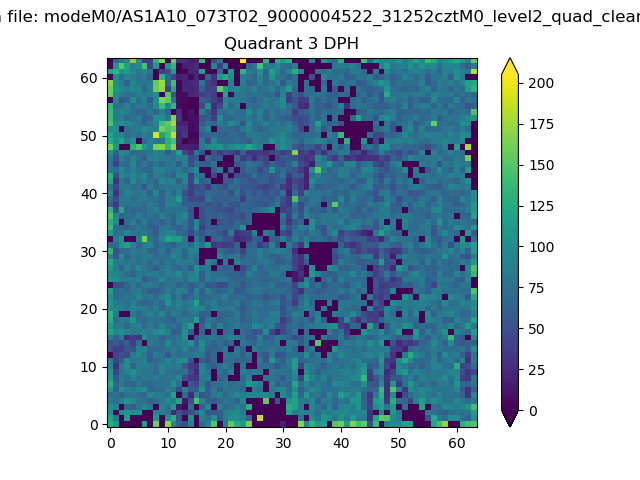 |
 |
Quadrant C |
| Plot type | Count rate plots | Images |
|---|---|---|
| Comparison with Poisson distribution Blue bars denote a histogram of data divided into 1 sec bins. Red curve is a Poisson curve with rate = median count rate of data. |
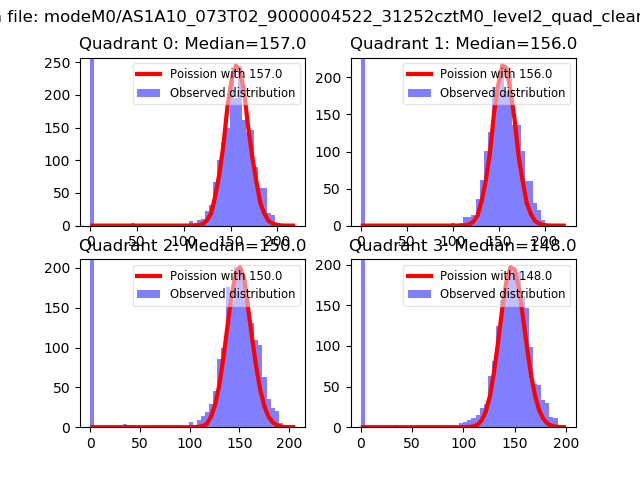 |
 |
| Quadrant-wise count rates Data is divided into 100 sec bins |
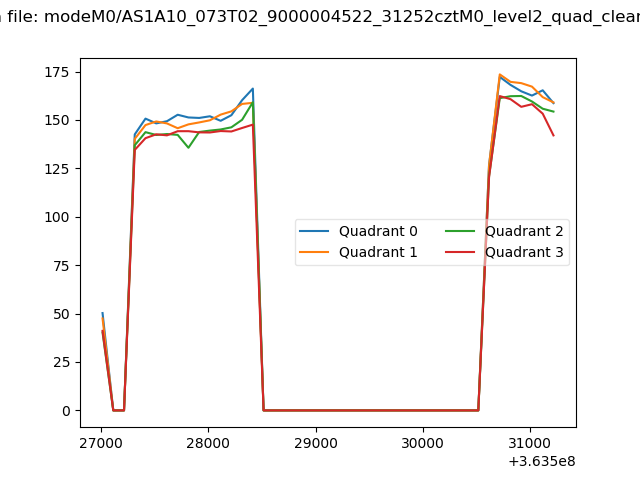 |
|
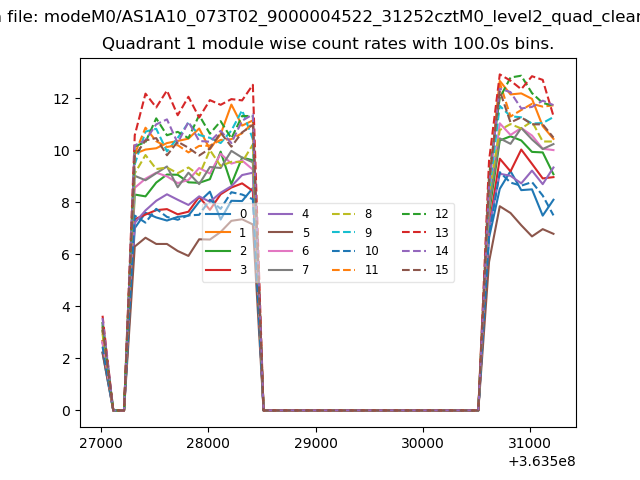
| Module-wise count rates for Quadrant A Data is divided into 100 sec bins |
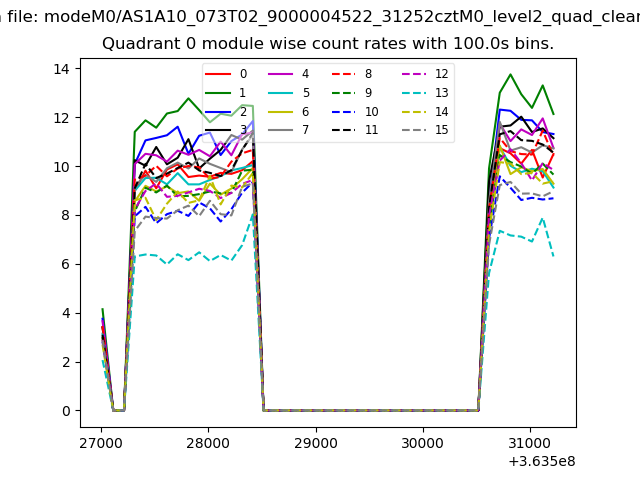 |
 |
| Module-wise count rates for Quadrant B Data is divided into 100 sec bins |
 |
 |
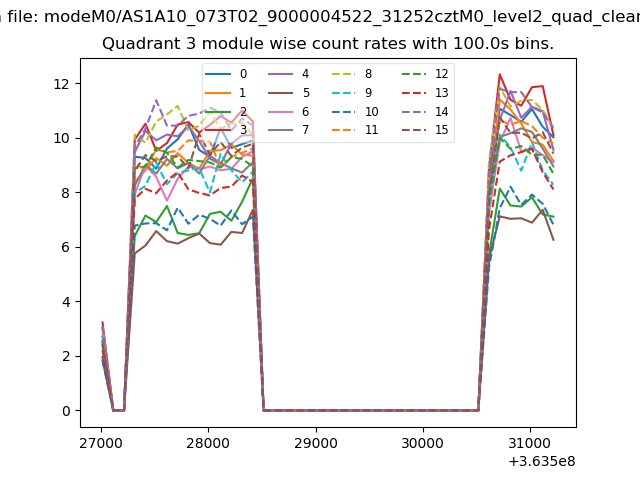
| Module-wise count rates for Quadrant C Data is divided into 100 sec bins |
 |
 |
| Module-wise count rates for Quadrant D Data is divided into 100 sec bins |
 |
 |
| Parameter | Plot |
|---|---|
| CZT HV Monitor |  |
| D_VDD | 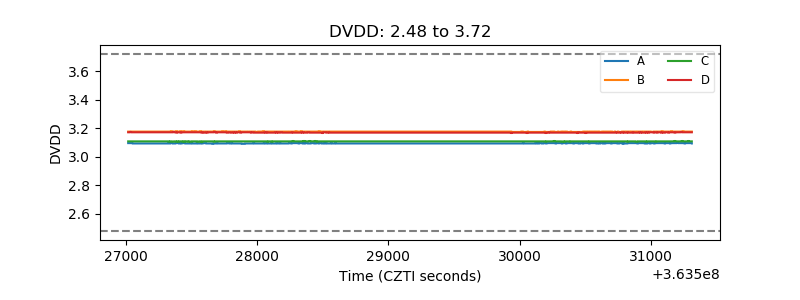 |
| Temperature 1 | 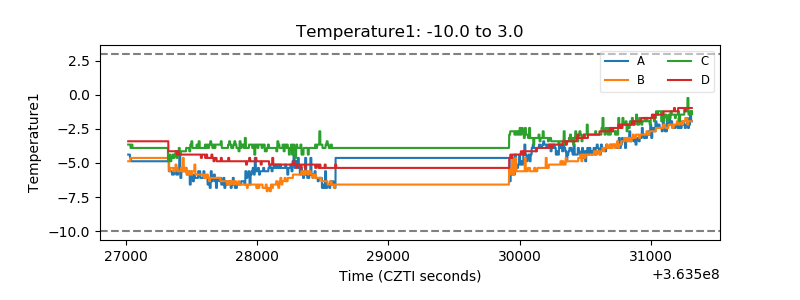 |
| Veto HV Monitor | 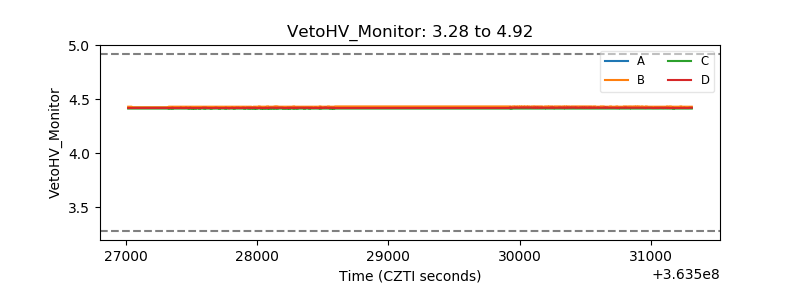 |
| Veto LLD | 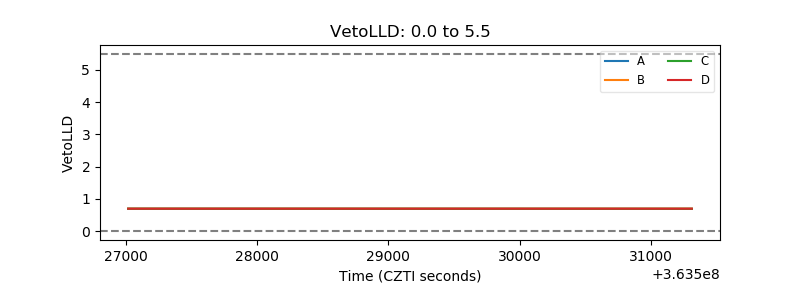 |
| Alpha Counter | 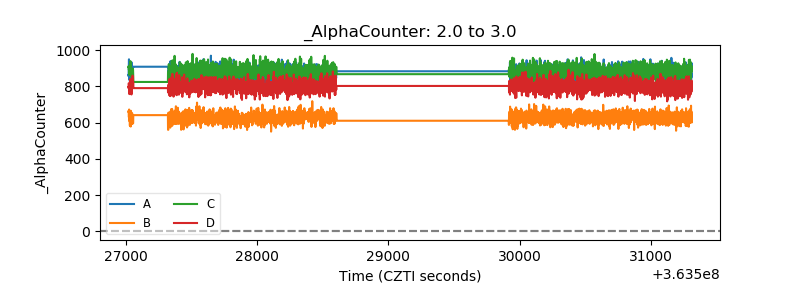 |
| _CPM_Rate | 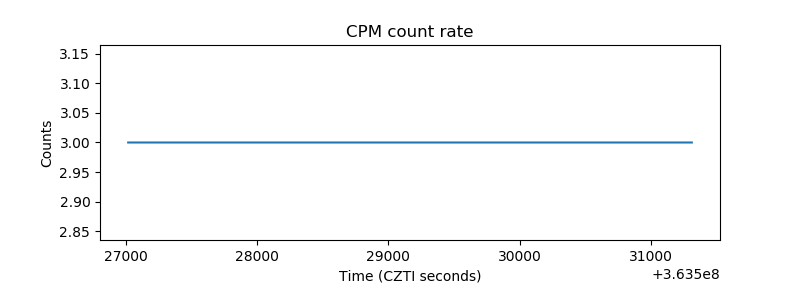 |
| CZT Counter | 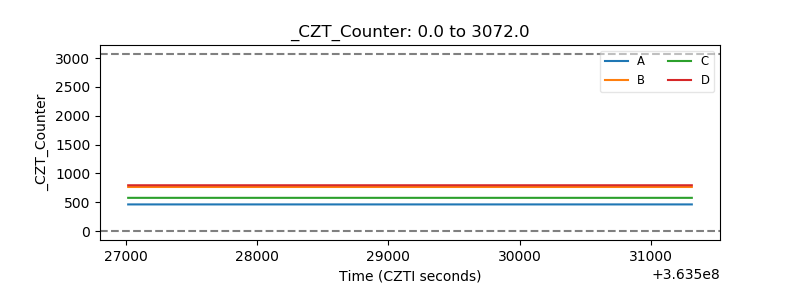 |
| +2.5 Volts monitor |  |
| +5 Volts monitor | 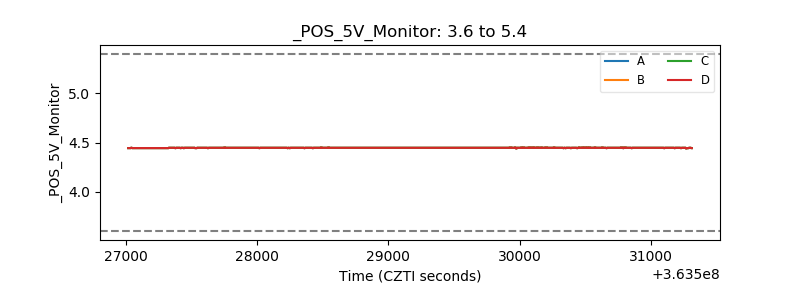 |
| _ROLL_ROT | 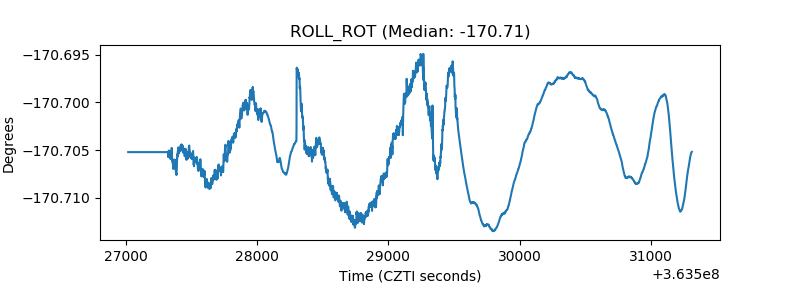 |
| _Roll_DEC | 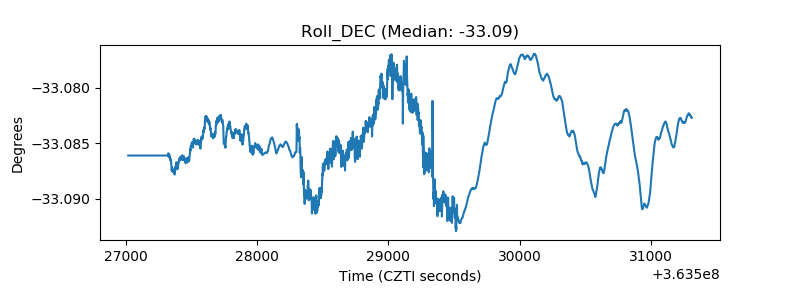 |
| _Roll_RA | 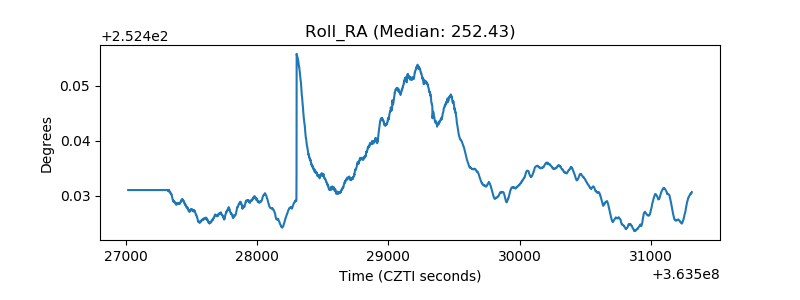 |
| Veto Counter | 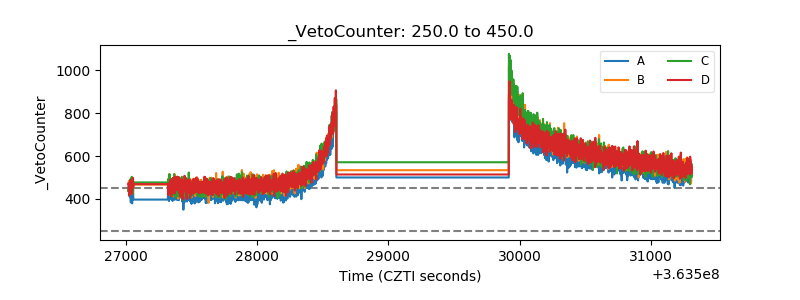 |