| Param | Original file | Final file |
|---|---|---|
| Filename | modeM0/AS1A10_073T02_9000004522_31253cztM0_level2.evt | modeM0/AS1A10_073T02_9000004522_31253cztM0_level2_quad_clean.evt |
| Size (bytes) | 583,793,280 | 105,762,240 |
| Size | 556.7 MB | 100.9 MB |
| Events in quadrant A | 3,394,170 | 714,686 |
| Events in quadrant B | 5,194,564 | 708,095 |
| Events in quadrant C | 4,183,321 | 667,171 |
| Events in quadrant D | 4,480,926 | 672,501 |
| Mode M9 | |||
|---|---|---|---|
| Quadrant | BADHDUFLAG | Total packets | Discarded packets |
| A | 0 | 12 | 0 |
| B | 0 | 13 | 0 |
| C | 0 | 13 | 0 |
| D | 0 | 13 | 0 |
| Mode SS | |||
|---|---|---|---|
| Quadrant | BADHDUFLAG | Total packets | Discarded packets |
| A | 0 | 128 | 0 |
| B | 0 | 128 | 0 |
| C | 0 | 128 | 0 |
| D | 0 | 128 | 0 |
| Mode M0 | |||
|---|---|---|---|
| Quadrant | BADHDUFLAG | Total packets | Discarded packets |
| A | 0 | 13964 | 2 |
| B | 0 | 19758 | 2 |
| C | 0 | 16644 | 2 |
| D | 0 | 17733 | 2 |
| Quadrant | Total seconds | Saturated seconds | Saturation percentage |
|---|---|---|---|
| A | 6315 | 106 | 1.678543% |
| B | 6315 | 195 | 3.087886% |
| C | 6315 | 487 | 7.711797% |
| D | 6315 | 204 | 3.230404% |
Noise dominated data is calculated using 1-second bins in cleaned event files. If a bin has >2000 counts, and if more than 50% of those come from <1% of pixels, then it is considered to be noise-dominated and hence unusable.
| Quadrant | # 1 sec bins | Bins with >0 counts | Bins with >2000 counts | High rate bins dominated by noise | Noise dominated (total time) | Noise dominated (detector-on time) | Marked lightcurve |
|---|---|---|---|---|---|---|---|
| A | 7525 | 6316 | 0 | 0 | 0.00% | 0.00% | 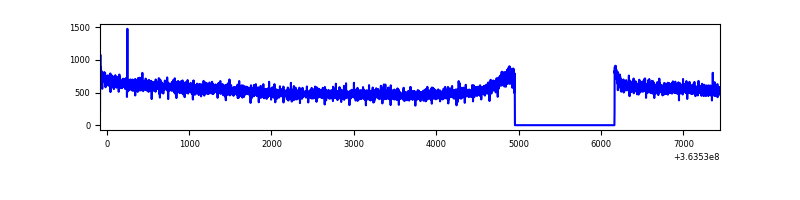 |
| B | 7525 | 6316 | 2 | 2 | 0.03% | 0.03% | 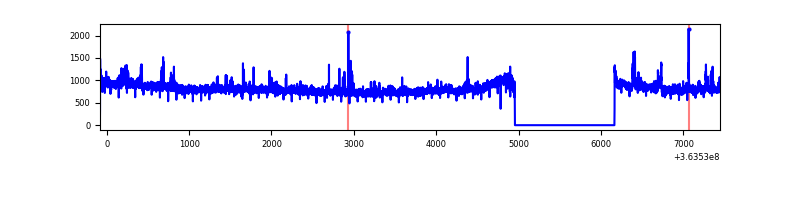 |
| C | 7525 | 6316 | 172 | 172 | 2.29% | 2.72% | 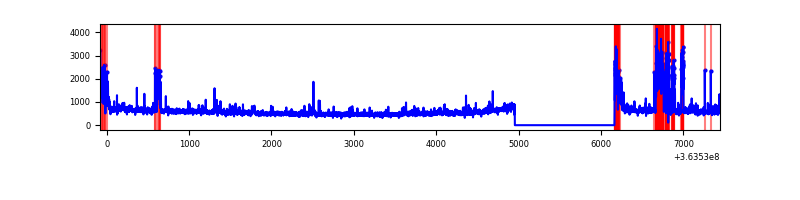 |
| D | 7525 | 6316 | 87 | 87 | 1.16% | 1.38% | 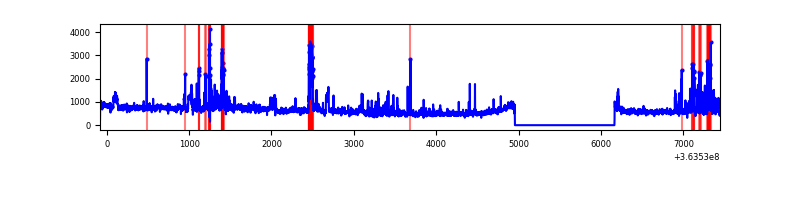 |
Top three noisy pixels from each quadrant. If the there are fewer than three noisy pixels in the level2.evt file, extra rows are filled as -1
| Pixel properties | Quadrant properties | ||||||
|---|---|---|---|---|---|---|---|
| Quadrant | DetID | PixID | Counts | Sigma | Mean | Median | Sigma |
| A | 13 | 254 | 12784 | 68.45 | 879 | 864 | 174.2 |
| A | 3 | 137 | 8260 | 42.47 | 879 | 864 | 174.2 |
| A | 0 | 226 | 7480 | 37.99 | 879 | 864 | 174.2 |
| B | 6 | 159 | 1669053 | 10420.93 | 854 | 832 | 160.1 |
| B | 0 | 190 | 90078 | 557.5 | 854 | 832 | 160.1 |
| B | 15 | 33 | 21267 | 127.65 | 854 | 832 | 160.1 |
| C | 2 | 16 | 403561 | 2175.67 | 805 | 813 | 185.1 |
| C | 0 | 10 | 269077 | 1449.18 | 805 | 813 | 185.1 |
| C | 3 | 233 | 148897 | 799.96 | 805 | 813 | 185.1 |
| D | 8 | 195 | 803690 | 3654.9 | 838 | 825 | 219.7 |
| D | 12 | 233 | 279840 | 1270.17 | 838 | 825 | 219.7 |
| D | 2 | 250 | 182190 | 825.63 | 838 | 825 | 219.7 |
Histogram calculated using DETX and DETY for each event in the final _common_clean file
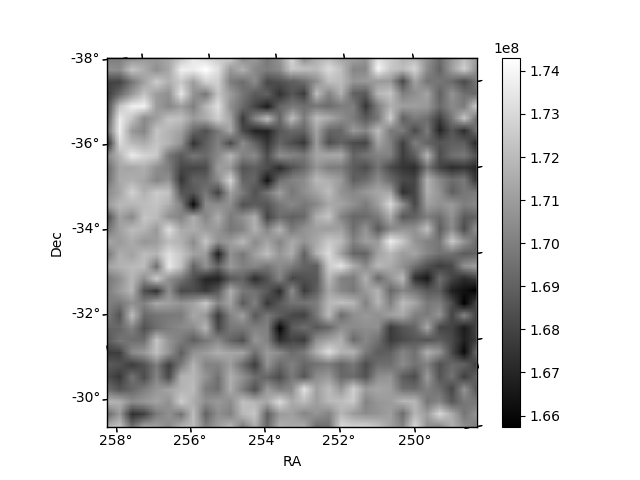
| Quadrant A | 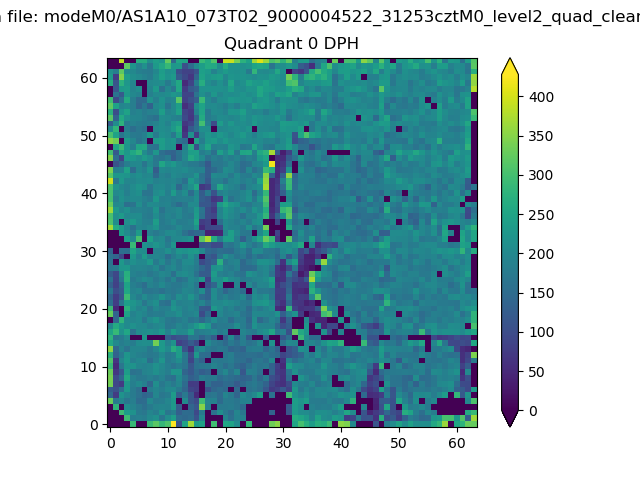 |
 |
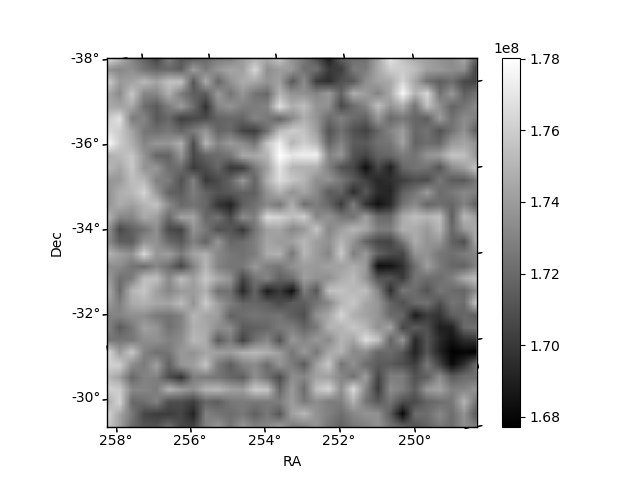
Quadrant B |
|---|---|---|---|
| Quadrant D | 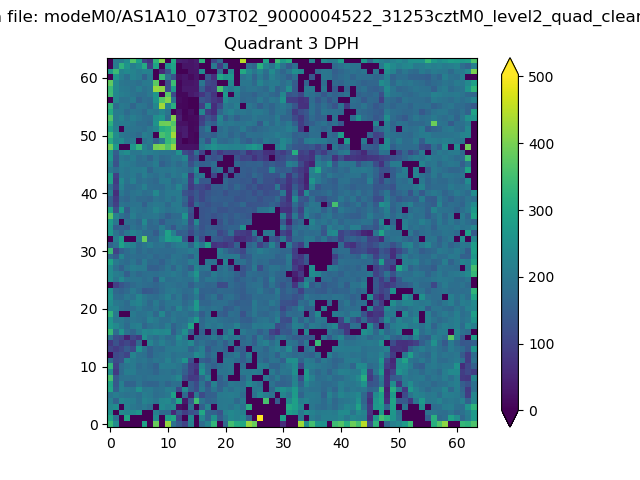 |
 |
Quadrant C |
| Plot type | Count rate plots | Images |
|---|---|---|
| Comparison with Poisson distribution Blue bars denote a histogram of data divided into 1 sec bins. Red curve is a Poisson curve with rate = median count rate of data. |
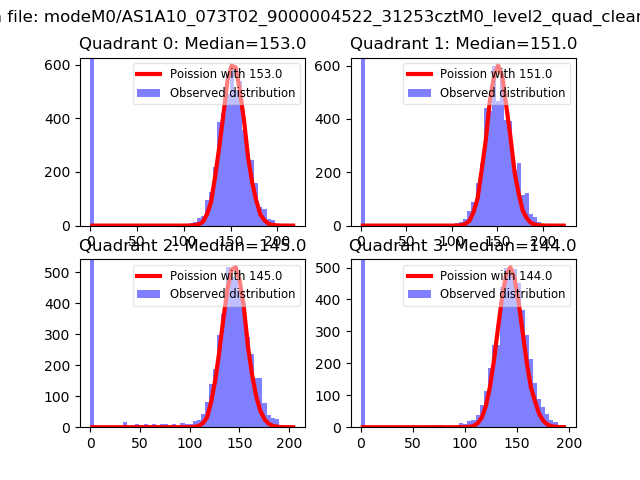 |
 |
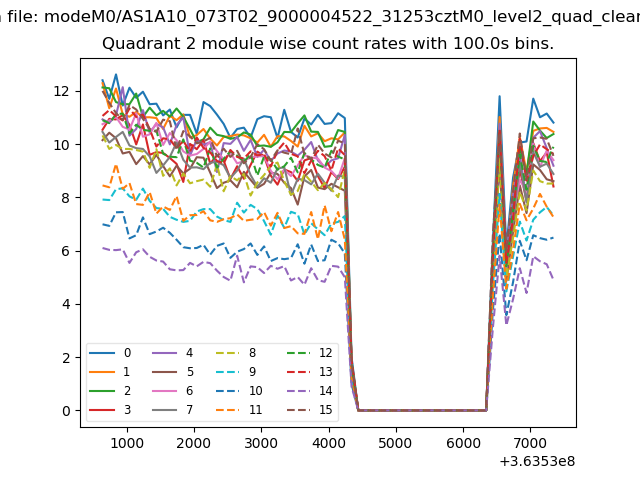
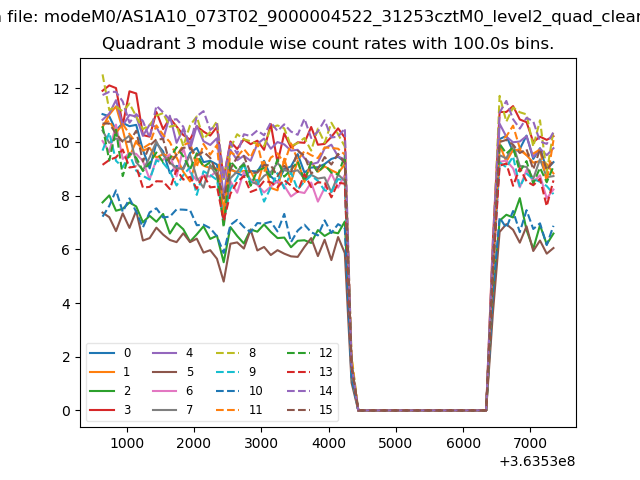
| Quadrant-wise count rates Data is divided into 100 sec bins |
 |
|
| Module-wise count rates for Quadrant A Data is divided into 100 sec bins |
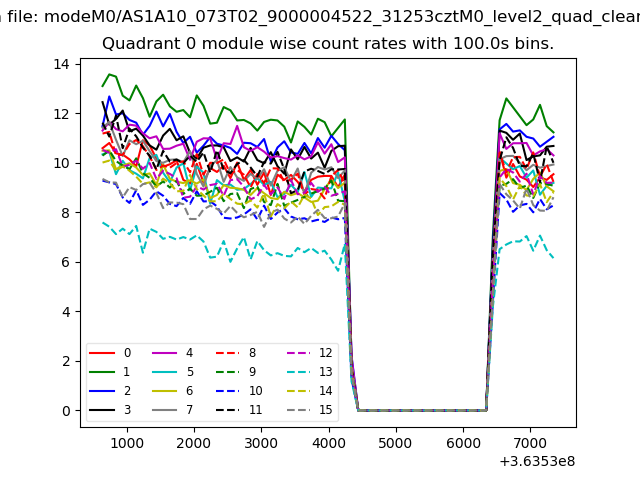 |
 |
| Module-wise count rates for Quadrant B Data is divided into 100 sec bins |
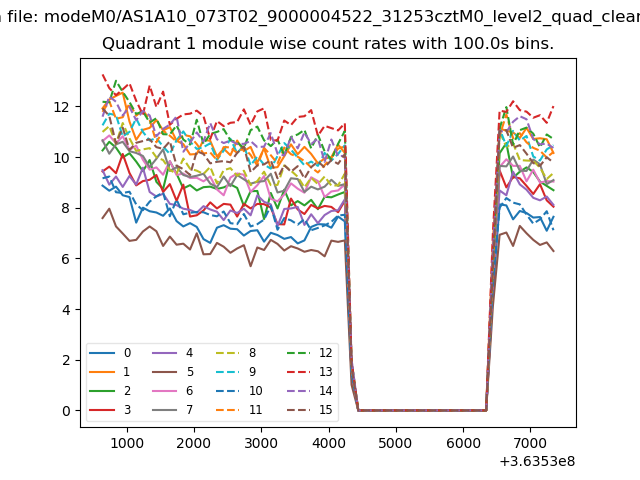 |
 |
| Module-wise count rates for Quadrant C Data is divided into 100 sec bins |
 |
 |
| Module-wise count rates for Quadrant D Data is divided into 100 sec bins |
 |
 |
| Parameter | Plot |
|---|---|
| CZT HV Monitor | 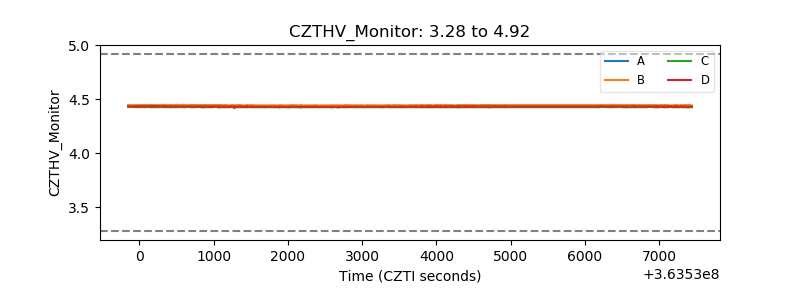 |
| D_VDD | 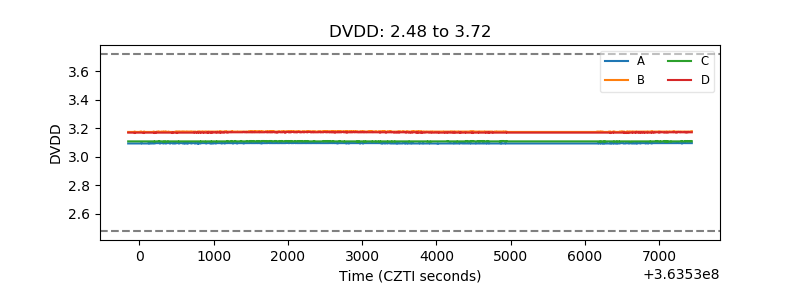 |
| Temperature 1 | 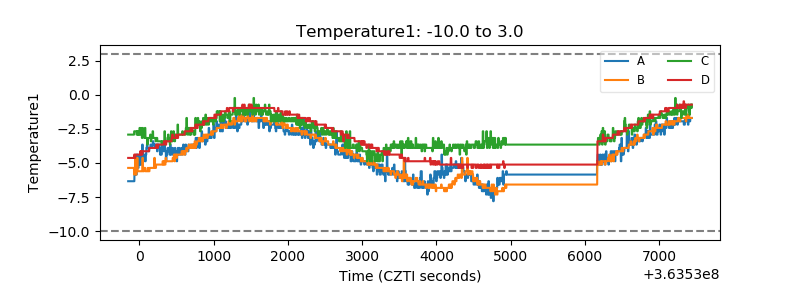 |
| Veto HV Monitor | 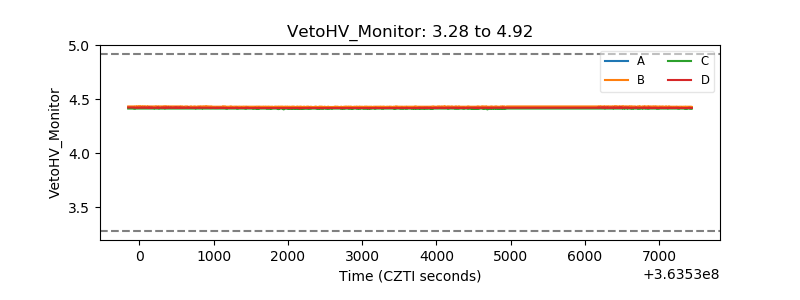 |
| Veto LLD | 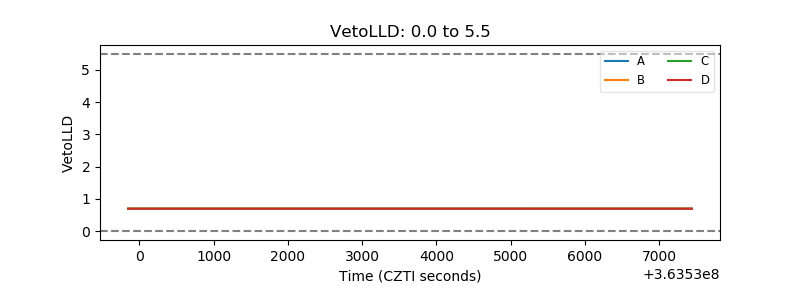 |
| Alpha Counter | 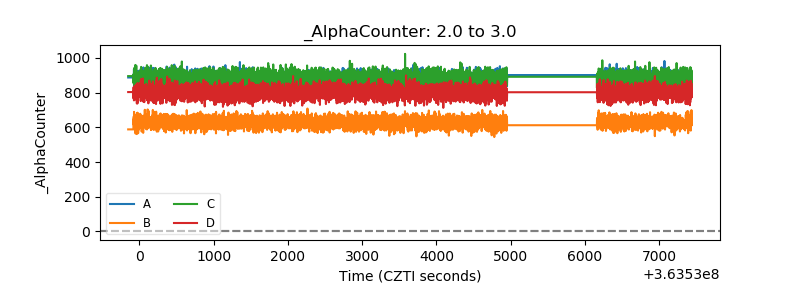 |
| _CPM_Rate | 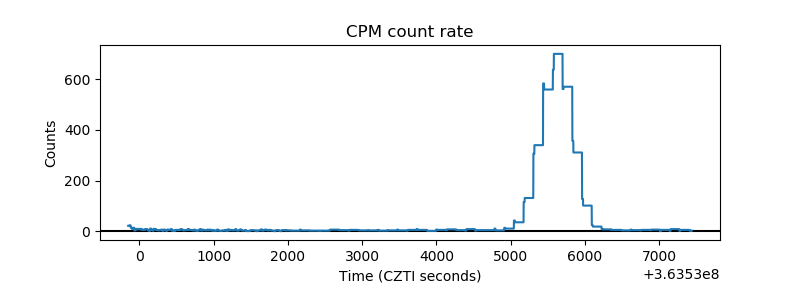 |
| CZT Counter | 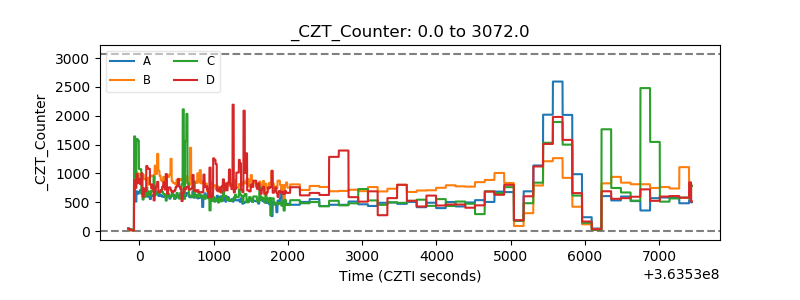 |
| +2.5 Volts monitor |  |
| +5 Volts monitor |  |
| _ROLL_ROT | 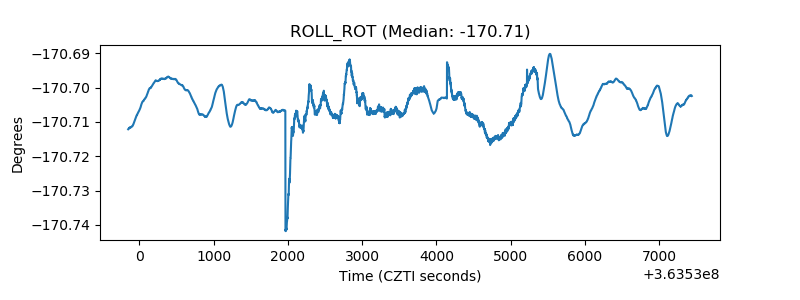 |
| _Roll_DEC | 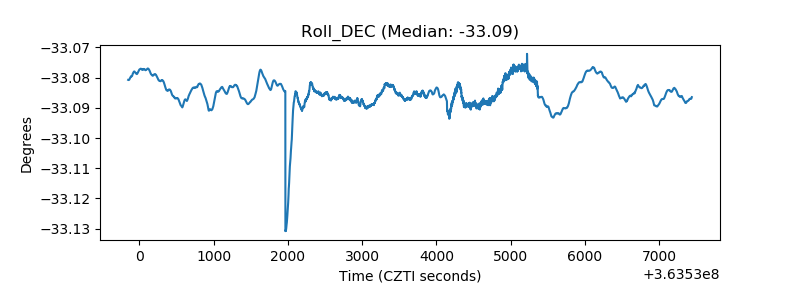 |
| _Roll_RA | 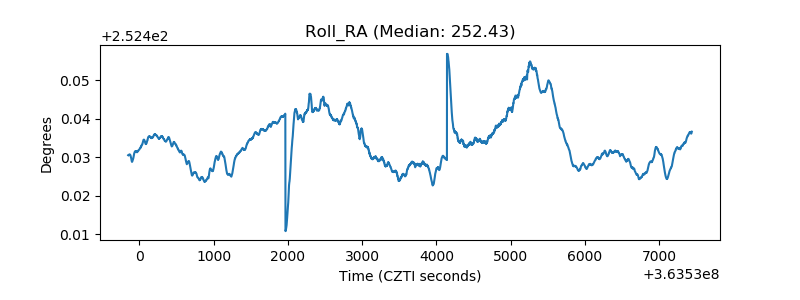 |
| Veto Counter | 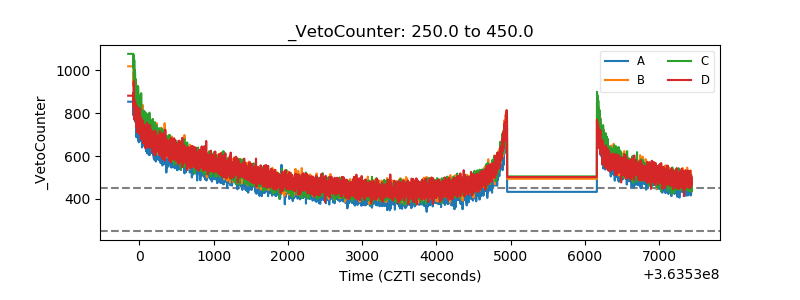 |