| Param | Original file | Final file |
|---|---|---|
| Filename | modeM0/AS1A10_073T02_9000004522_31255cztM0_level2.evt | modeM0/AS1A10_073T02_9000004522_31255cztM0_level2_quad_clean.evt |
| Size (bytes) | 603,414,720 | 106,611,840 |
| Size | 575.5 MB | 101.7 MB |
| Events in quadrant A | 3,517,510 | 703,652 |
| Events in quadrant B | 5,711,840 | 693,907 |
| Events in quadrant C | 3,865,212 | 669,182 |
| Events in quadrant D | 4,690,346 | 658,470 |
| Mode M9 | |||
|---|---|---|---|
| Quadrant | BADHDUFLAG | Total packets | Discarded packets |
| A | 0 | 5 | 0 |
| B | 0 | 5 | 0 |
| C | 0 | 5 | 0 |
| D | 0 | 5 | 0 |
| Mode SS | |||
|---|---|---|---|
| Quadrant | BADHDUFLAG | Total packets | Discarded packets |
| A | 0 | 148 | 0 |
| B | 0 | 148 | 0 |
| C | 0 | 148 | 0 |
| D | 0 | 148 | 0 |
| Mode M0 | |||
|---|---|---|---|
| Quadrant | BADHDUFLAG | Total packets | Discarded packets |
| A | 0 | 14940 | 1 |
| B | 0 | 22165 | 1 |
| C | 0 | 15898 | 1 |
| D | 0 | 18628 | 1 |
| Quadrant | Total seconds | Saturated seconds | Saturation percentage |
|---|---|---|---|
| A | 7228 | 50 | 0.691754% |
| B | 7228 | 151 | 2.089098% |
| C | 7227 | 142 | 1.964854% |
| D | 7228 | 170 | 2.351965% |
Noise dominated data is calculated using 1-second bins in cleaned event files. If a bin has >2000 counts, and if more than 50% of those come from <1% of pixels, then it is considered to be noise-dominated and hence unusable.
| Quadrant | # 1 sec bins | Bins with >0 counts | Bins with >2000 counts | High rate bins dominated by noise | Noise dominated (total time) | Noise dominated (detector-on time) | Marked lightcurve |
|---|---|---|---|---|---|---|---|
| A | 7778 | 7229 | 0 | 0 | 0.00% | 0.00% | 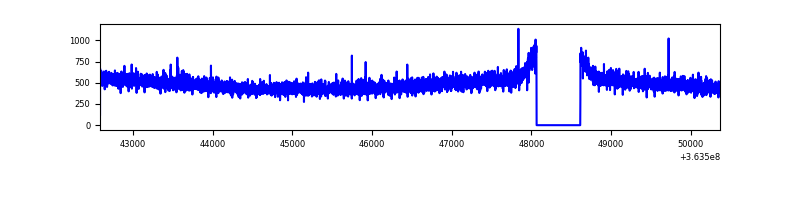 |
| B | 7778 | 7229 | 14 | 14 | 0.18% | 0.19% | 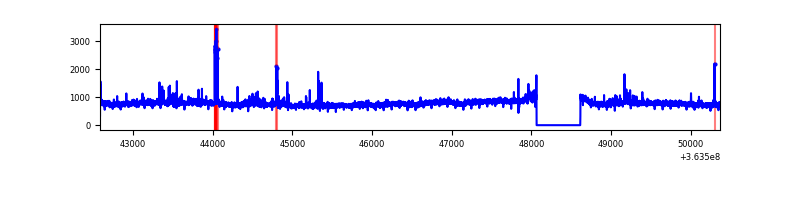 |
| C | 7777 | 7228 | 11 | 11 | 0.14% | 0.15% | 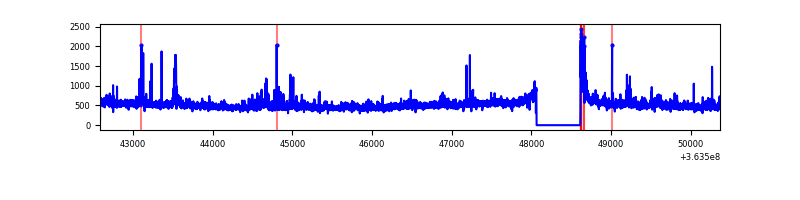 |
| D | 7778 | 7229 | 85 | 85 | 1.09% | 1.18% |  |
Top three noisy pixels from each quadrant. If the there are fewer than three noisy pixels in the level2.evt file, extra rows are filled as -1
| Pixel properties | Quadrant properties | ||||||
|---|---|---|---|---|---|---|---|
| Quadrant | DetID | PixID | Counts | Sigma | Mean | Median | Sigma |
| A | 11 | 47 | 14220 | 73.54 | 906 | 889 | 181.3 |
| A | 13 | 254 | 13917 | 71.87 | 906 | 889 | 181.3 |
| A | 3 | 137 | 8999 | 44.74 | 906 | 889 | 181.3 |
| B | 6 | 159 | 1987841 | 11623.02 | 888 | 867 | 171.0 |
| B | 0 | 190 | 156983 | 913.22 | 888 | 867 | 171.0 |
| B | 12 | 111 | 20624 | 115.57 | 888 | 867 | 171.0 |
| C | 3 | 233 | 182941 | 912.32 | 853 | 855 | 199.6 |
| C | 14 | 238 | 141885 | 706.61 | 853 | 855 | 199.6 |
| C | 0 | 10 | 70771 | 350.3 | 853 | 855 | 199.6 |
| D | 8 | 195 | 747962 | 3277.84 | 860 | 844 | 227.9 |
| D | 12 | 218 | 333403 | 1459.04 | 860 | 844 | 227.9 |
| D | 2 | 250 | 155315 | 677.71 | 860 | 844 | 227.9 |
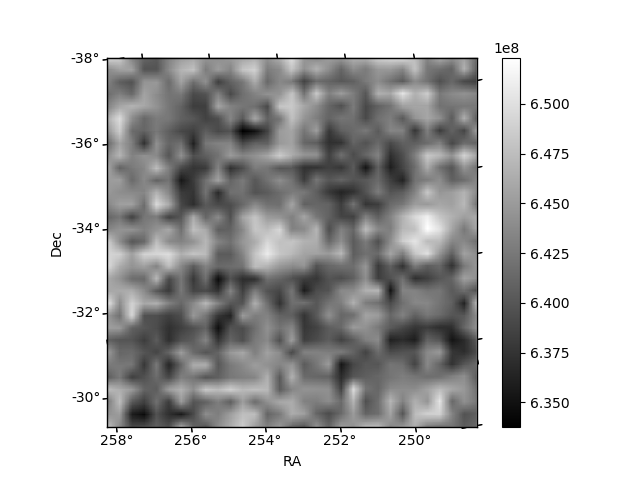
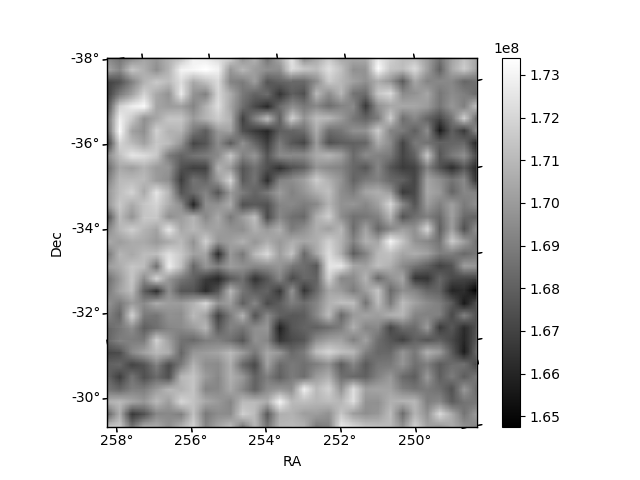
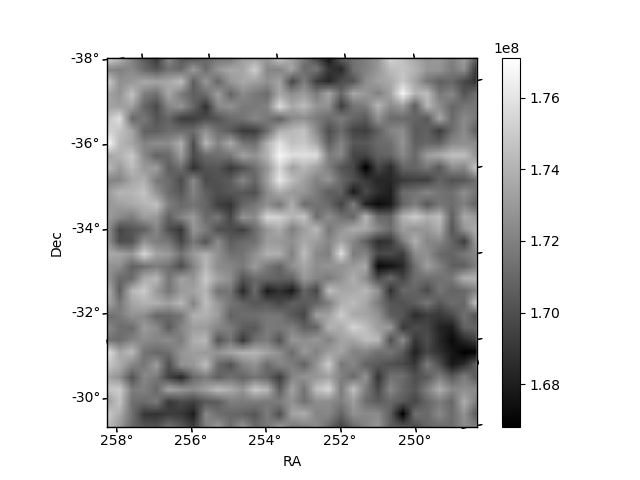
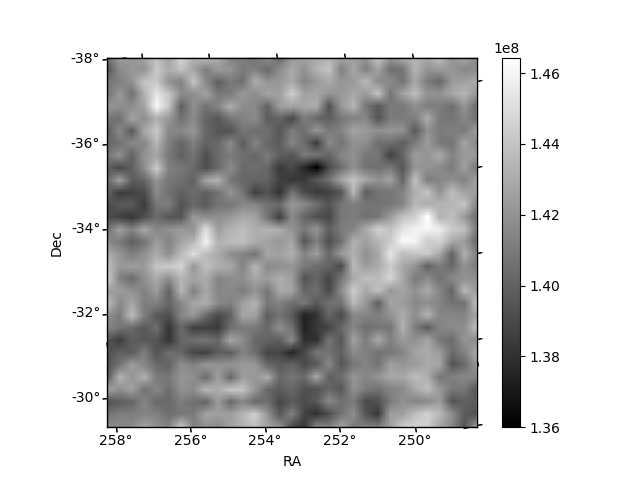
Histogram calculated using DETX and DETY for each event in the final _common_clean file
| Quadrant A |  |
 |
Quadrant B |
|---|---|---|---|
| Quadrant D |  |
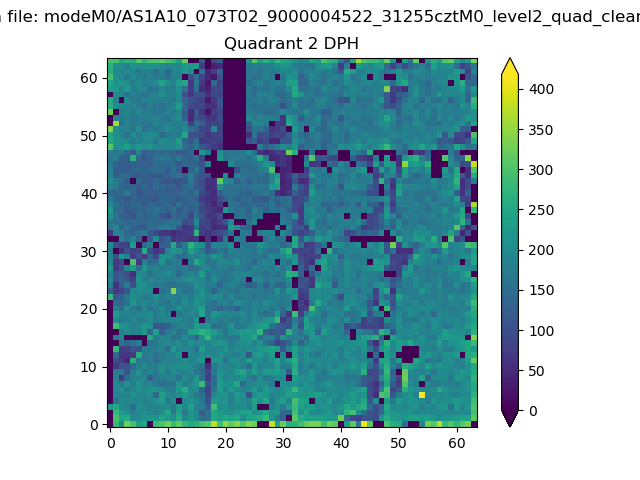 |
Quadrant C |
| Plot type | Count rate plots | Images |
|---|---|---|
| Comparison with Poisson distribution Blue bars denote a histogram of data divided into 1 sec bins. Red curve is a Poisson curve with rate = median count rate of data. |
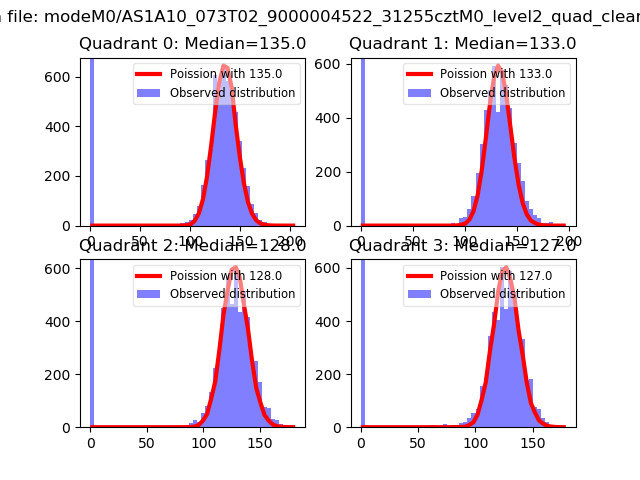 |
 |
| Quadrant-wise count rates Data is divided into 100 sec bins |
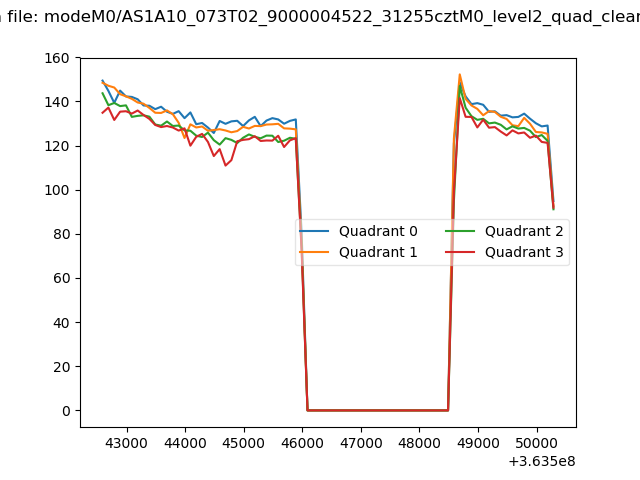 |
|
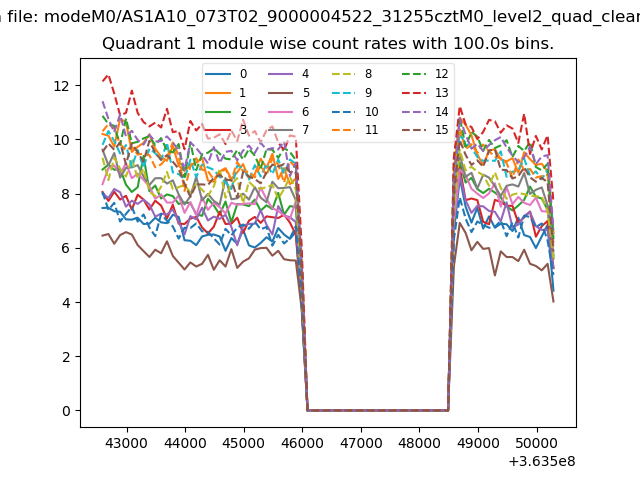
| Module-wise count rates for Quadrant A Data is divided into 100 sec bins |
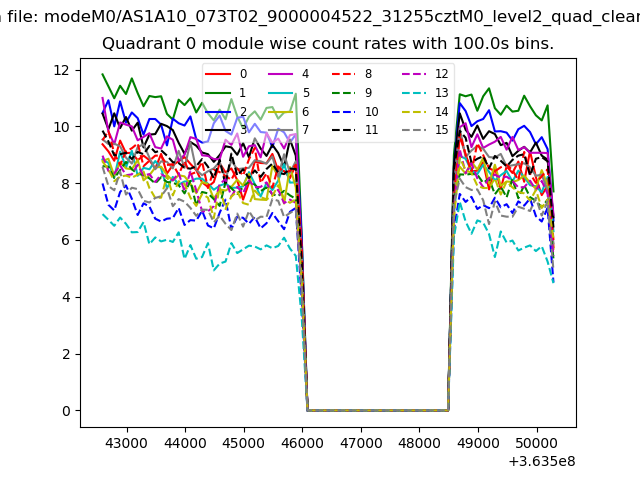 |
 |
| Module-wise count rates for Quadrant B Data is divided into 100 sec bins |
 |
 |
| Module-wise count rates for Quadrant C Data is divided into 100 sec bins |
 |
 |
| Module-wise count rates for Quadrant D Data is divided into 100 sec bins |
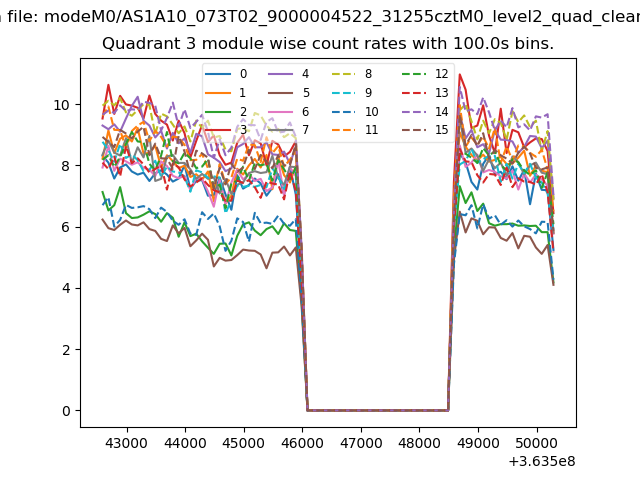 |
 |
| Parameter | Plot |
|---|---|
| CZT HV Monitor |  |
| D_VDD | 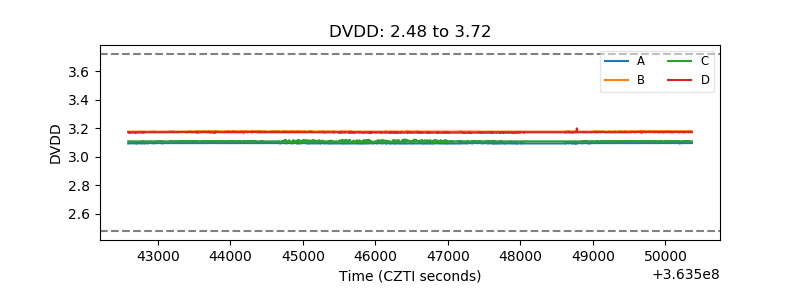 |
| Temperature 1 |  |
| Veto HV Monitor | 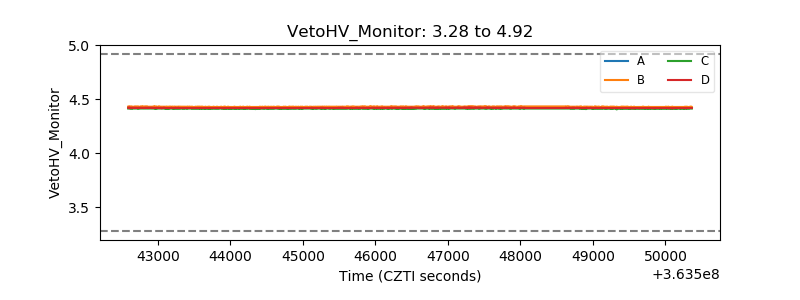 |
| Veto LLD | 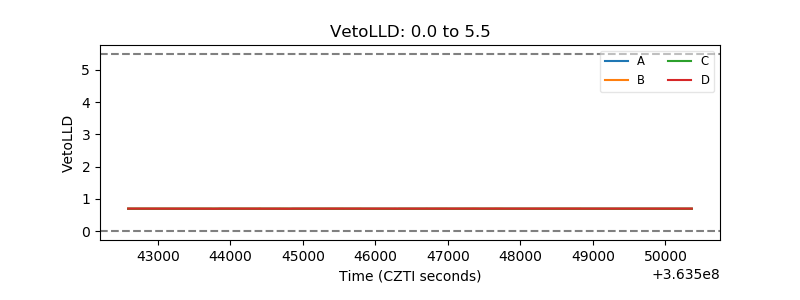 |
| Alpha Counter | 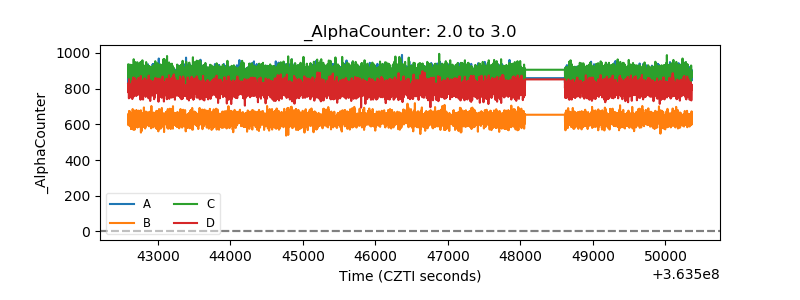 |
| _CPM_Rate | 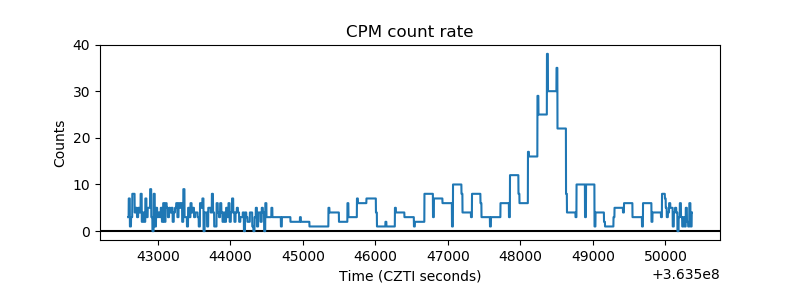 |
| CZT Counter | 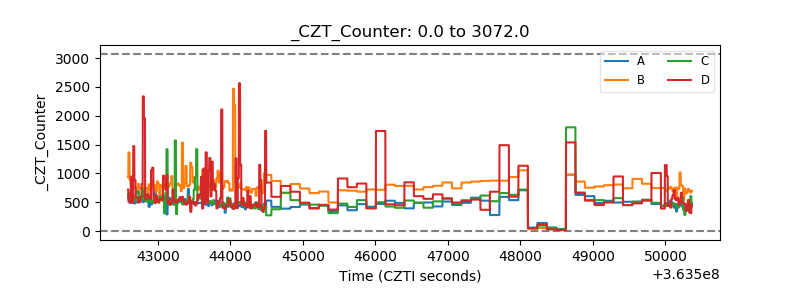 |
| +2.5 Volts monitor |  |
| +5 Volts monitor | 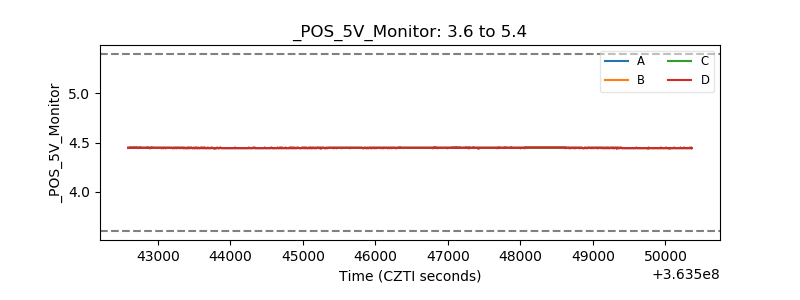 |
| _ROLL_ROT | 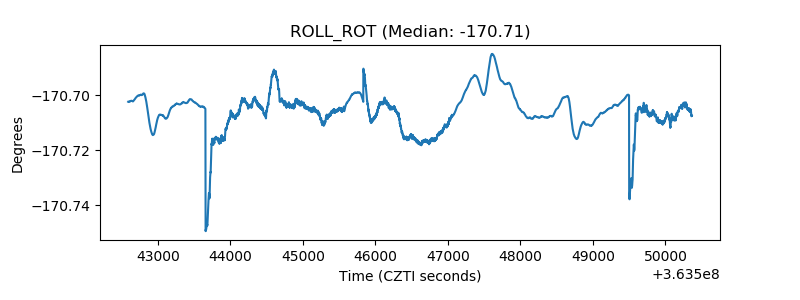 |
| _Roll_DEC | 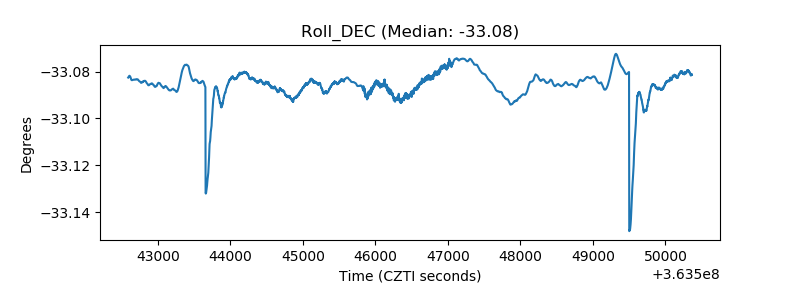 |
| _Roll_RA | 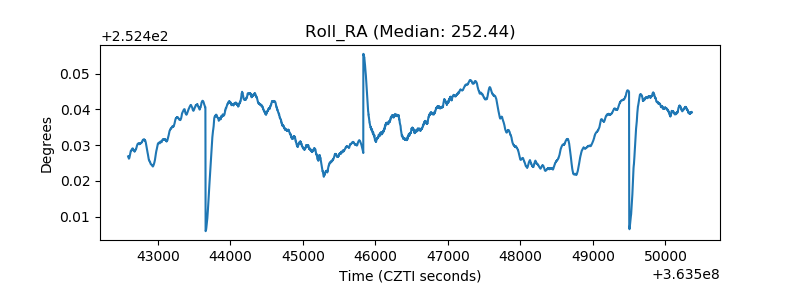 |
| Veto Counter | 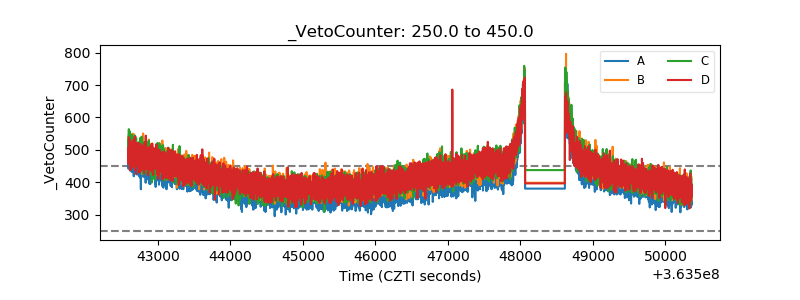 |