| Param | Original file | Final file |
|---|---|---|
| Filename | modeM0/AS1A10_073T02_9000004522_31256cztM0_level2.evt | modeM0/AS1A10_073T02_9000004522_31256cztM0_level2_quad_clean.evt |
| Size (bytes) | 664,044,480 | 111,726,720 |
| Size | 633.3 MB | 106.6 MB |
| Events in quadrant A | 3,707,836 | 736,474 |
| Events in quadrant B | 6,550,286 | 715,186 |
| Events in quadrant C | 4,238,956 | 702,792 |
| Events in quadrant D | 5,095,070 | 695,992 |
| Mode M9 | |||
|---|---|---|---|
| Quadrant | BADHDUFLAG | Total packets | Discarded packets |
| A | 0 | 2 | 0 |
| B | 0 | 2 | 0 |
| C | 0 | 2 | 0 |
| D | 0 | 2 | 0 |
| Mode SS | |||
|---|---|---|---|
| Quadrant | BADHDUFLAG | Total packets | Discarded packets |
| A | 0 | 156 | 0 |
| B | 0 | 156 | 0 |
| C | 0 | 156 | 0 |
| D | 0 | 156 | 0 |
| Mode M0 | |||
|---|---|---|---|
| Quadrant | BADHDUFLAG | Total packets | Discarded packets |
| A | 0 | 15927 | 1 |
| B | 0 | 25039 | 3 |
| C | 0 | 17413 | 1 |
| D | 0 | 20153 | 1 |
| Quadrant | Total seconds | Saturated seconds | Saturation percentage |
|---|---|---|---|
| A | 7664 | 46 | 0.600209% |
| B | 7664 | 363 | 4.736430% |
| C | 7664 | 208 | 2.713987% |
| D | 7664 | 191 | 2.492171% |
Noise dominated data is calculated using 1-second bins in cleaned event files. If a bin has >2000 counts, and if more than 50% of those come from <1% of pixels, then it is considered to be noise-dominated and hence unusable.
| Quadrant | # 1 sec bins | Bins with >0 counts | Bins with >2000 counts | High rate bins dominated by noise | Noise dominated (total time) | Noise dominated (detector-on time) | Marked lightcurve |
|---|---|---|---|---|---|---|---|
| A | 7879 | 7665 | 0 | 0 | 0.00% | 0.00% | 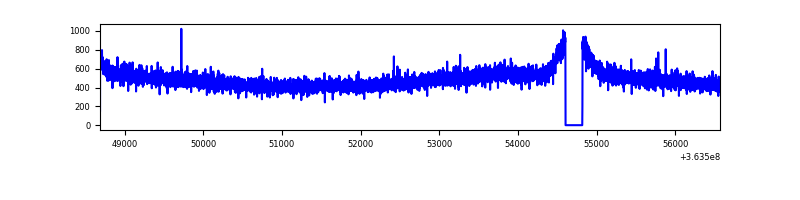 |
| B | 7879 | 7665 | 114 | 114 | 1.45% | 1.49% | 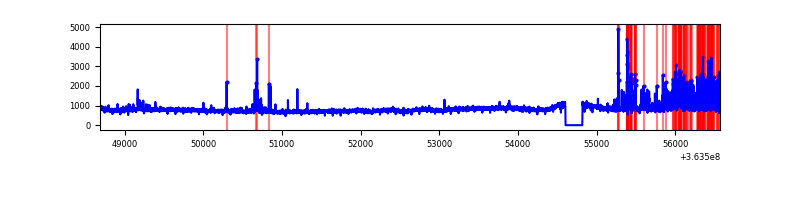 |
| C | 7879 | 7665 | 5 | 5 | 0.06% | 0.07% | 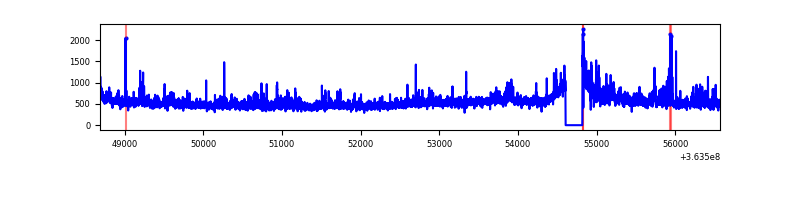 |
| D | 7879 | 7665 | 99 | 99 | 1.26% | 1.29% | 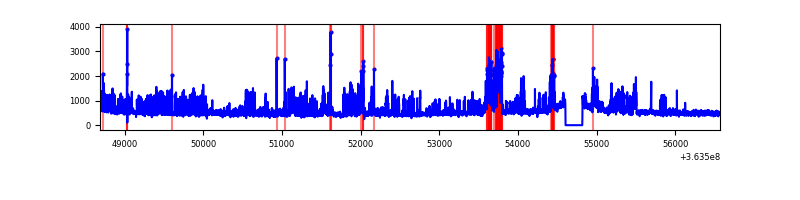 |
Top three noisy pixels from each quadrant. If the there are fewer than three noisy pixels in the level2.evt file, extra rows are filled as -1
| Pixel properties | Quadrant properties | ||||||
|---|---|---|---|---|---|---|---|
| Quadrant | DetID | PixID | Counts | Sigma | Mean | Median | Sigma |
| A | 13 | 254 | 14941 | 72.08 | 958 | 936 | 194.3 |
| A | 3 | 137 | 9681 | 45.01 | 958 | 936 | 194.3 |
| A | 0 | 226 | 8152 | 37.14 | 958 | 936 | 194.3 |
| B | 6 | 159 | 2100021 | 11692.02 | 933 | 909 | 179.5 |
| B | 12 | 18 | 463681 | 2577.63 | 933 | 909 | 179.5 |
| B | 5 | 172 | 131574 | 727.8 | 933 | 909 | 179.5 |
| C | 3 | 233 | 355199 | 1677.17 | 903 | 910 | 211.2 |
| C | 14 | 238 | 156609 | 737.06 | 903 | 910 | 211.2 |
| C | 0 | 10 | 140083 | 658.83 | 903 | 910 | 211.2 |
| D | 8 | 195 | 935240 | 3928.39 | 908 | 892 | 237.8 |
| D | 12 | 79 | 472095 | 1981.14 | 908 | 892 | 237.8 |
| D | 2 | 250 | 131956 | 551.05 | 908 | 892 | 237.8 |
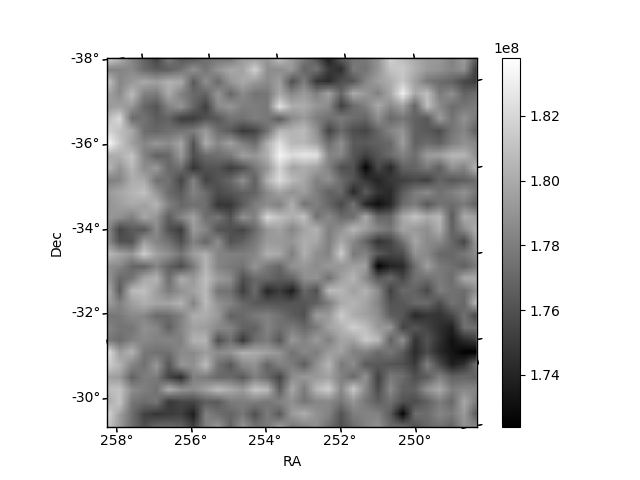
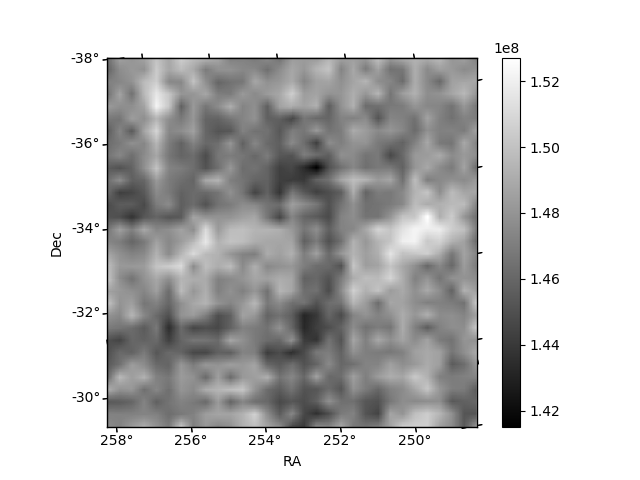
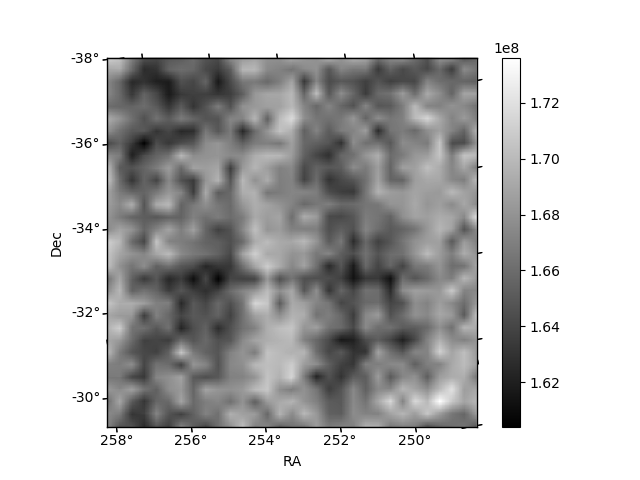
Histogram calculated using DETX and DETY for each event in the final _common_clean file
| Quadrant A | 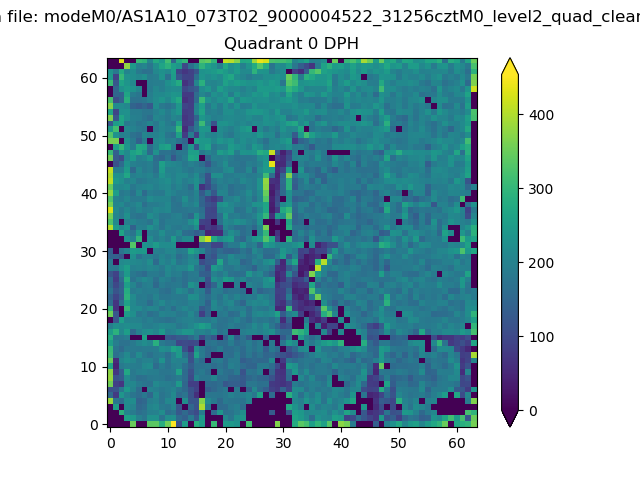 |
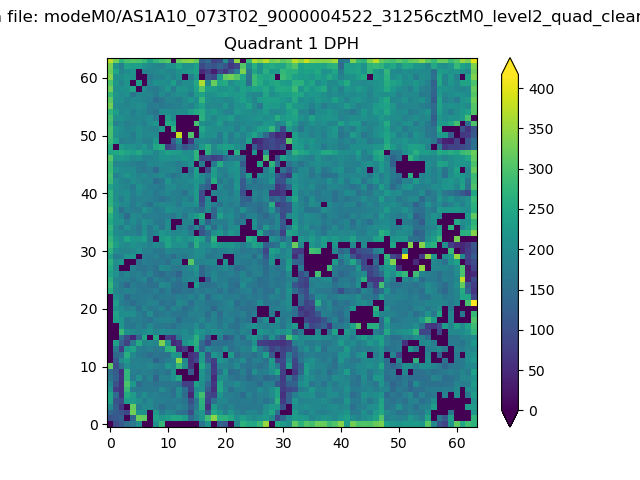 |
Quadrant B |
|---|---|---|---|
| Quadrant D | 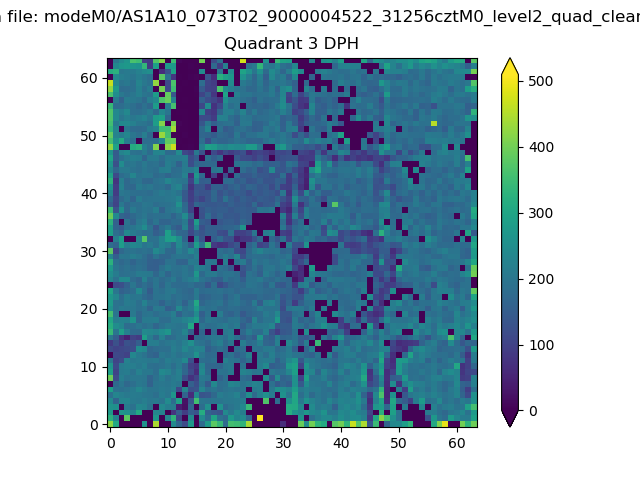 |
 |
Quadrant C |
| Plot type | Count rate plots | Images |
|---|---|---|
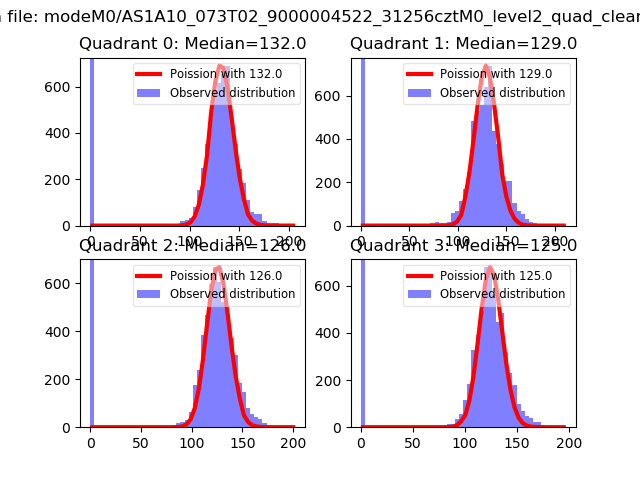
| Comparison with Poisson distribution Blue bars denote a histogram of data divided into 1 sec bins. Red curve is a Poisson curve with rate = median count rate of data. |
 |
 |
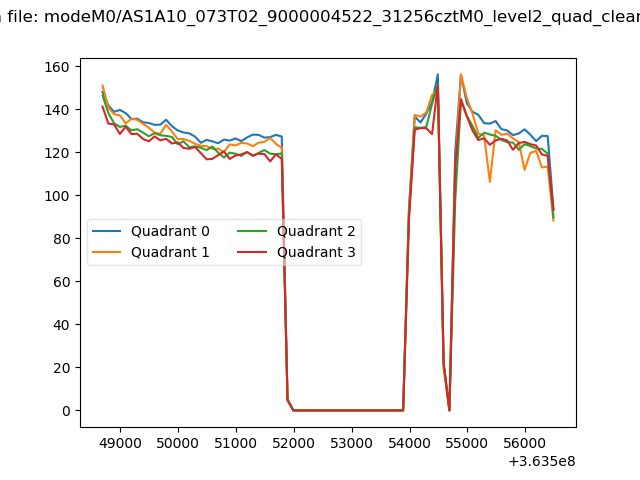
| Quadrant-wise count rates Data is divided into 100 sec bins |
 |
|
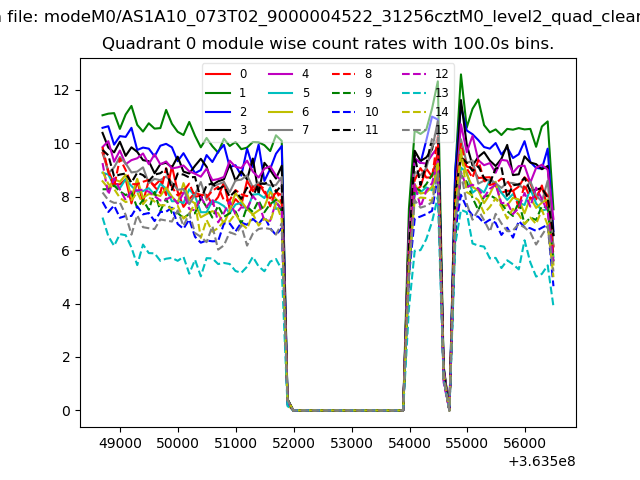
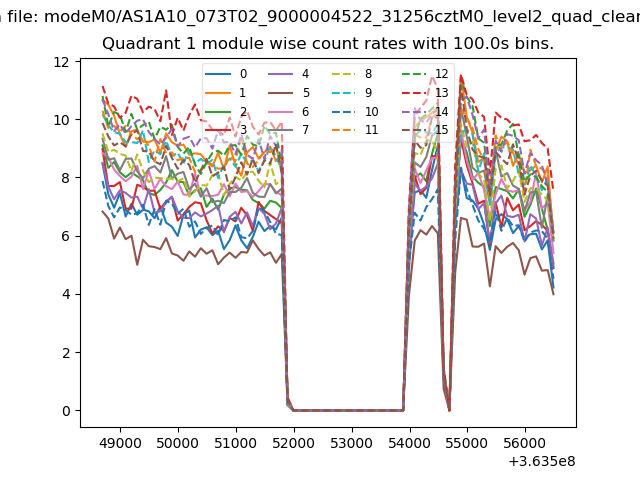
| Module-wise count rates for Quadrant A Data is divided into 100 sec bins |
 |
 |
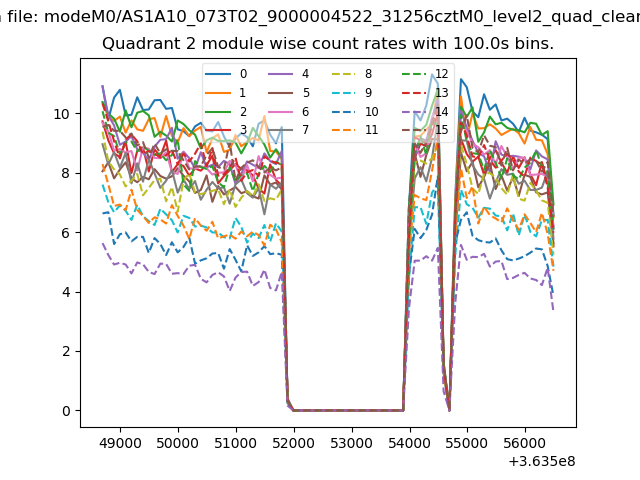
| Module-wise count rates for Quadrant B Data is divided into 100 sec bins |
 |
 |
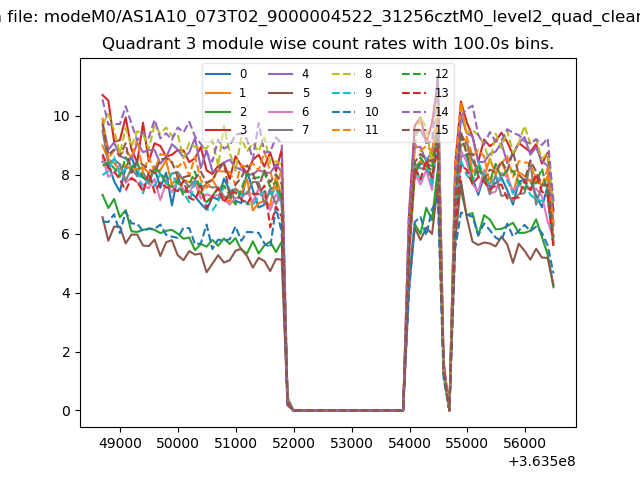
| Module-wise count rates for Quadrant C Data is divided into 100 sec bins |
 |
 |
| Module-wise count rates for Quadrant D Data is divided into 100 sec bins |
 |
 |
| Parameter | Plot |
|---|---|
| CZT HV Monitor | 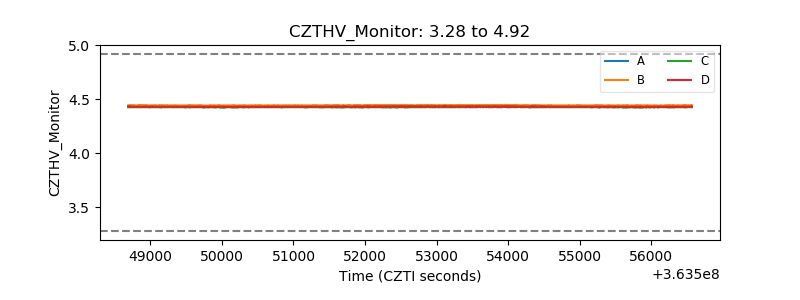 |
| D_VDD | 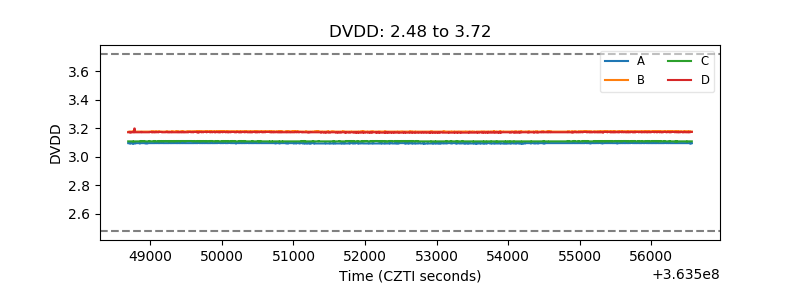 |
| Temperature 1 | 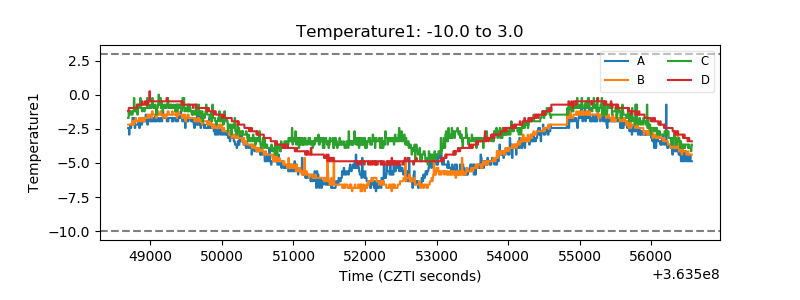 |
| Veto HV Monitor | 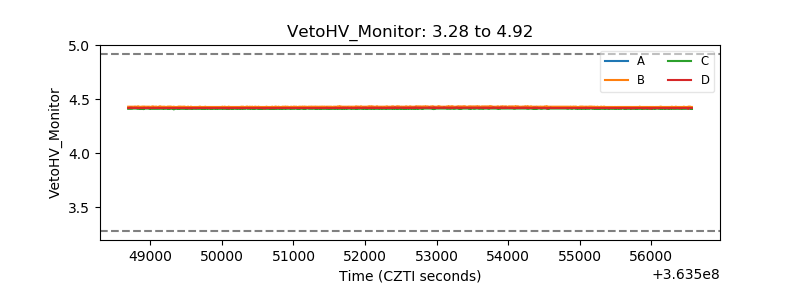 |
| Veto LLD | 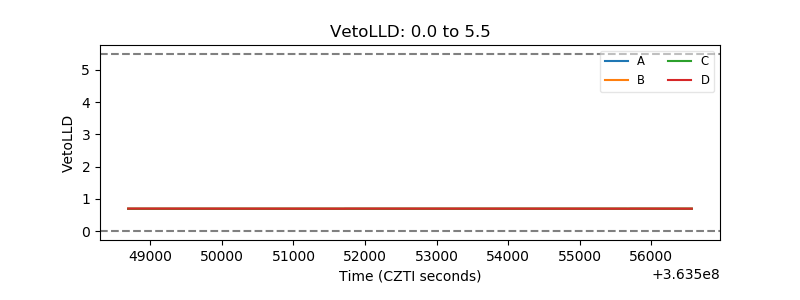 |
| Alpha Counter | 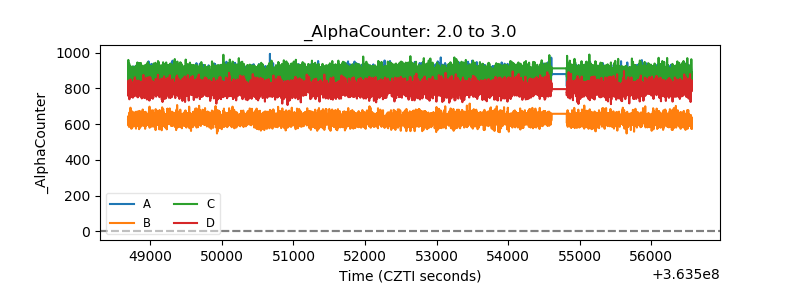 |
| _CPM_Rate | 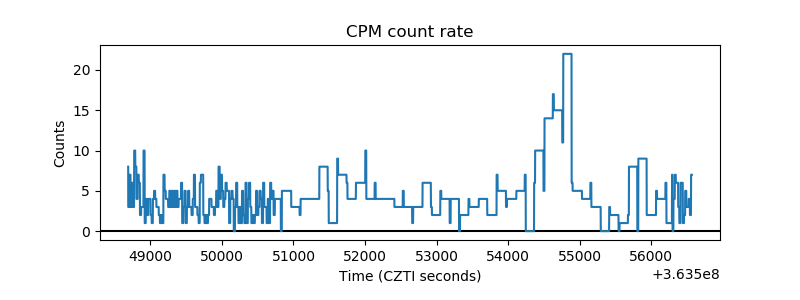 |
| CZT Counter |  |
| +2.5 Volts monitor |  |
| +5 Volts monitor |  |
| _ROLL_ROT | 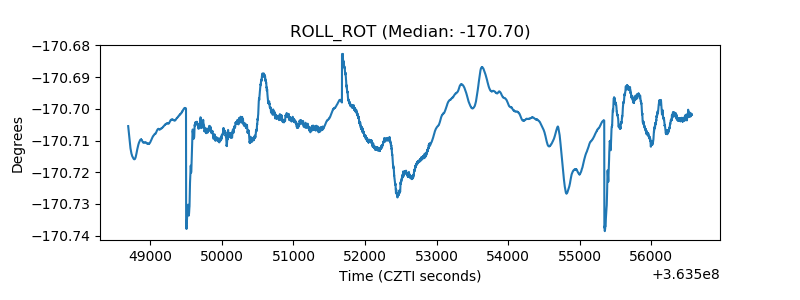 |
| _Roll_DEC | 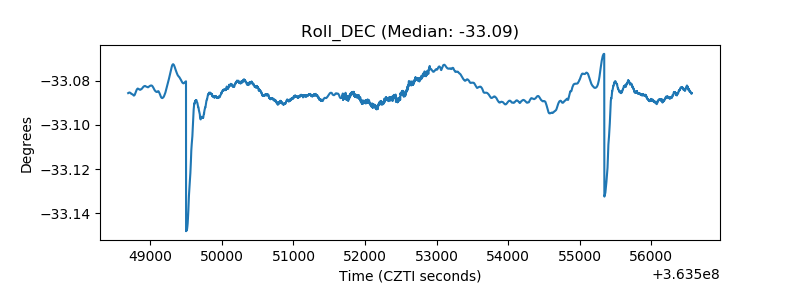 |
| _Roll_RA | 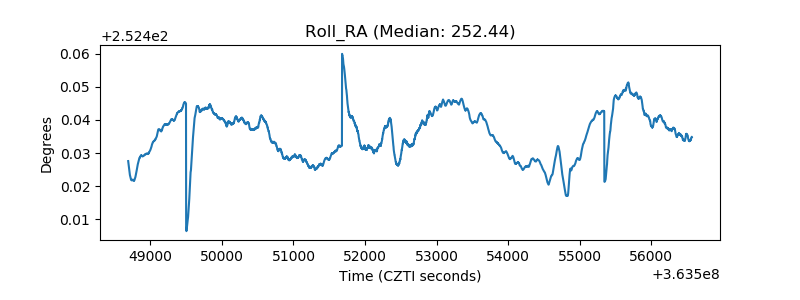 |
| Veto Counter | 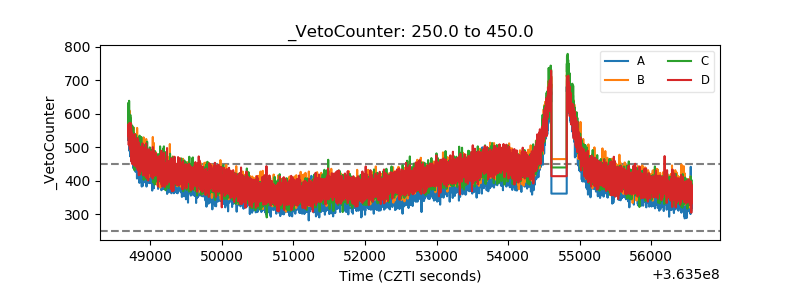 |