| Param | Original file | Final file |
|---|---|---|
| Filename | modeM0/AS1A10_073T02_9000004522_31260cztM0_level2.evt | modeM0/AS1A10_073T02_9000004522_31260cztM0_level2_quad_clean.evt |
| Size (bytes) | 200,926,080 | 44,069,760 |
| Size | 191.6 MB | 42.0 MB |
| Events in quadrant A | 1,110,886 | 303,206 |
| Events in quadrant B | 2,087,446 | 295,951 |
| Events in quadrant C | 1,334,192 | 285,440 |
| Events in quadrant D | 1,394,091 | 283,365 |
| Mode M9 | |||
|---|---|---|---|
| Quadrant | BADHDUFLAG | Total packets | Discarded packets |
| A | 0 | 4 | 0 |
| B | 0 | 4 | 0 |
| C | 0 | 4 | 0 |
| D | 0 | 4 | 0 |
| Mode SS | |||
|---|---|---|---|
| Quadrant | BADHDUFLAG | Total packets | Discarded packets |
| A | 0 | 46 | 0 |
| B | 0 | 46 | 0 |
| C | 0 | 46 | 0 |
| D | 0 | 46 | 0 |
| Mode M0 | |||
|---|---|---|---|
| Quadrant | BADHDUFLAG | Total packets | Discarded packets |
| A | 0 | 4873 | 1 |
| B | 0 | 7942 | 1 |
| C | 0 | 5561 | 1 |
| D | 0 | 5710 | 1 |
| Quadrant | Total seconds | Saturated seconds | Saturation percentage |
|---|---|---|---|
| A | 2312 | 26 | 1.124567% |
| B | 2313 | 122 | 5.274535% |
| C | 2313 | 110 | 4.755728% |
| D | 2313 | 24 | 1.037613% |
Noise dominated data is calculated using 1-second bins in cleaned event files. If a bin has >2000 counts, and if more than 50% of those come from <1% of pixels, then it is considered to be noise-dominated and hence unusable.
| Quadrant | # 1 sec bins | Bins with >0 counts | Bins with >2000 counts | High rate bins dominated by noise | Noise dominated (total time) | Noise dominated (detector-on time) | Marked lightcurve |
|---|---|---|---|---|---|---|---|
| A | 2632 | 2313 | 0 | 0 | 0.00% | 0.00% |  |
| B | 2633 | 2314 | 11 | 11 | 0.42% | 0.48% |  |
| C | 2633 | 2314 | 11 | 11 | 0.42% | 0.48% |  |
| D | 2633 | 2314 | 5 | 5 | 0.19% | 0.22% |  |
Top three noisy pixels from each quadrant. If the there are fewer than three noisy pixels in the level2.evt file, extra rows are filled as -1
| Pixel properties | Quadrant properties | ||||||
|---|---|---|---|---|---|---|---|
| Quadrant | DetID | PixID | Counts | Sigma | Mean | Median | Sigma |
| A | 13 | 254 | 4863 | 76.61 | 286 | 280 | 59.8 |
| A | 3 | 137 | 2992 | 45.33 | 286 | 280 | 59.8 |
| A | 0 | 226 | 2476 | 36.71 | 286 | 280 | 59.8 |
| B | 6 | 159 | 635712 | 11147.13 | 281 | 274 | 57.0 |
| B | 0 | 190 | 229182 | 4015.6 | 281 | 274 | 57.0 |
| B | 10 | 247 | 40617 | 707.71 | 281 | 274 | 57.0 |
| C | 3 | 233 | 139391 | 2162.82 | 265 | 265 | 64.3 |
| C | 0 | 10 | 95816 | 1485.41 | 265 | 265 | 64.3 |
| C | 14 | 238 | 43013 | 664.55 | 265 | 265 | 64.3 |
| D | 8 | 195 | 291026 | 4383.0 | 271 | 264 | 66.3 |
| D | 2 | 250 | 23684 | 353.04 | 271 | 264 | 66.3 |
| D | 12 | 233 | 13989 | 206.89 | 271 | 264 | 66.3 |
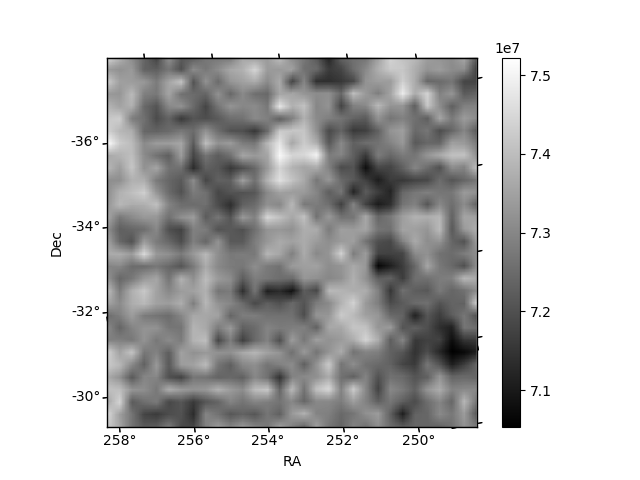
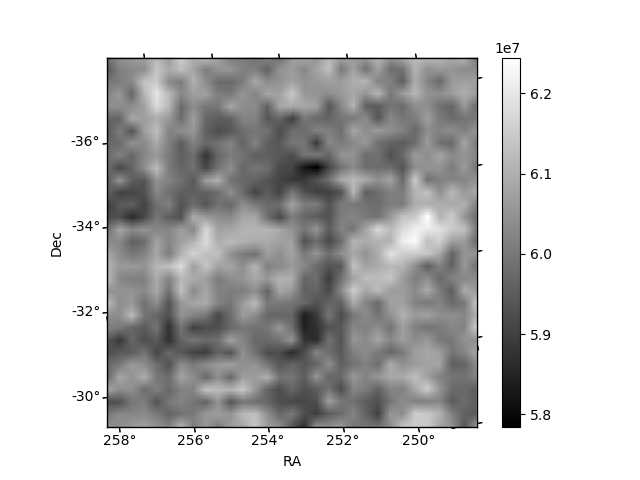
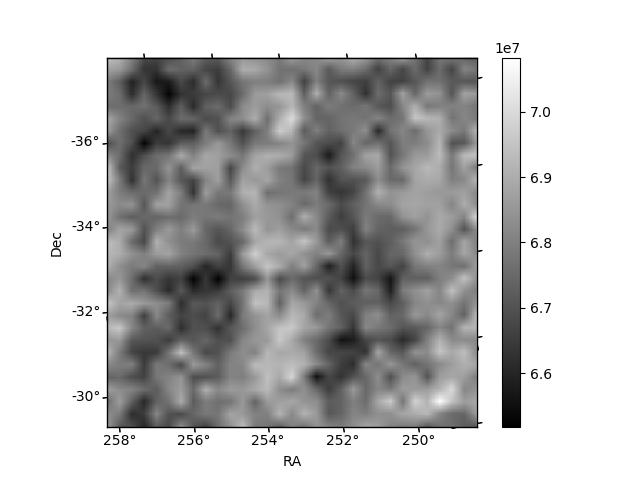
Histogram calculated using DETX and DETY for each event in the final _common_clean file
| Quadrant A | 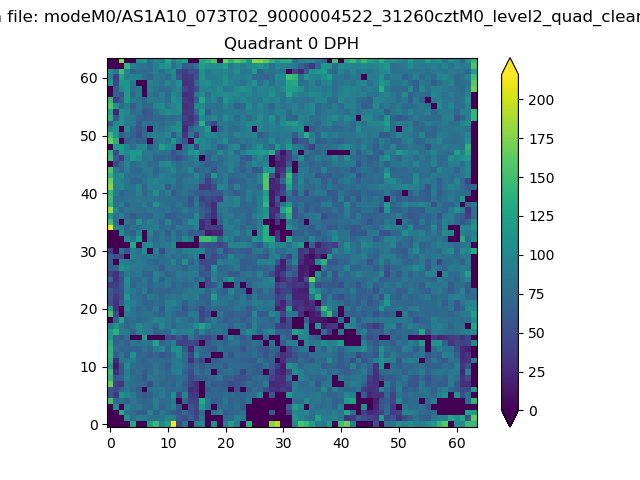 |
 |
Quadrant B |
|---|---|---|---|
| Quadrant D | 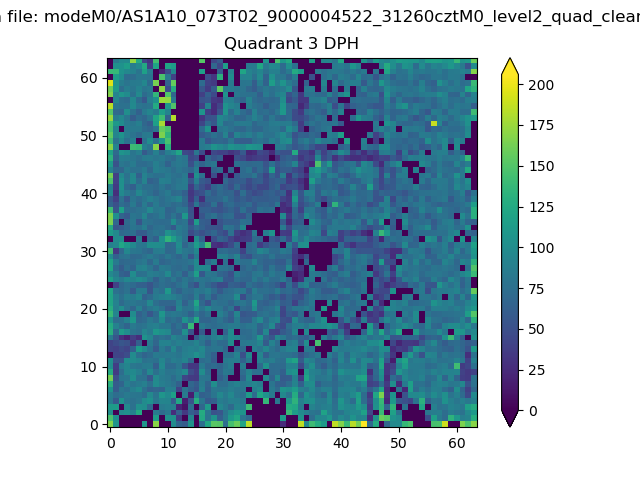 |
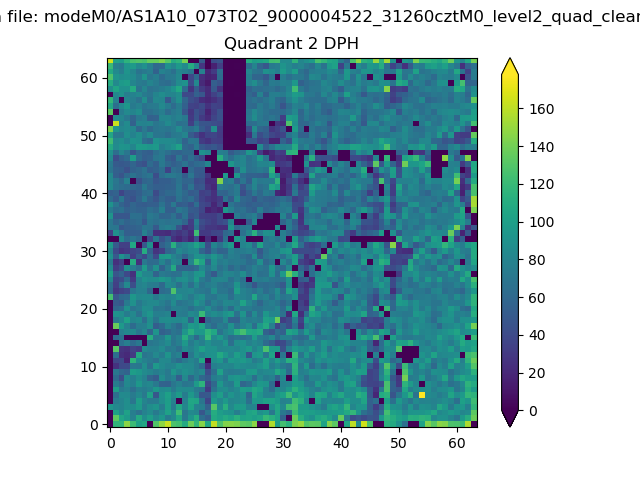 |
Quadrant C |
| Plot type | Count rate plots | Images |
|---|---|---|
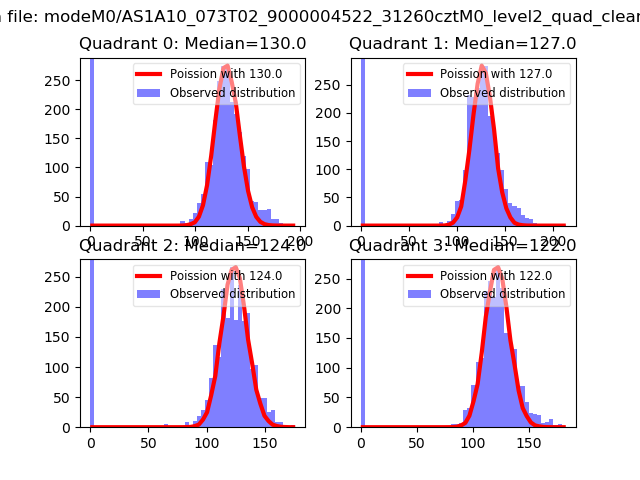
| Comparison with Poisson distribution Blue bars denote a histogram of data divided into 1 sec bins. Red curve is a Poisson curve with rate = median count rate of data. |
 |
 |
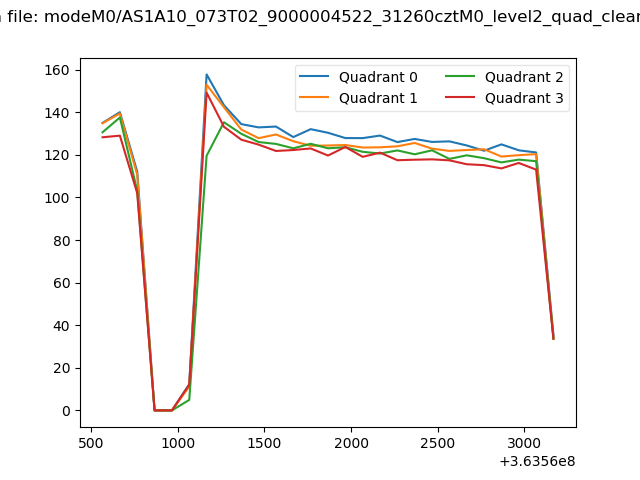
| Quadrant-wise count rates Data is divided into 100 sec bins |
 |
|
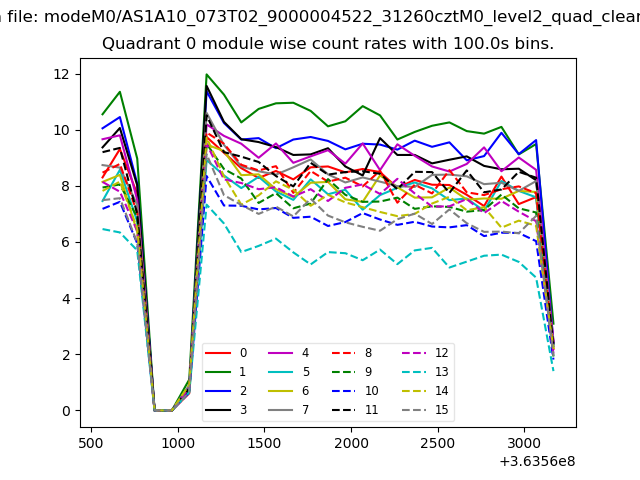
| Module-wise count rates for Quadrant A Data is divided into 100 sec bins |
 |
 |
| Module-wise count rates for Quadrant B Data is divided into 100 sec bins |
 |
 |
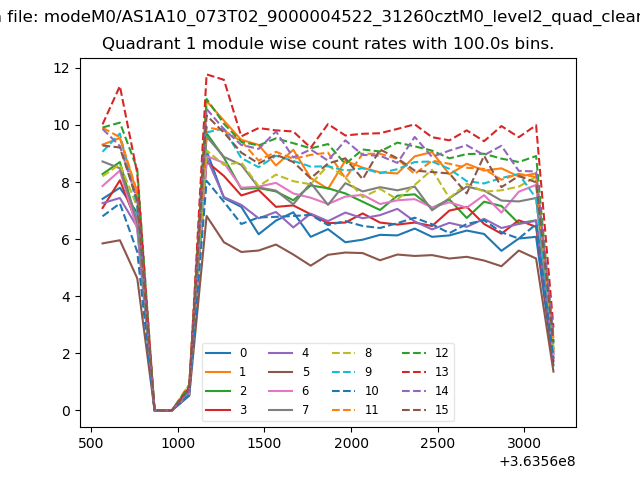
| Module-wise count rates for Quadrant C Data is divided into 100 sec bins |
 |
 |
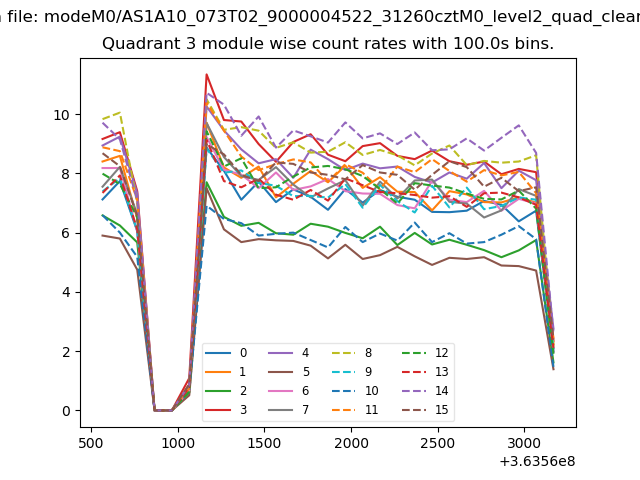
| Module-wise count rates for Quadrant D Data is divided into 100 sec bins |
 |
 |
| Parameter | Plot |
|---|---|
| CZT HV Monitor |  |
| D_VDD | 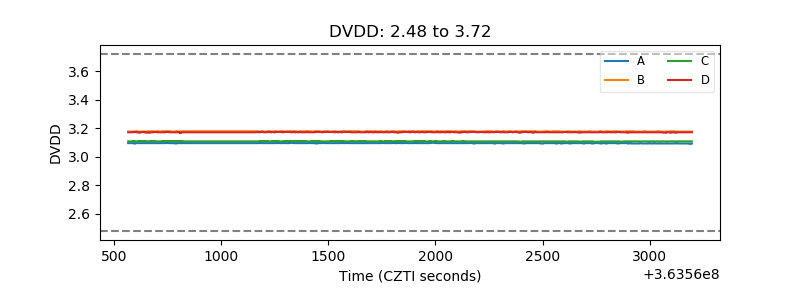 |
| Temperature 1 | 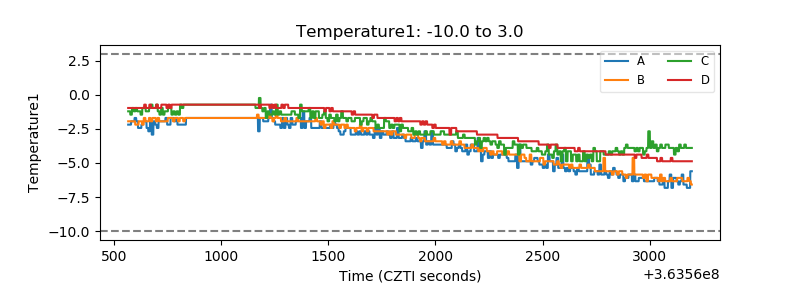 |
| Veto HV Monitor | 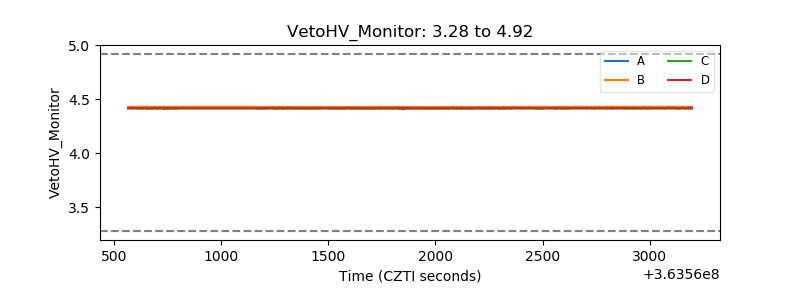 |
| Veto LLD | 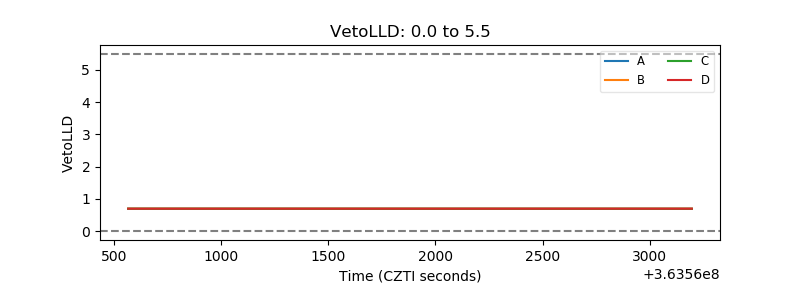 |
| Alpha Counter | 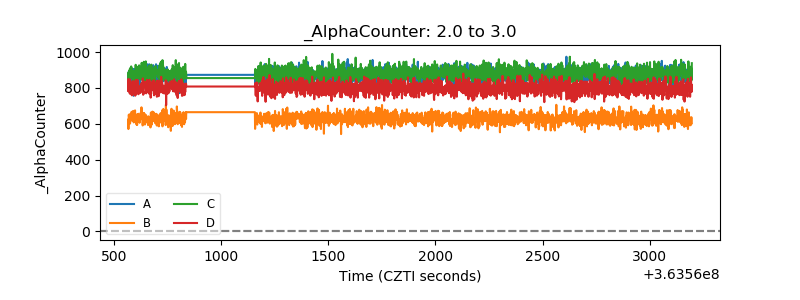 |
| _CPM_Rate | 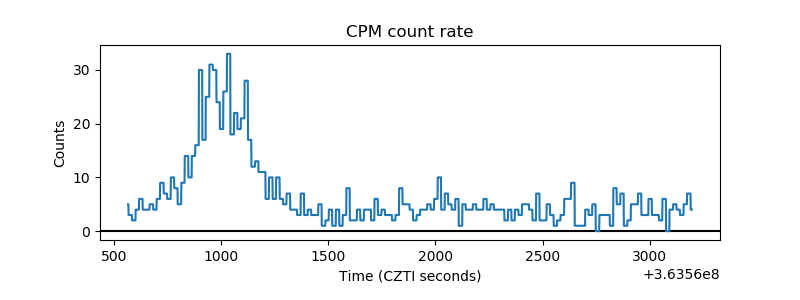 |
| CZT Counter | 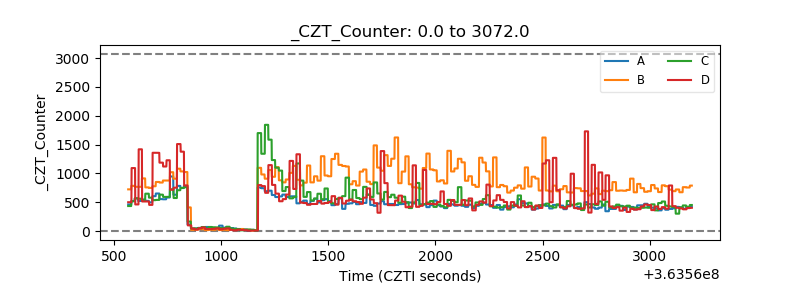 |
| +2.5 Volts monitor |  |
| +5 Volts monitor |  |
| _ROLL_ROT | 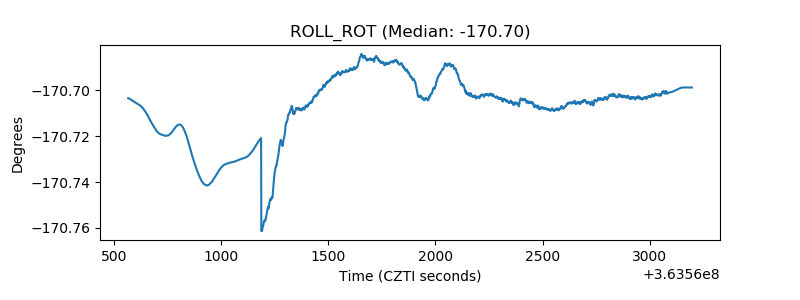 |
| _Roll_DEC | 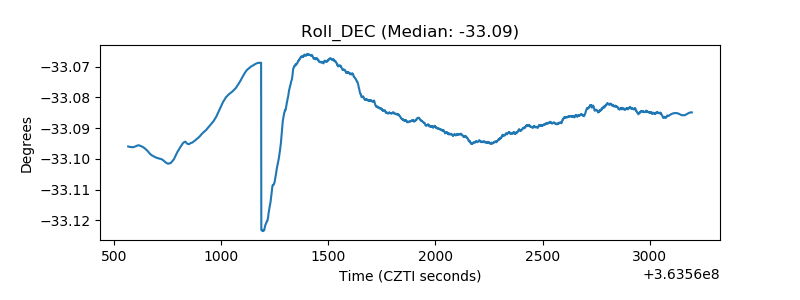 |
| _Roll_RA | 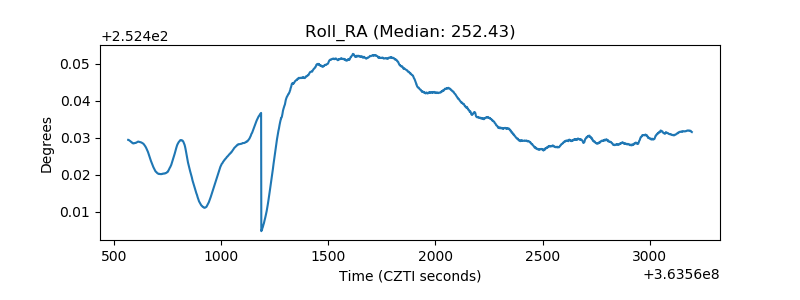 |
| Veto Counter | 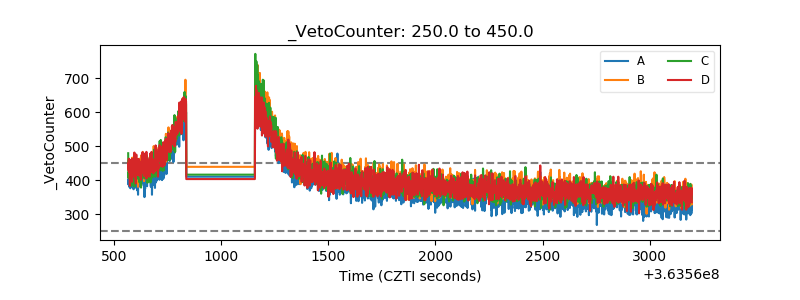 |