| Param | Original file | Final file |
|---|---|---|
| Filename | modeM0/AS1A10_073T02_9000004522_31426cztM0_level2.evt | modeM0/AS1A10_073T02_9000004522_31426cztM0_level2_quad_clean.evt |
| Size (bytes) | 502,032,960 | 44,069,760 |
| Size | 478.8 MB | 42.0 MB |
| Events in quadrant A | 2,033,714 | 302,304 |
| Events in quadrant B | 7,742,410 | 166,983 |
| Events in quadrant C | 2,139,736 | 297,812 |
| Events in quadrant D | 3,017,700 | 285,598 |
| Mode M9 | |||
|---|---|---|---|
| Quadrant | BADHDUFLAG | Total packets | Discarded packets |
| A | 0 | 13 | 0 |
| B | 0 | 13 | 0 |
| C | 0 | 13 | 0 |
| D | 0 | 14 | 1 |
| Mode SS | |||
|---|---|---|---|
| Quadrant | BADHDUFLAG | Total packets | Discarded packets |
| A | 0 | 87 | 3 |
| B | 0 | 87 | 3 |
| C | 0 | 88 | 4 |
| D | 0 | 87 | 3 |
| Mode M0 | |||
|---|---|---|---|
| Quadrant | BADHDUFLAG | Total packets | Discarded packets |
| A | 0 | 8648 | 312 |
| B | 0 | 26226 | 566 |
| C | 0 | 9044 | 334 |
| D | 0 | 12625 | 530 |
| Quadrant | Total seconds | Saturated seconds | Saturation percentage |
|---|---|---|---|
| A | 3977 | 18 | 0.452602% |
| B | 3970 | 2926 | 73.702771% |
| C | 3971 | 105 | 2.644170% |
| D | 3967 | 131 | 3.302244% |
Noise dominated data is calculated using 1-second bins in cleaned event files. If a bin has >2000 counts, and if more than 50% of those come from <1% of pixels, then it is considered to be noise-dominated and hence unusable.
| Quadrant | # 1 sec bins | Bins with >0 counts | Bins with >2000 counts | High rate bins dominated by noise | Noise dominated (total time) | Noise dominated (detector-on time) | Marked lightcurve |
|---|---|---|---|---|---|---|---|
| A | 5344 | 3983 | 0 | 0 | 0.00% | 0.00% |  |
| B | 5347 | 3976 | 2174 | 2174 | 40.66% | 54.68% |  |
| C | 5337 | 3979 | 2 | 2 | 0.04% | 0.05% |  |
| D | 5336 | 3976 | 88 | 88 | 1.65% | 2.21% |  |
Top three noisy pixels from each quadrant. If the there are fewer than three noisy pixels in the level2.evt file, extra rows are filled as -1
| Pixel properties | Quadrant properties | ||||||
|---|---|---|---|---|---|---|---|
| Quadrant | DetID | PixID | Counts | Sigma | Mean | Median | Sigma |
| A | 13 | 254 | 7474 | 66.62 | 526 | 516 | 104.4 |
| A | 3 | 137 | 4962 | 42.57 | 526 | 516 | 104.4 |
| A | 0 | 226 | 4405 | 37.24 | 526 | 516 | 104.4 |
| B | 12 | 1 | 6255000 | 136626.3 | 240 | 235 | 45.8 |
| B | 6 | 159 | 500883 | 10935.93 | 240 | 235 | 45.8 |
| B | 12 | 2 | 24024 | 519.64 | 240 | 235 | 45.8 |
| C | 14 | 238 | 88521 | 739.31 | 512 | 516 | 119.0 |
| C | 3 | 233 | 35991 | 298.01 | 512 | 516 | 119.0 |
| C | 2 | 114 | 9332 | 74.06 | 512 | 516 | 119.0 |
| D | 8 | 195 | 468370 | 3854.62 | 512 | 498 | 121.4 |
| D | 12 | 218 | 314732 | 2588.86 | 512 | 498 | 121.4 |
| D | 5 | 233 | 136696 | 1122.08 | 512 | 498 | 121.4 |
Histogram calculated using DETX and DETY for each event in the final _common_clean file
| Quadrant A |  |
 |
Quadrant B |
|---|---|---|---|
| Quadrant D |  |
 |
Quadrant C |
| Plot type | Count rate plots | Images |
|---|---|---|
| Comparison with Poisson distribution Blue bars denote a histogram of data divided into 1 sec bins. Red curve is a Poisson curve with rate = median count rate of data. |
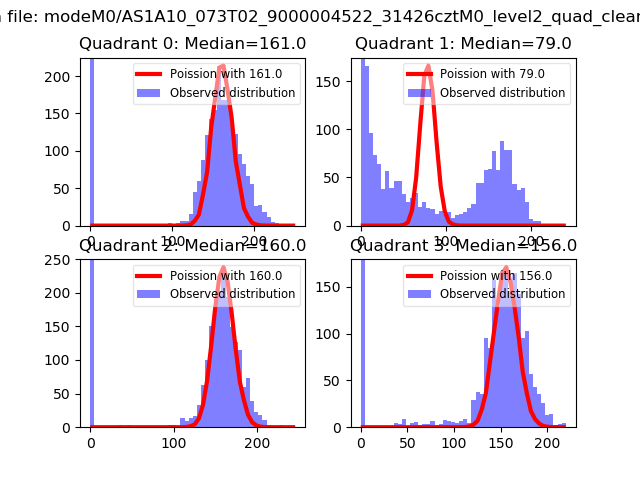 |
 |
| Quadrant-wise count rates Data is divided into 100 sec bins |
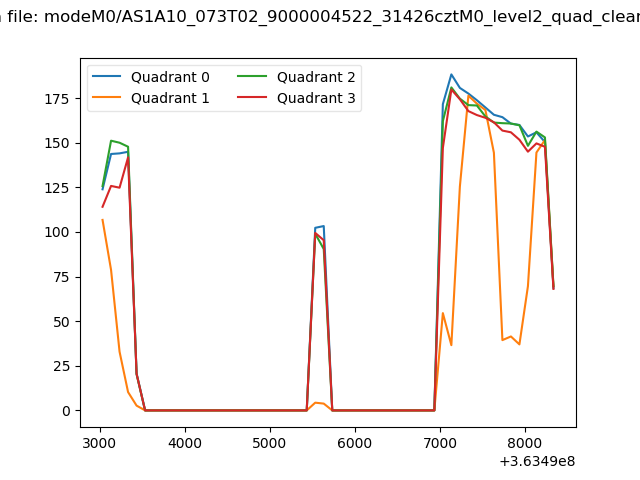 |
|
| Module-wise count rates for Quadrant A Data is divided into 100 sec bins |
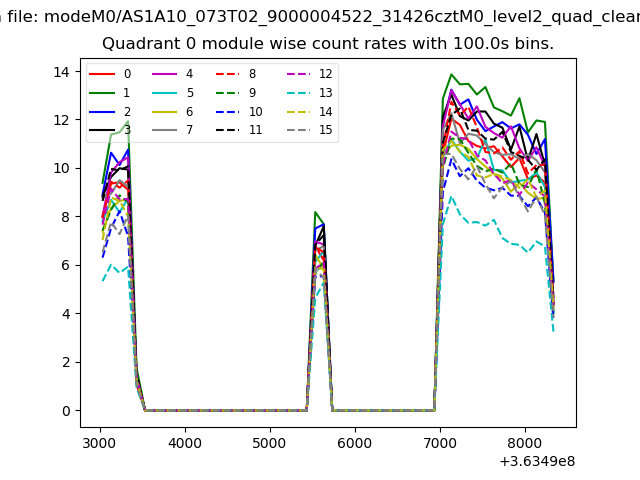 |
 |
| Module-wise count rates for Quadrant B Data is divided into 100 sec bins |
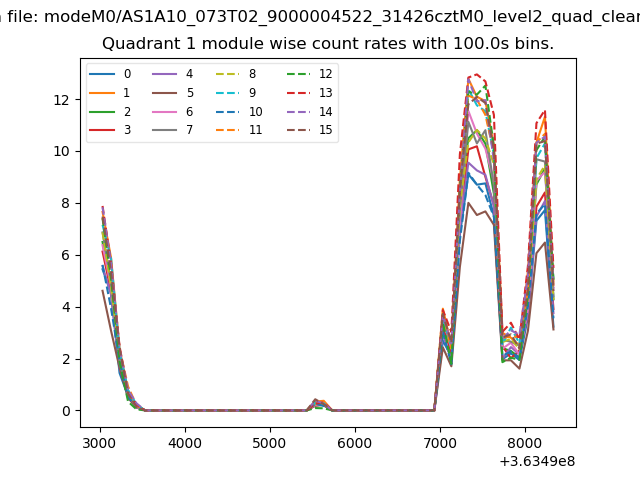 |
 |
| Module-wise count rates for Quadrant C Data is divided into 100 sec bins |
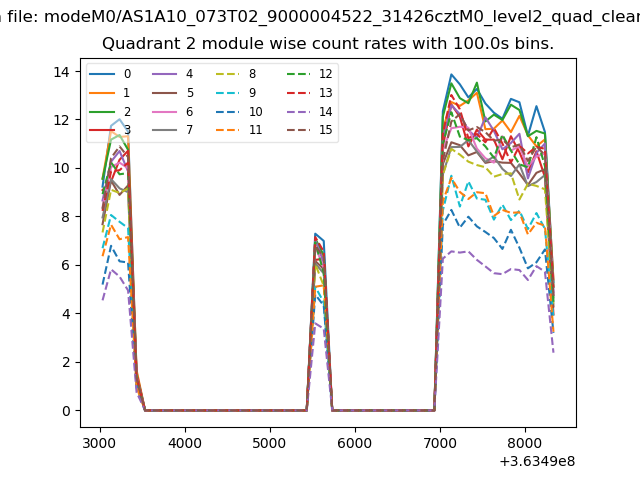 |
 |
| Module-wise count rates for Quadrant D Data is divided into 100 sec bins |
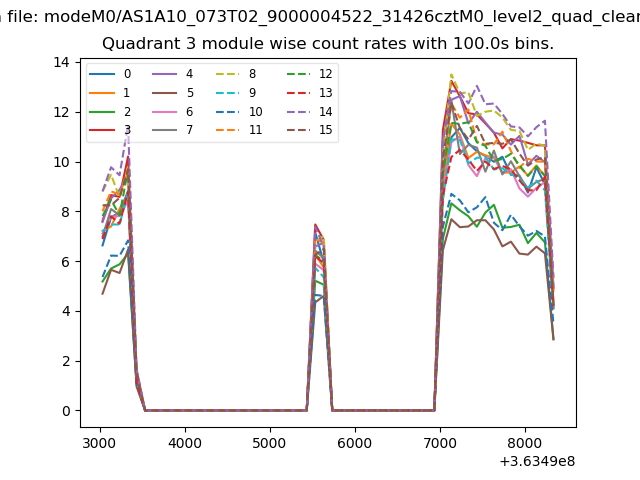 |
 |
| Parameter | Plot |
|---|---|
| CZT HV Monitor | 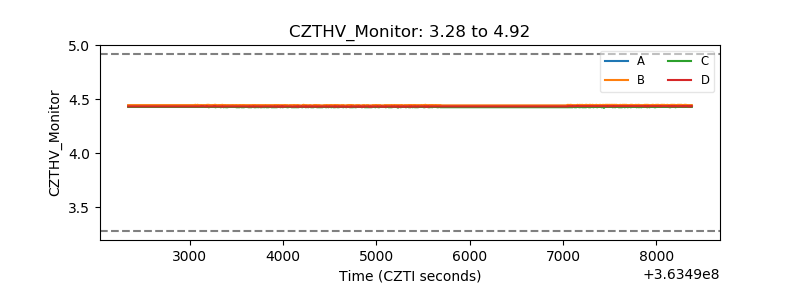 |
| D_VDD |  |
| Temperature 1 |  |
| Veto HV Monitor |  |
| Veto LLD |  |
| Alpha Counter | 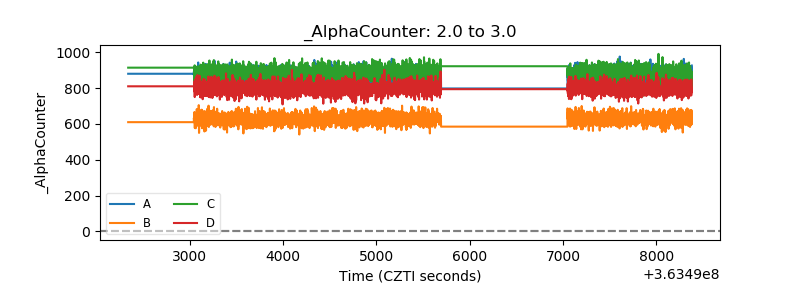 |
| _CPM_Rate | 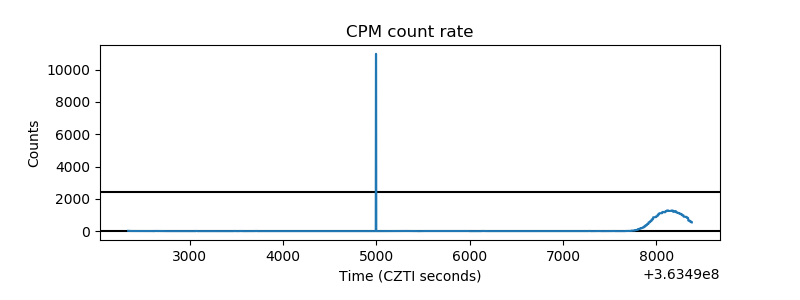 |
| CZT Counter |  |
| +2.5 Volts monitor |  |
| +5 Volts monitor |  |
| _ROLL_ROT | 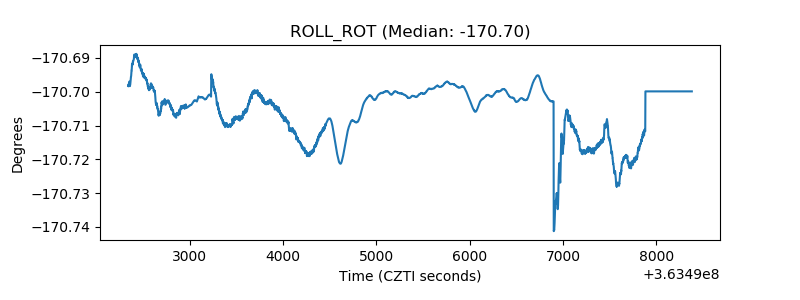 |
| _Roll_DEC | 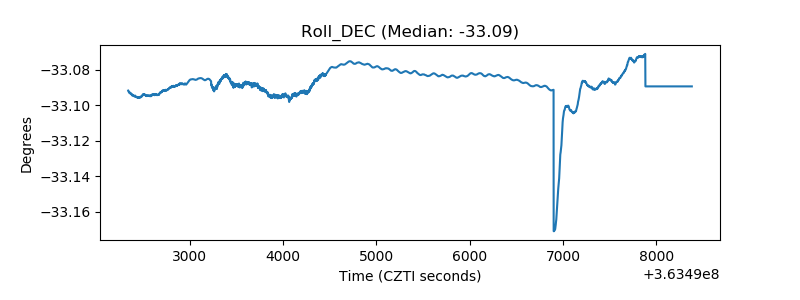 |
| _Roll_RA |  |
| Veto Counter | 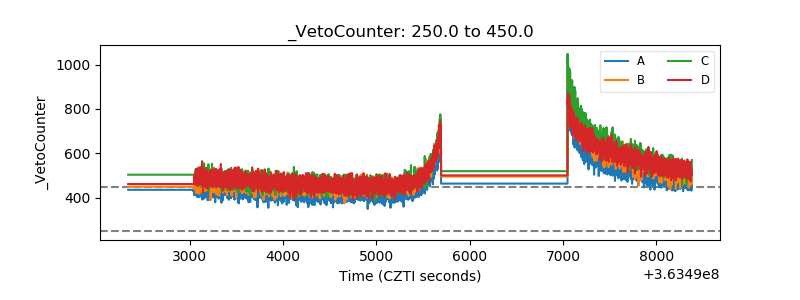 |