| Param | Original file | Final file |
|---|---|---|
| Filename | modeM0/AS1C06_006T06_9000004520cztM0_level2.fits | modeM0/AS1C06_006T06_9000004520cztM0_level2_quad_clean.evt |
| Size (bytes) | 84,430,080 | 46,336,320 |
| Size | 80.5 MB | 44.2 MB |
| Events in quadrant A | 545,524 | 228,465 |
| Events in quadrant B | 493,990 | 220,518 |
| Events in quadrant C | 513,508 | 212,736 |
| Events in quadrant D | 444,806 | 181,503 |
| Mode SS | |||
|---|---|---|---|
| Quadrant | BADHDUFLAG | Total packets | Discarded packets |
| A | 0 | 166 | 0 |
| B | 0 | 166 | 0 |
| C | 0 | 166 | 0 |
| D | 0 | 166 | 0 |
| Mode M0 | |||
|---|---|---|---|
| Quadrant | BADHDUFLAG | Total packets | Discarded packets |
| A | 0 | 17369 | 0 |
| B | 0 | 27500 | 0 |
| C | 0 | 18373 | 0 |
| D | 0 | 31740 | 0 |
| Mode M9 | |||
|---|---|---|---|
| Quadrant | BADHDUFLAG | Total packets | Discarded packets |
| A | 0 | 23 | 0 |
| B | 0 | 23 | 0 |
| C | 0 | 23 | 0 |
| D | 0 | 23 | 0 |
| Quadrant | Total seconds | Saturated seconds | Saturation percentage |
|---|---|---|---|
| A | 8043 | 216 | 2.685565% |
| B | 8043 | 697 | 8.665921% |
| C | 8043 | 412 | 5.122467% |
| D | 8043 | 775 | 9.635708% |
Noise dominated data is calculated using 1-second bins in cleaned event files. If a bin has >2000 counts, and if more than 50% of those come from <1% of pixels, then it is considered to be noise-dominated and hence unusable.
| Quadrant | # 1 sec bins | Bins with >0 counts | Bins with >2000 counts | High rate bins dominated by noise | Noise dominated (total time) | Noise dominated (detector-on time) | Marked lightcurve |
|---|---|---|---|---|---|---|---|
| A | 10353 | 8044 | 0 | 0 | 0.00% | 0.00% |  |
| B | 10353 | 8043 | 0 | 0 | 0.00% | 0.00% | 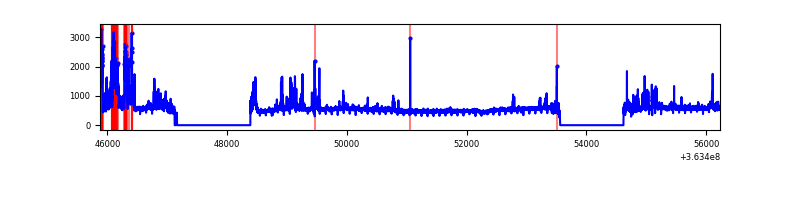 |
| C | 10353 | 8040 | 0 | 0 | 0.00% | 0.00% | 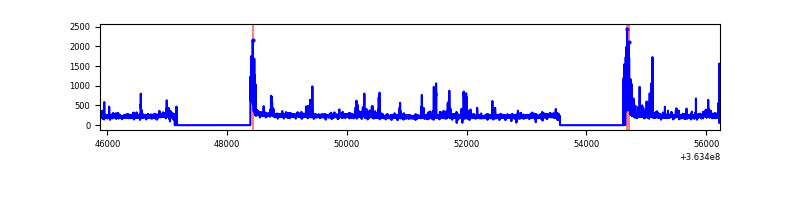 |
| D | 10353 | 8041 | 0 | 0 | 0.00% | 0.00% |  |
Top three noisy pixels from each quadrant. If the there are fewer than three noisy pixels in the level2.evt file, extra rows are filled as -1
| Pixel properties | Quadrant properties | ||||||
|---|---|---|---|---|---|---|---|
| Quadrant | DetID | PixID | Counts | Sigma | Mean | Median | Sigma |
| A | 0 | 29 | 542 | 11.48 | 142 | 134 | 35.5 |
| A | 7 | 110 | 477 | 9.65 | 142 | 134 | 35.5 |
| A | 0 | 30 | 434 | 8.44 | 142 | 134 | 35.5 |
| B | 2 | 9 | 368 | 8.98 | 130 | 125 | 27.1 |
| B | 5 | 255 | 334 | 7.72 | 130 | 125 | 27.1 |
| B | 3 | 17 | 332 | 7.65 | 130 | 125 | 27.1 |
| C | 9 | 209 | 369 | 6.74 | 136 | 128 | 35.8 |
| C | 3 | 187 | 364 | 6.6 | 136 | 128 | 35.8 |
| C | 3 | 126 | 359 | 6.46 | 136 | 128 | 35.8 |
| D | 15 | 63 | 336 | 6.31 | 127 | 117 | 34.7 |
| D | 6 | 231 | 323 | 5.93 | 127 | 117 | 34.7 |
| D | 10 | 113 | 321 | 5.87 | 127 | 117 | 34.7 |
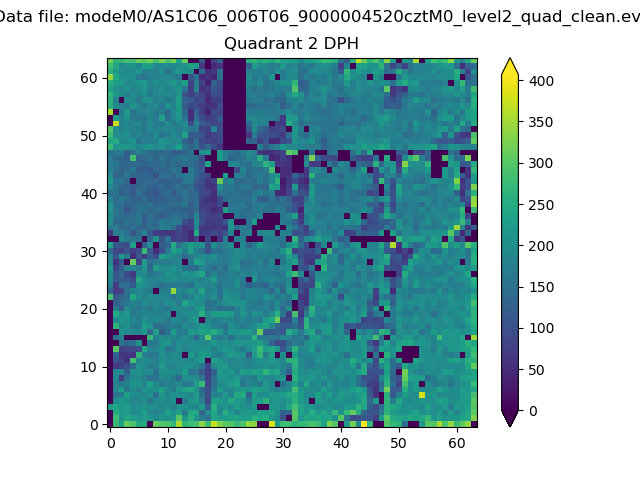
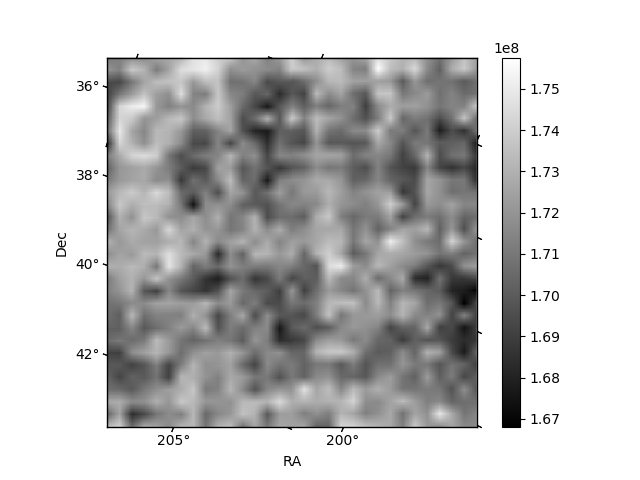
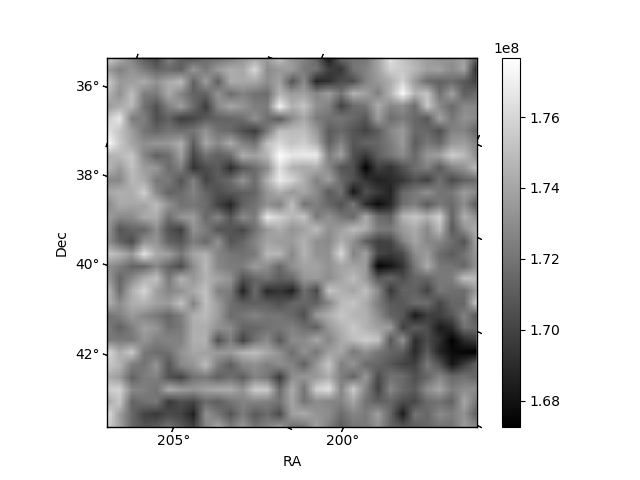
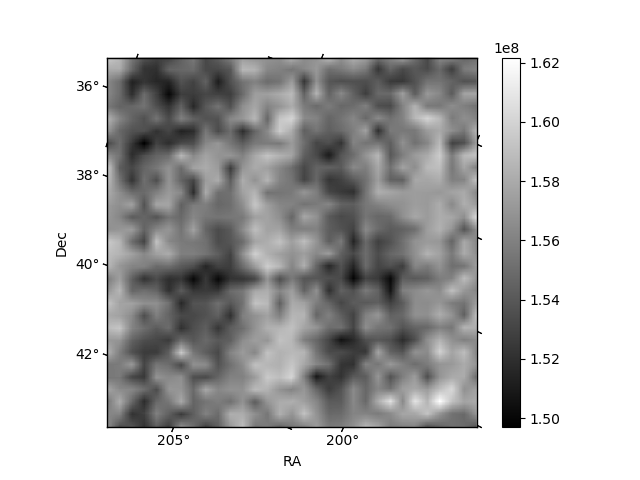
Histogram calculated using DETX and DETY for each event in the final _common_clean file
| Quadrant A | 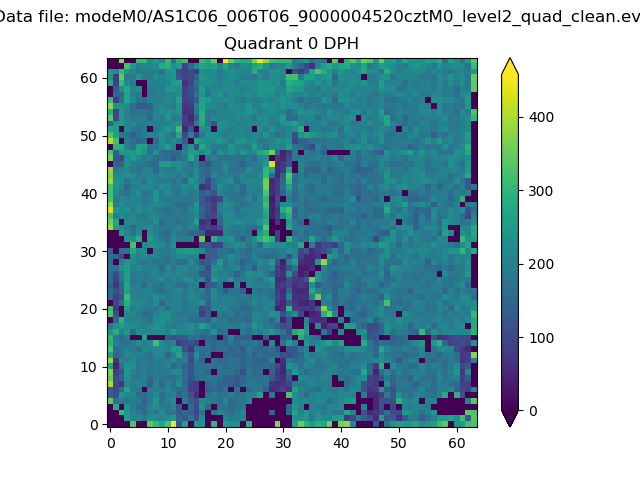 |
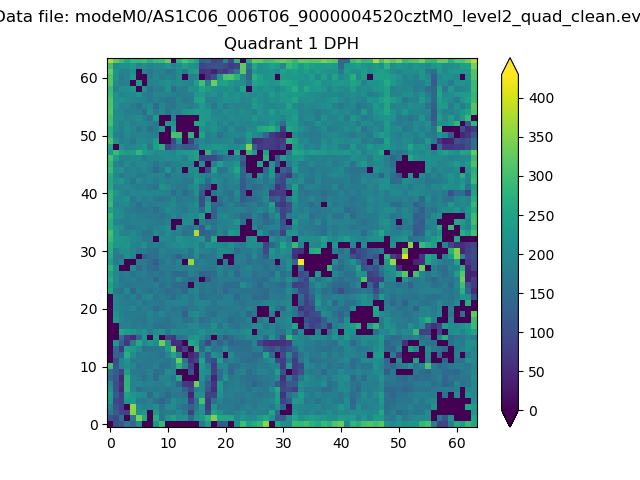 |
Quadrant B |
|---|---|---|---|
| Quadrant D |  |
 |
Quadrant C |
| Plot type | Count rate plots | Images |
|---|---|---|
| Comparison with Poisson distribution Blue bars denote a histogram of data divided into 1 sec bins. Red curve is a Poisson curve with rate = median count rate of data. |
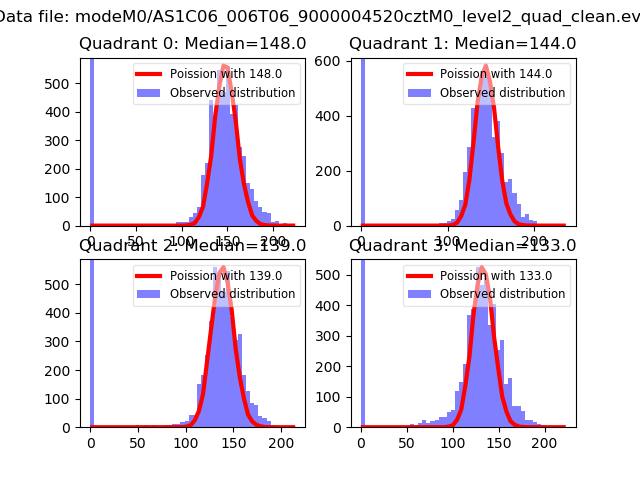 |
 |
| Quadrant-wise count rates Data is divided into 100 sec bins |
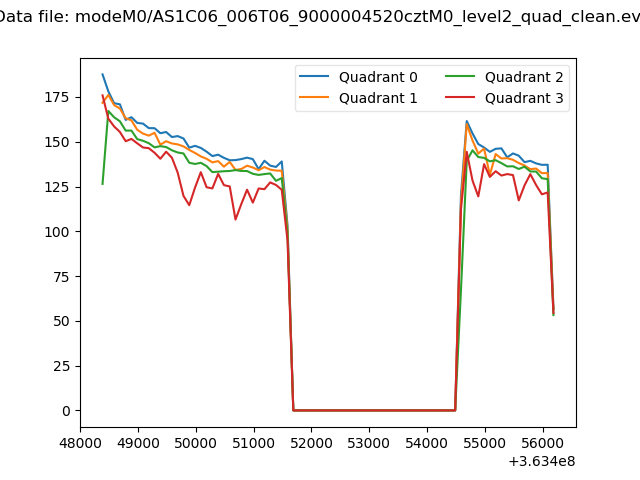 |
|
| Module-wise count rates for Quadrant A Data is divided into 100 sec bins |
 |
 |
| Module-wise count rates for Quadrant B Data is divided into 100 sec bins |
 |
 |
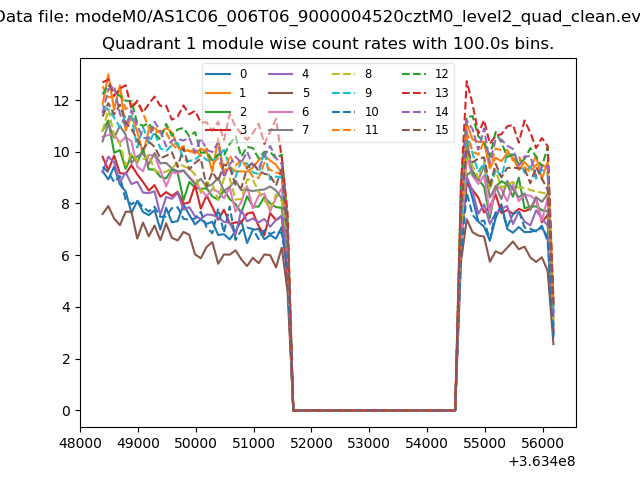
| Module-wise count rates for Quadrant C Data is divided into 100 sec bins |
 |
 |
| Module-wise count rates for Quadrant D Data is divided into 100 sec bins |
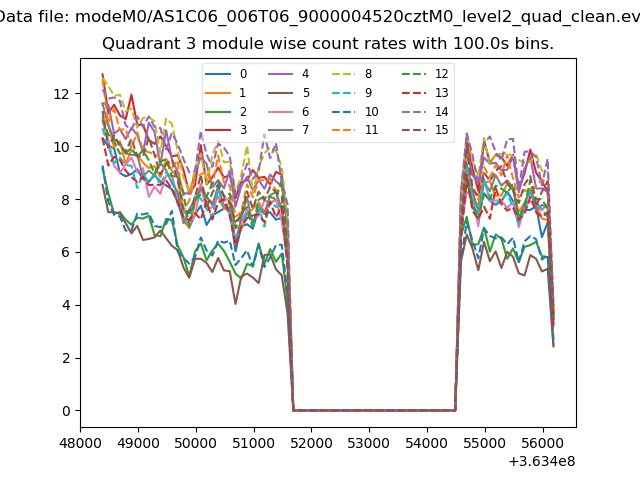 |
 |
| Parameter | Plot |
|---|---|
| CZT HV Monitor |  |
| D_VDD |  |
| Temperature 1 |  |
| Veto HV Monitor |  |
| Veto LLD |  |
| Alpha Counter |  |
| _CPM_Rate |  |
| CZT Counter |  |
| +2.5 Volts monitor |  |
| +5 Volts monitor | 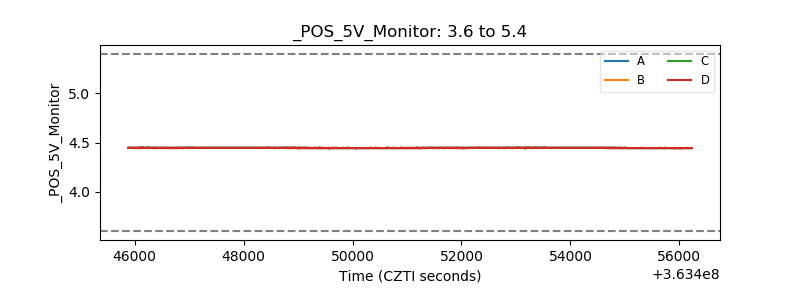 |
| _ROLL_ROT |  |
| _Roll_DEC | 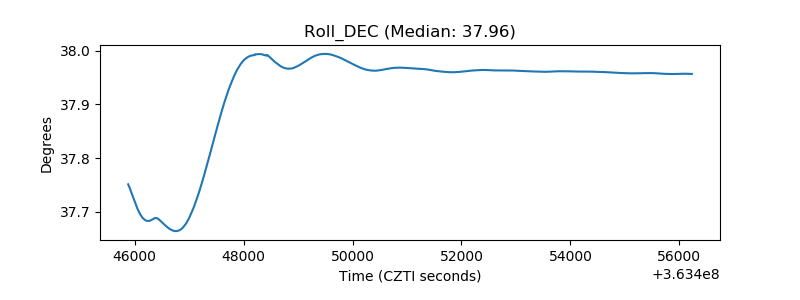 |
| _Roll_RA |  |
| Veto Counter | 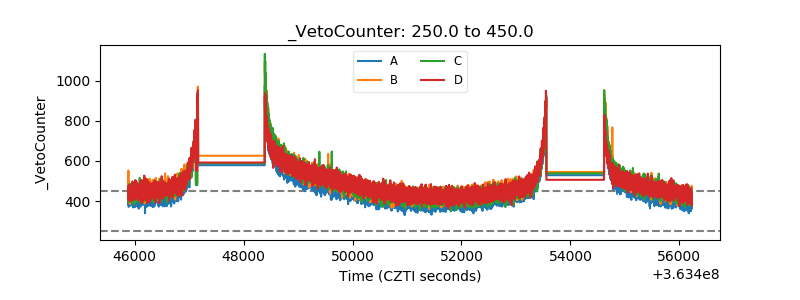 |