| Param | Original file | Final file |
|---|---|---|
| Filename | modeM0/AS1C06_006T06_9000004520_31240cztM0_level2.evt | modeM0/AS1C06_006T06_9000004520_31240cztM0_level2_quad_clean.evt |
| Size (bytes) | 129,951,360 | 25,865,280 |
| Size | 123.9 MB | 24.7 MB |
| Events in quadrant A | 622,560 | 178,979 |
| Events in quadrant B | 1,175,510 | 174,345 |
| Events in quadrant C | 686,189 | 171,020 |
| Events in quadrant D | 1,363,262 | 163,684 |
| Mode SS | |||
|---|---|---|---|
| Quadrant | BADHDUFLAG | Total packets | Discarded packets |
| A | 0 | 24 | 0 |
| B | 0 | 24 | 0 |
| C | 0 | 24 | 0 |
| D | 0 | 24 | 0 |
| Mode M0 | |||
|---|---|---|---|
| Quadrant | BADHDUFLAG | Total packets | Discarded packets |
| A | 0 | 2567 | 0 |
| B | 0 | 4209 | 0 |
| C | 0 | 2739 | 0 |
| D | 0 | 4948 | 0 |
| Quadrant | Total seconds | Saturated seconds | Saturation percentage |
|---|---|---|---|
| A | 1265 | 0 | 0.000000% |
| B | 1265 | 40 | 3.162055% |
| C | 1265 | 11 | 0.869565% |
| D | 1266 | 78 | 6.161137% |
Noise dominated data is calculated using 1-second bins in cleaned event files. If a bin has >2000 counts, and if more than 50% of those come from <1% of pixels, then it is considered to be noise-dominated and hence unusable.
| Quadrant | # 1 sec bins | Bins with >0 counts | Bins with >2000 counts | High rate bins dominated by noise | Noise dominated (total time) | Noise dominated (detector-on time) | Marked lightcurve |
|---|---|---|---|---|---|---|---|
| A | 1265 | 1265 | 0 | 0 | 0.00% | 0.00% | 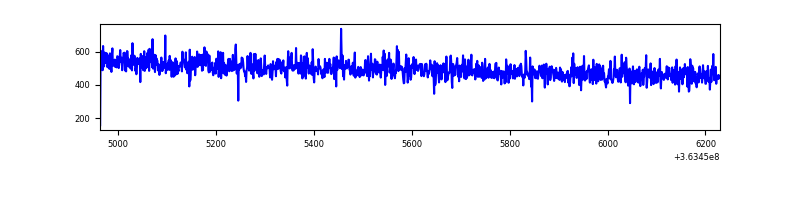 |
| B | 1265 | 1265 | 11 | 11 | 0.87% | 0.87% | 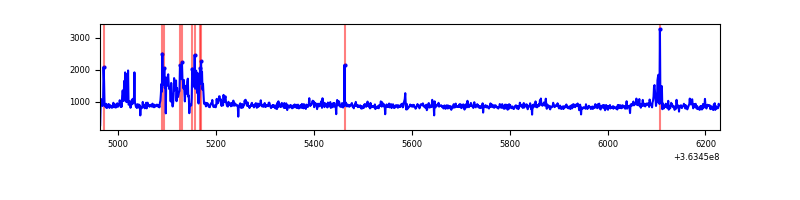 |
| C | 1265 | 1265 | 2 | 2 | 0.16% | 0.16% | 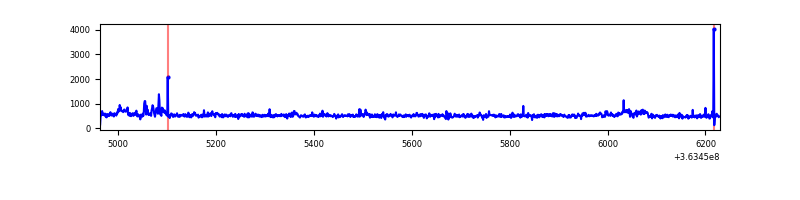 |
| D | 1266 | 1266 | 85 | 85 | 6.71% | 6.71% | 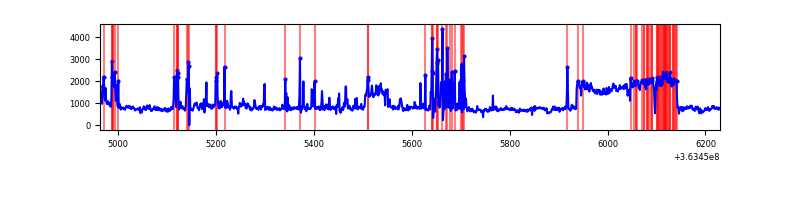 |
Top three noisy pixels from each quadrant. If the there are fewer than three noisy pixels in the level2.evt file, extra rows are filled as -1
| Pixel properties | Quadrant properties | ||||||
|---|---|---|---|---|---|---|---|
| Quadrant | DetID | PixID | Counts | Sigma | Mean | Median | Sigma |
| A | 13 | 254 | 2650 | 73.39 | 160 | 158 | 34.0 |
| A | 3 | 137 | 1409 | 36.84 | 160 | 158 | 34.0 |
| A | 0 | 226 | 1404 | 36.7 | 160 | 158 | 34.0 |
| B | 6 | 159 | 444501 | 14345.21 | 156 | 153 | 31.0 |
| B | 0 | 190 | 89112 | 2871.93 | 156 | 153 | 31.0 |
| B | 14 | 167 | 11157 | 355.25 | 156 | 153 | 31.0 |
| C | 3 | 233 | 33324 | 881.99 | 154 | 154 | 37.6 |
| C | 14 | 238 | 24850 | 656.67 | 154 | 154 | 37.6 |
| C | 0 | 10 | 22048 | 582.16 | 154 | 154 | 37.6 |
| D | 8 | 195 | 544744 | 14271.16 | 154 | 150 | 38.2 |
| D | 13 | 249 | 91261 | 2387.58 | 154 | 150 | 38.2 |
| D | 12 | 6 | 86826 | 2271.36 | 154 | 150 | 38.2 |
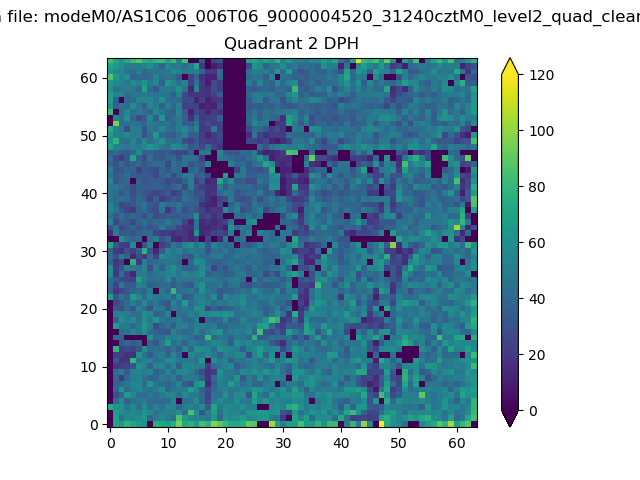
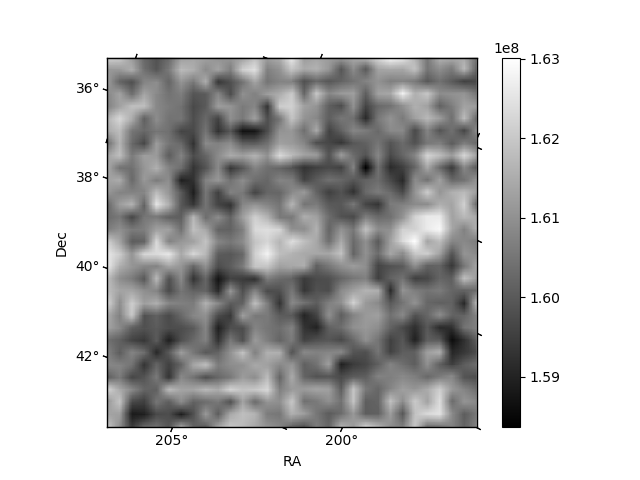
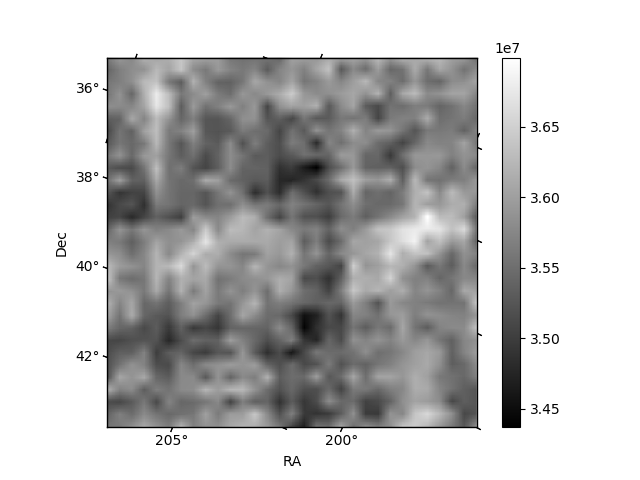
Histogram calculated using DETX and DETY for each event in the final _common_clean file
| Quadrant A | 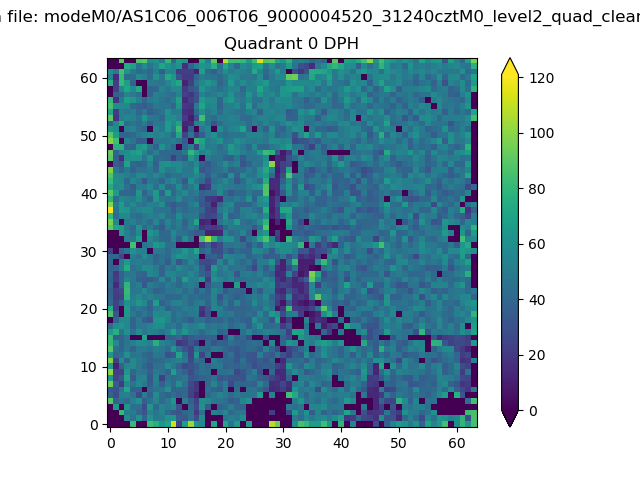 |
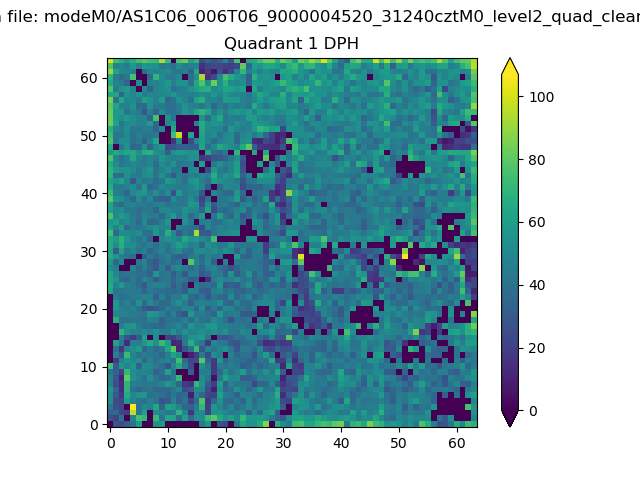 |
Quadrant B |
|---|---|---|---|
| Quadrant D | 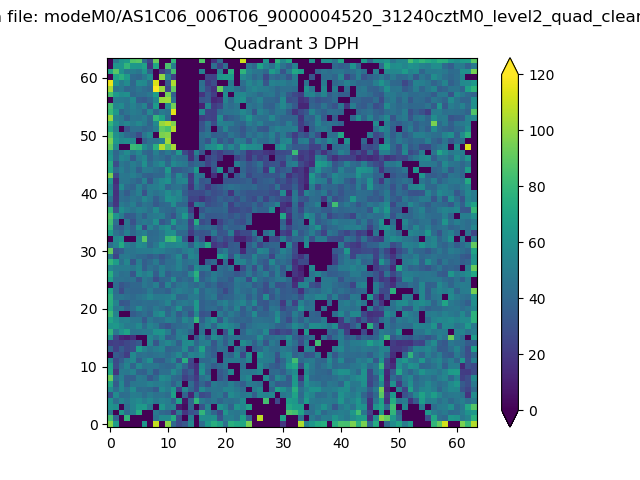 |
 |
Quadrant C |
| Plot type | Count rate plots | Images |
|---|---|---|
| Comparison with Poisson distribution Blue bars denote a histogram of data divided into 1 sec bins. Red curve is a Poisson curve with rate = median count rate of data. |
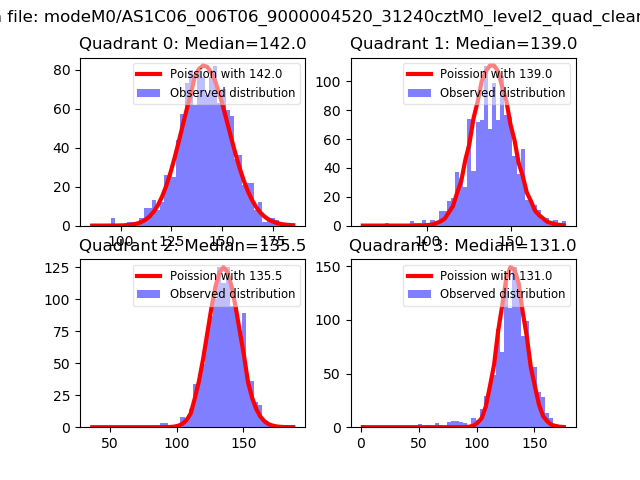 |
 |
| Quadrant-wise count rates Data is divided into 100 sec bins |
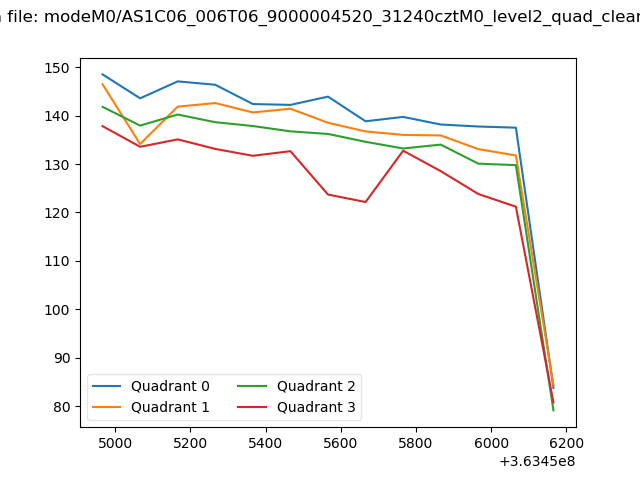 |
|
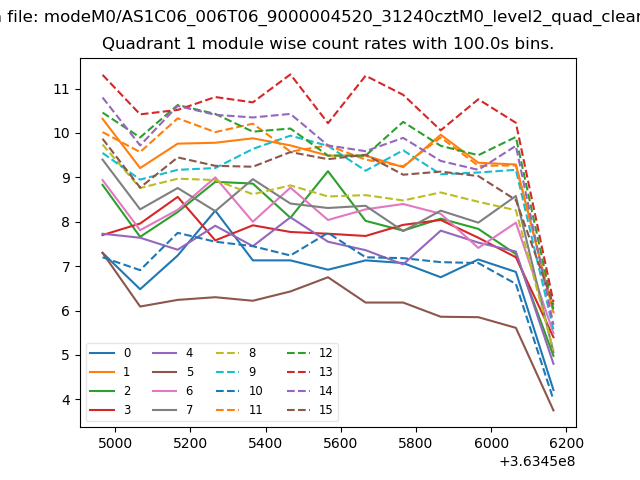
| Module-wise count rates for Quadrant A Data is divided into 100 sec bins |
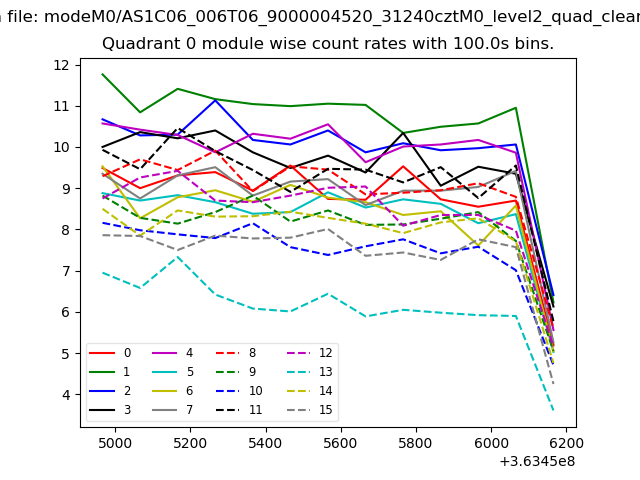 |
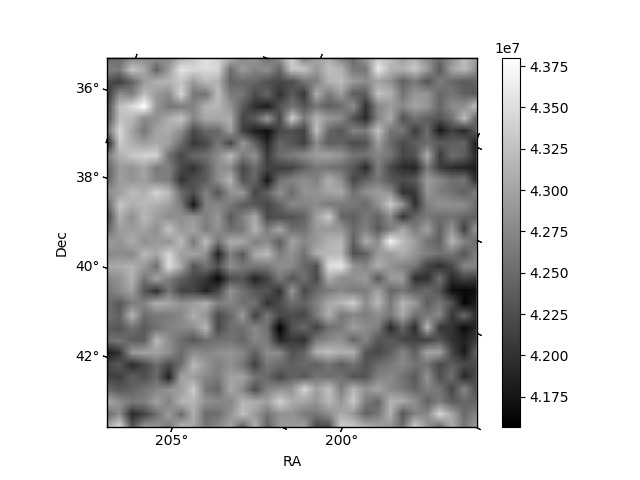 |
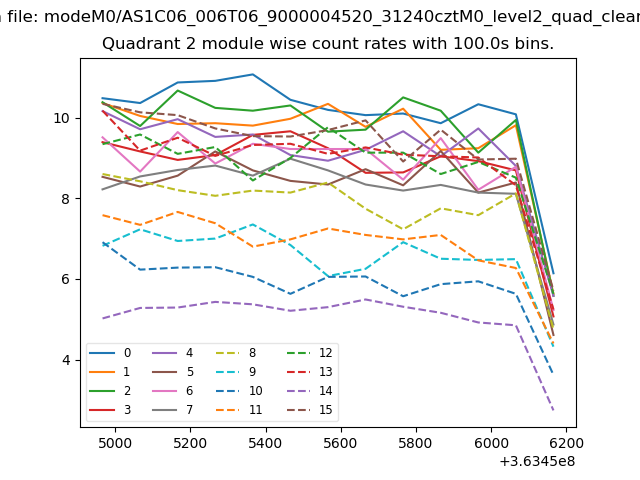
| Module-wise count rates for Quadrant B Data is divided into 100 sec bins |
 |
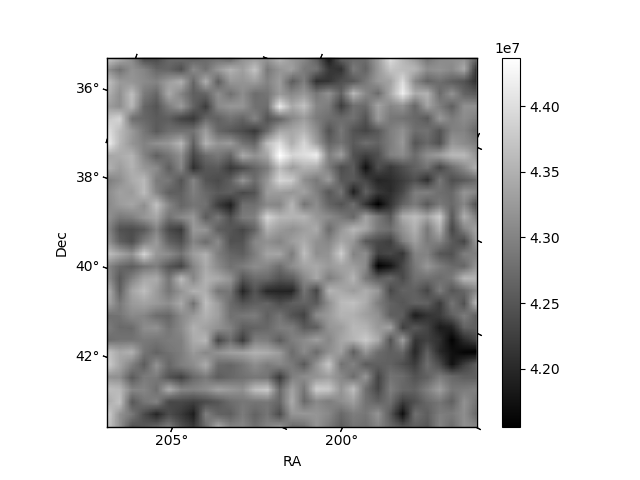 |
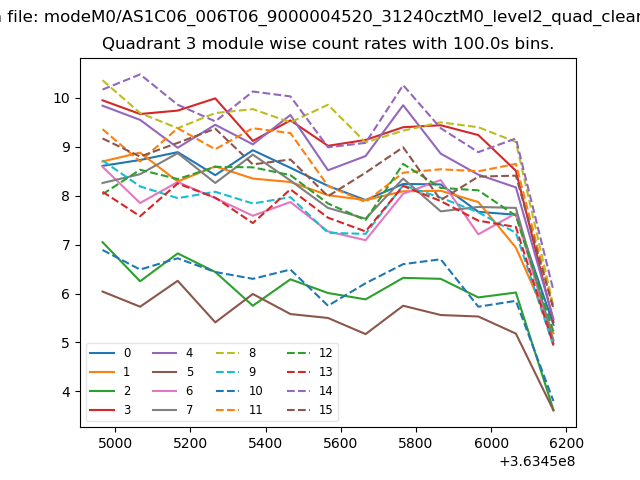
| Module-wise count rates for Quadrant C Data is divided into 100 sec bins |
 |
 |
| Module-wise count rates for Quadrant D Data is divided into 100 sec bins |
 |
 |
| Parameter | Plot |
|---|---|
| CZT HV Monitor | 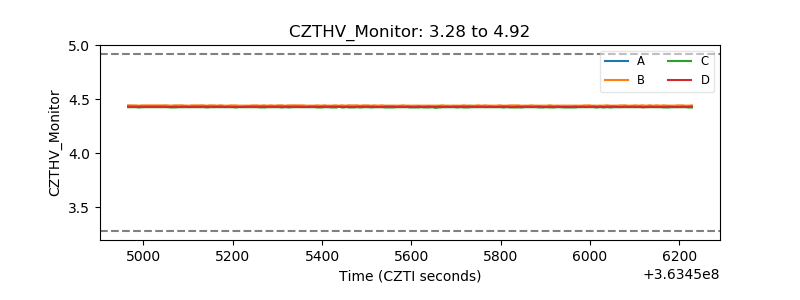 |
| D_VDD | 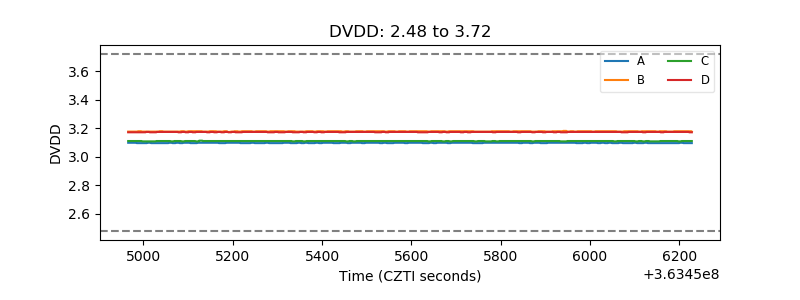 |
| Temperature 1 | 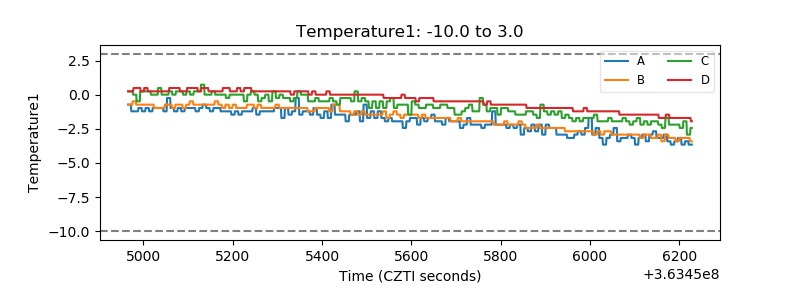 |
| Veto HV Monitor | 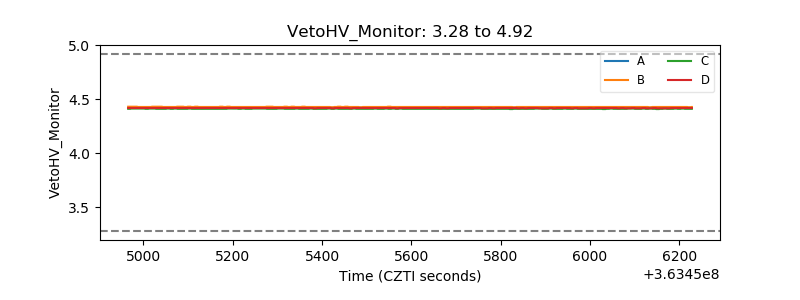 |
| Veto LLD | 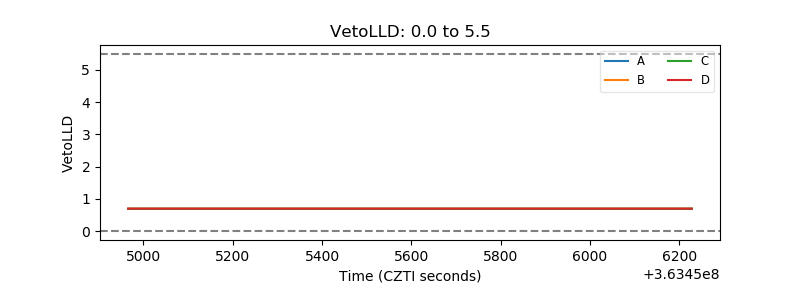 |
| Alpha Counter | 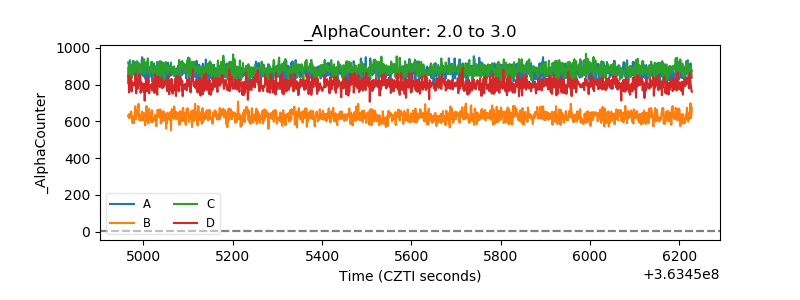 |
| _CPM_Rate | 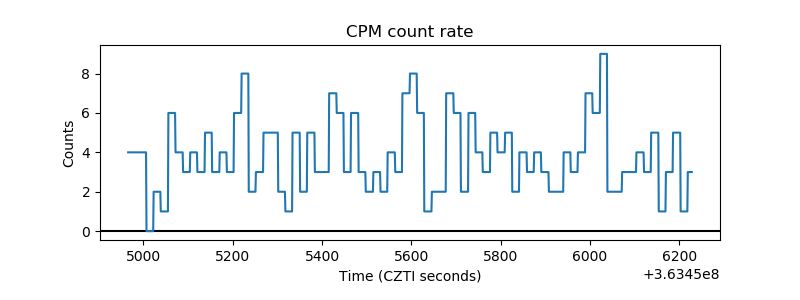 |
| CZT Counter | 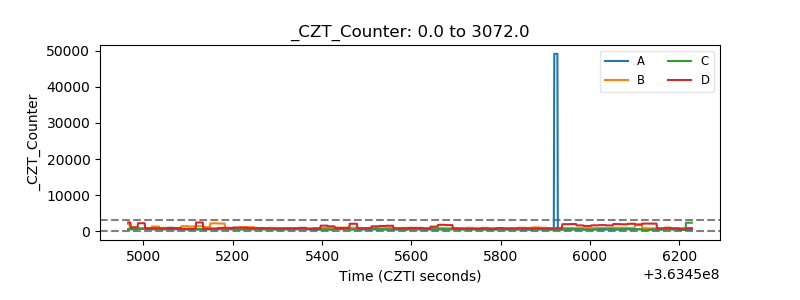 |
| +2.5 Volts monitor | 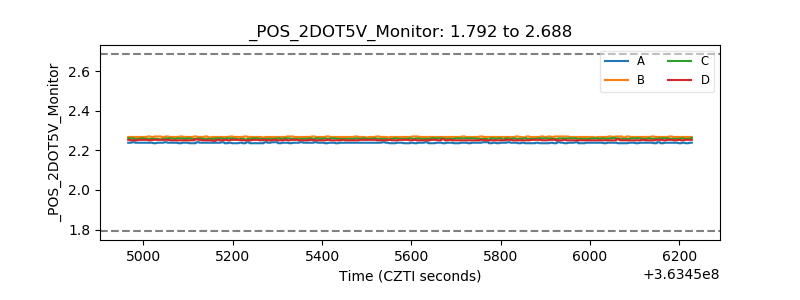 |
| +5 Volts monitor | 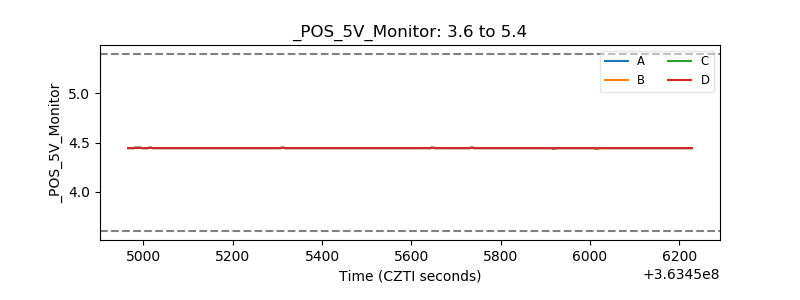 |
| _ROLL_ROT | 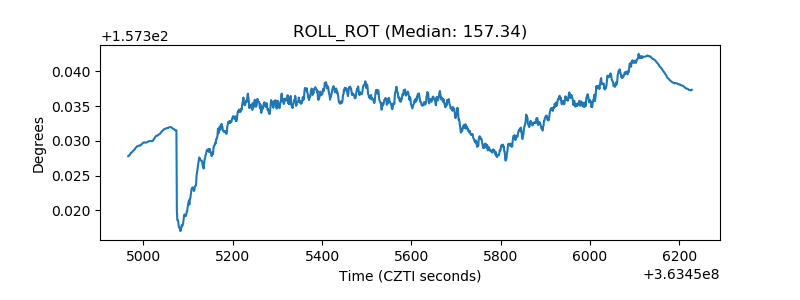 |
| _Roll_DEC |  |
| _Roll_RA | 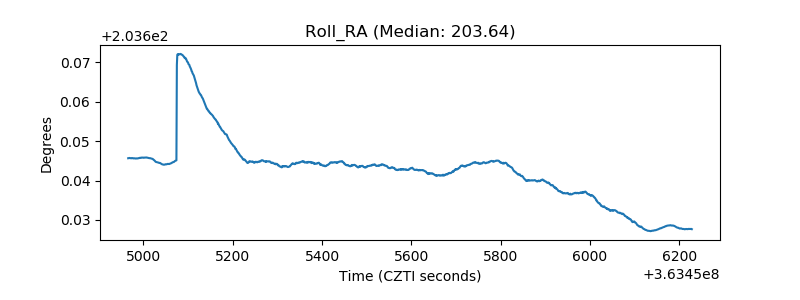 |
| Veto Counter | 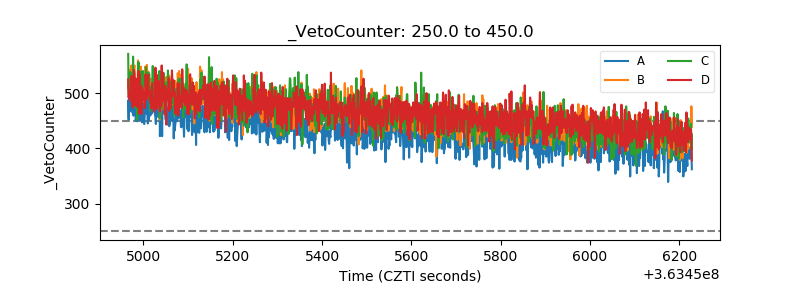 |