| Param | Original file | Final file |
|---|---|---|
| Filename | modeM0/AS1A10_113T01_9000004524cztM0_level2.fits | modeM0/AS1A10_113T01_9000004524cztM0_level2_quad_clean.evt |
| Size (bytes) | 278,706,240 | 234,282,240 |
| Size | 265.8 MB | 223.4 MB |
| Events in quadrant A | 1,740,104 | 1,359,364 |
| Events in quadrant B | 1,614,696 | 1,331,780 |
| Events in quadrant C | 1,653,492 | 1,268,468 |
| Events in quadrant D | 1,479,950 | 1,181,618 |
| Mode SS | |||
|---|---|---|---|
| Quadrant | BADHDUFLAG | Total packets | Discarded packets |
| A | 0 | 580 | 0 |
| B | 0 | 580 | 0 |
| C | 0 | 580 | 0 |
| D | 0 | 580 | 0 |
| Mode M0 | |||
|---|---|---|---|
| Quadrant | BADHDUFLAG | Total packets | Discarded packets |
| A | 0 | 58272 | 0 |
| B | 0 | 86469 | 0 |
| C | 0 | 62358 | 0 |
| D | 0 | 68608 | 0 |
| Mode M9 | |||
|---|---|---|---|
| Quadrant | BADHDUFLAG | Total packets | Discarded packets |
| A | 0 | 40 | 0 |
| B | 0 | 40 | 0 |
| C | 0 | 40 | 0 |
| D | 0 | 40 | 0 |
| Quadrant | Total seconds | Saturated seconds | Saturation percentage |
|---|---|---|---|
| A | 28395 | 124 | 0.436697% |
| B | 28395 | 447 | 1.574221% |
| C | 28395 | 637 | 2.243353% |
| D | 28395 | 248 | 0.873393% |
Noise dominated data is calculated using 1-second bins in cleaned event files. If a bin has >2000 counts, and if more than 50% of those come from <1% of pixels, then it is considered to be noise-dominated and hence unusable.
| Quadrant | # 1 sec bins | Bins with >0 counts | Bins with >2000 counts | High rate bins dominated by noise | Noise dominated (total time) | Noise dominated (detector-on time) | Marked lightcurve |
|---|---|---|---|---|---|---|---|
| A | 32455 | 28395 | 0 | 0 | 0.00% | 0.00% |  |
| B | 32455 | 28395 | 0 | 0 | 0.00% | 0.00% |  |
| C | 32455 | 28395 | 0 | 0 | 0.00% | 0.00% |  |
| D | 32455 | 28395 | 0 | 0 | 0.00% | 0.00% |  |
Top three noisy pixels from each quadrant. If the there are fewer than three noisy pixels in the level2.evt file, extra rows are filled as -1
| Pixel properties | Quadrant properties | ||||||
|---|---|---|---|---|---|---|---|
| Quadrant | DetID | PixID | Counts | Sigma | Mean | Median | Sigma |
| A | 0 | 29 | 1718 | 11.47 | 453 | 426 | 112.6 |
| A | 0 | 30 | 1390 | 8.56 | 453 | 426 | 112.6 |
| A | 7 | 110 | 1365 | 8.34 | 453 | 426 | 112.6 |
| B | 2 | 9 | 1337 | 10.67 | 427 | 408 | 87.1 |
| B | 2 | 8 | 1110 | 8.06 | 427 | 408 | 87.1 |
| B | 3 | 17 | 1099 | 7.94 | 427 | 408 | 87.1 |
| C | 9 | 209 | 1177 | 6.85 | 437 | 408 | 112.2 |
| C | 3 | 126 | 1156 | 6.66 | 437 | 408 | 112.2 |
| C | 12 | 241 | 1154 | 6.65 | 437 | 408 | 112.2 |
| D | 7 | 3 | 1062 | 5.99 | 422 | 384 | 113.1 |
| D | 6 | 231 | 1062 | 5.99 | 422 | 384 | 113.1 |
| D | 6 | 67 | 1025 | 5.66 | 422 | 384 | 113.1 |
Histogram calculated using DETX and DETY for each event in the final _common_clean file
| Quadrant A |  |
 |
Quadrant B |
|---|---|---|---|
| Quadrant D | 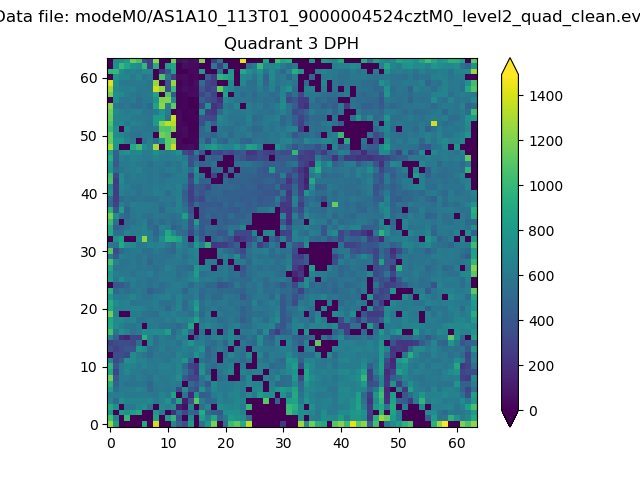 |
 |
Quadrant C |
| Plot type | Count rate plots | Images |
|---|---|---|
| Comparison with Poisson distribution Blue bars denote a histogram of data divided into 1 sec bins. Red curve is a Poisson curve with rate = median count rate of data. |
 |
 |
| Quadrant-wise count rates Data is divided into 100 sec bins |
 |
|
| Module-wise count rates for Quadrant A Data is divided into 100 sec bins |
 |
 |
| Module-wise count rates for Quadrant B Data is divided into 100 sec bins |
 |
 |
| Module-wise count rates for Quadrant C Data is divided into 100 sec bins |
 |
 |
| Module-wise count rates for Quadrant D Data is divided into 100 sec bins |
 |
 |
| Parameter | Plot |
|---|---|
| CZT HV Monitor |  |
| D_VDD |  |
| Temperature 1 |  |
| Veto HV Monitor |  |
| Veto LLD |  |
| Alpha Counter |  |
| _CPM_Rate |  |
| CZT Counter |  |
| +2.5 Volts monitor |  |
| +5 Volts monitor |  |
| _ROLL_ROT |  |
| _Roll_DEC |  |
| _Roll_RA |  |
| Veto Counter |  |