| Param | Original file | Final file |
|---|---|---|
| Filename | modeM0/AS1A10_113T01_9000004524_31260cztM0_level2.evt | modeM0/AS1A10_113T01_9000004524_31260cztM0_level2_quad_clean.evt |
| Size (bytes) | 1,213,868,160 | 194,791,680 |
| Size | 1.1 GB | 185.8 MB |
| Events in quadrant A | 7,176,717 | 1,240,070 |
| Events in quadrant B | 11,812,332 | 1,227,113 |
| Events in quadrant C | 7,919,977 | 1,192,220 |
| Events in quadrant D | 8,820,766 | 1,184,456 |
| Mode SS | |||
|---|---|---|---|
| Quadrant | BADHDUFLAG | Total packets | Discarded packets |
| A | 0 | 314 | 0 |
| B | 0 | 314 | 0 |
| C | 0 | 314 | 0 |
| D | 0 | 314 | 0 |
| Mode M0 | |||
|---|---|---|---|
| Quadrant | BADHDUFLAG | Total packets | Discarded packets |
| A | 0 | 31251 | 4 |
| B | 0 | 46666 | 3 |
| C | 0 | 33315 | 3 |
| D | 0 | 36824 | 3 |
| Mode M9 | |||
|---|---|---|---|
| Quadrant | BADHDUFLAG | Total packets | Discarded packets |
| A | 0 | 19 | 0 |
| B | 0 | 19 | 0 |
| C | 0 | 19 | 0 |
| D | 0 | 19 | 0 |
| Quadrant | Total seconds | Saturated seconds | Saturation percentage |
|---|---|---|---|
| A | 15292 | 54 | 0.353126% |
| B | 15292 | 252 | 1.647920% |
| C | 15292 | 347 | 2.269160% |
| D | 15292 | 100 | 0.653937% |
Noise dominated data is calculated using 1-second bins in cleaned event files. If a bin has >2000 counts, and if more than 50% of those come from <1% of pixels, then it is considered to be noise-dominated and hence unusable.
| Quadrant | # 1 sec bins | Bins with >0 counts | Bins with >2000 counts | High rate bins dominated by noise | Noise dominated (total time) | Noise dominated (detector-on time) | Marked lightcurve |
|---|---|---|---|---|---|---|---|
| A | 17277 | 15295 | 0 | 0 | 0.00% | 0.00% | 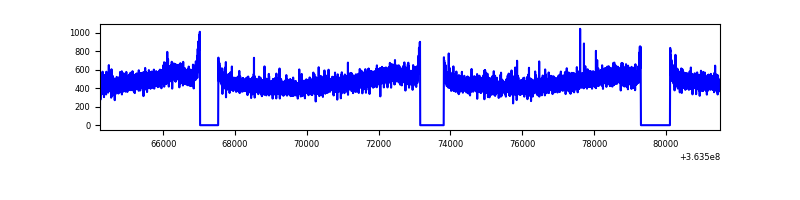 |
| B | 17277 | 15295 | 24 | 24 | 0.14% | 0.16% | 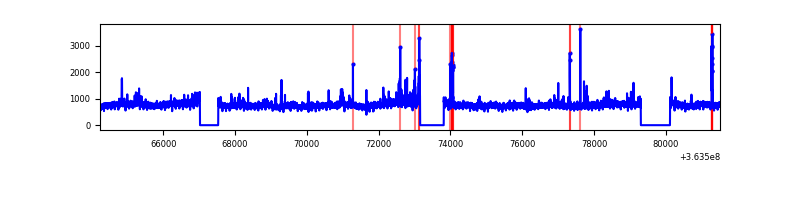 |
| C | 17277 | 15295 | 50 | 50 | 0.29% | 0.33% | 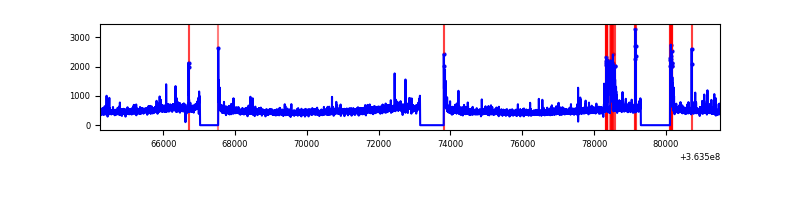 |
| D | 17277 | 15295 | 33 | 33 | 0.19% | 0.22% | 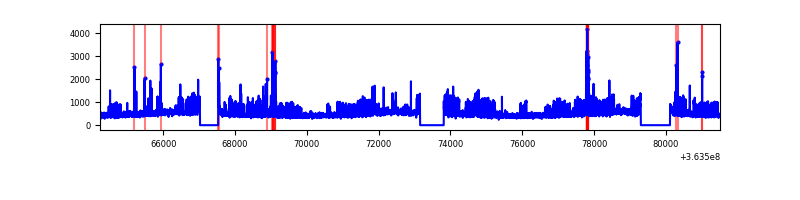 |
Top three noisy pixels from each quadrant. If the there are fewer than three noisy pixels in the level2.evt file, extra rows are filled as -1
| Pixel properties | Quadrant properties | ||||||
|---|---|---|---|---|---|---|---|
| Quadrant | DetID | PixID | Counts | Sigma | Mean | Median | Sigma |
| A | 13 | 254 | 27149 | 68.25 | 1858 | 1819 | 371.1 |
| A | 3 | 137 | 19483 | 47.59 | 1858 | 1819 | 371.1 |
| A | 0 | 226 | 15731 | 37.48 | 1858 | 1819 | 371.1 |
| B | 6 | 159 | 4241760 | 12113.8 | 1828 | 1779 | 350.0 |
| B | 4 | 80 | 130653 | 368.2 | 1828 | 1779 | 350.0 |
| B | 0 | 190 | 108284 | 304.29 | 1828 | 1779 | 350.0 |
| C | 0 | 10 | 378221 | 901.68 | 1779 | 1787 | 417.5 |
| C | 14 | 238 | 291288 | 693.45 | 1779 | 1787 | 417.5 |
| C | 3 | 233 | 271853 | 646.9 | 1779 | 1787 | 417.5 |
| D | 8 | 195 | 1580010 | 3423.48 | 1790 | 1756 | 461.0 |
| D | 2 | 250 | 255314 | 550.01 | 1790 | 1756 | 461.0 |
| D | 12 | 233 | 75824 | 160.67 | 1790 | 1756 | 461.0 |
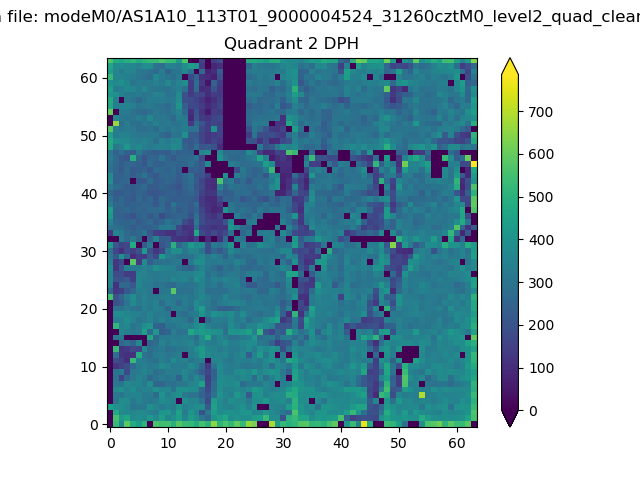
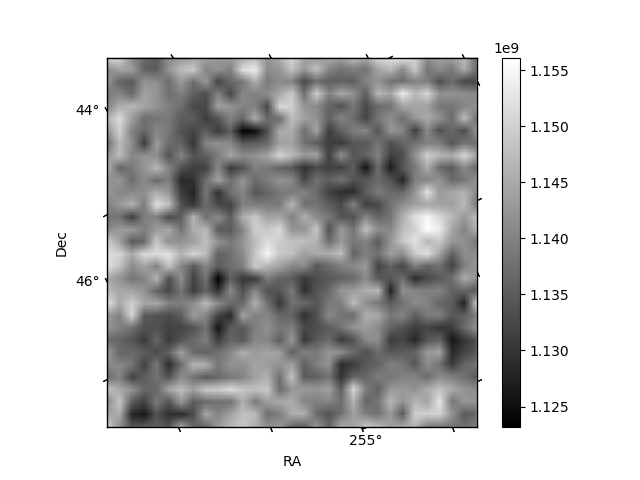
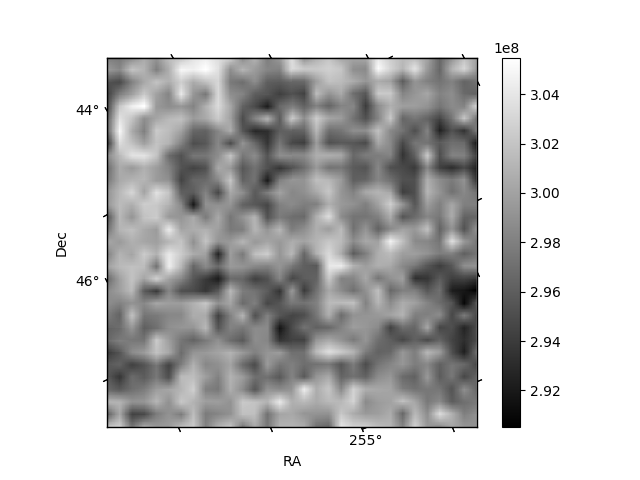
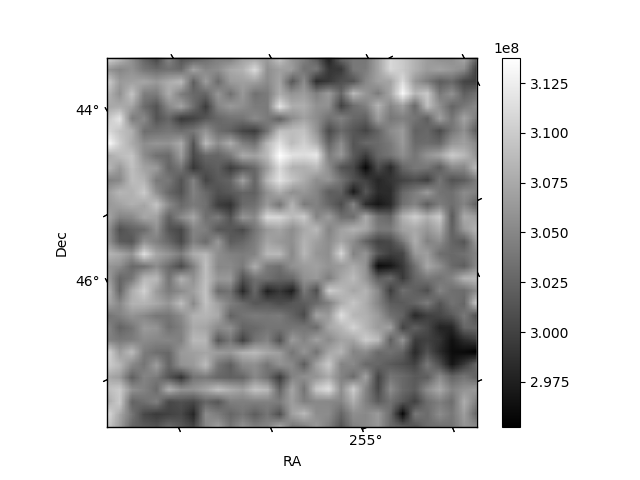
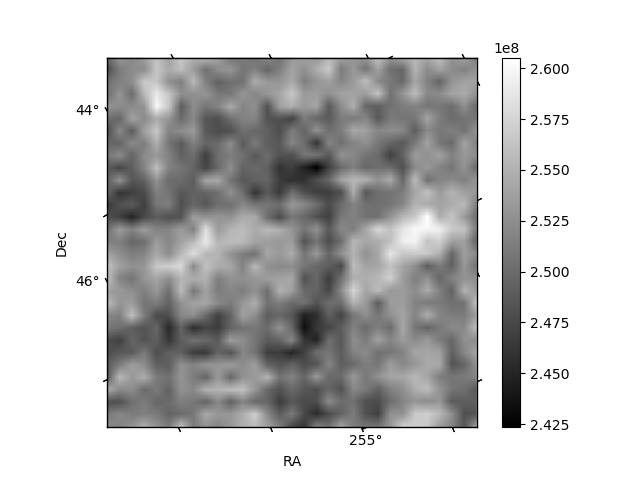
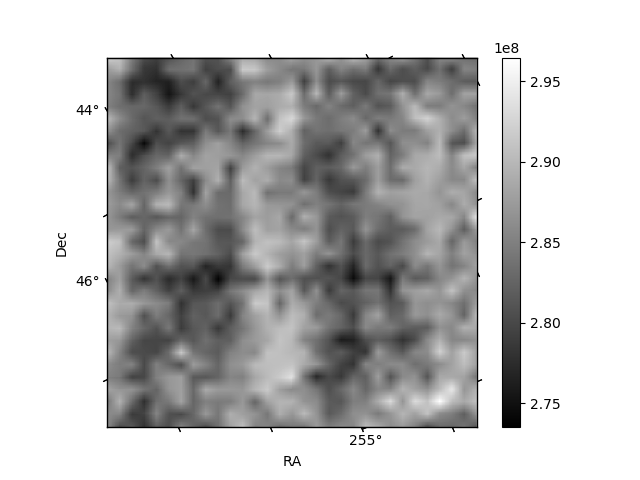
Histogram calculated using DETX and DETY for each event in the final _common_clean file
| Quadrant A | 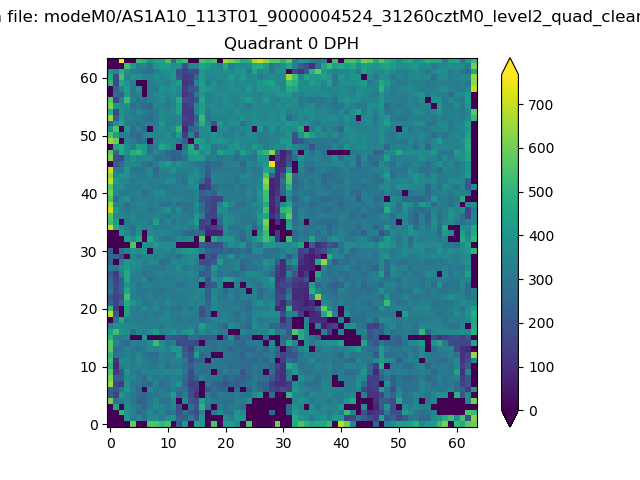 |
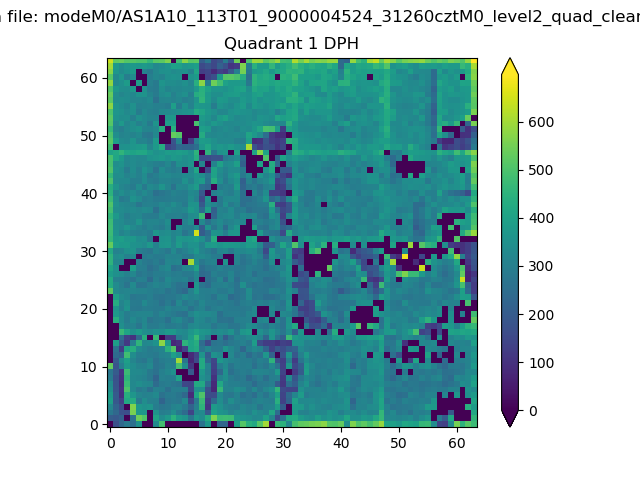 |
Quadrant B |
|---|---|---|---|
| Quadrant D | 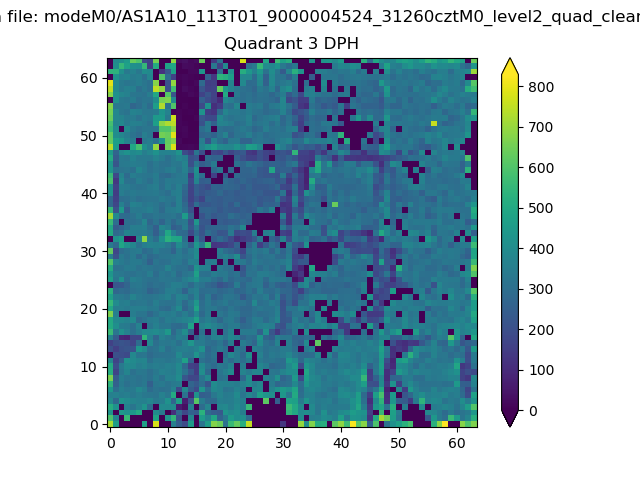 |
 |
Quadrant C |
| Plot type | Count rate plots | Images |
|---|---|---|
| Comparison with Poisson distribution Blue bars denote a histogram of data divided into 1 sec bins. Red curve is a Poisson curve with rate = median count rate of data. |
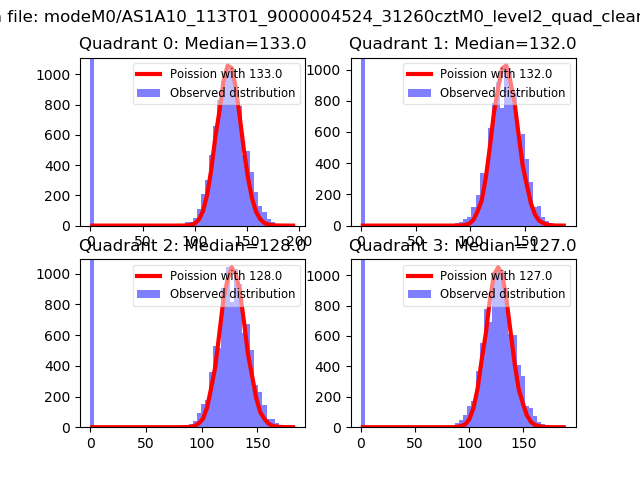 |
 |
| Quadrant-wise count rates Data is divided into 100 sec bins |
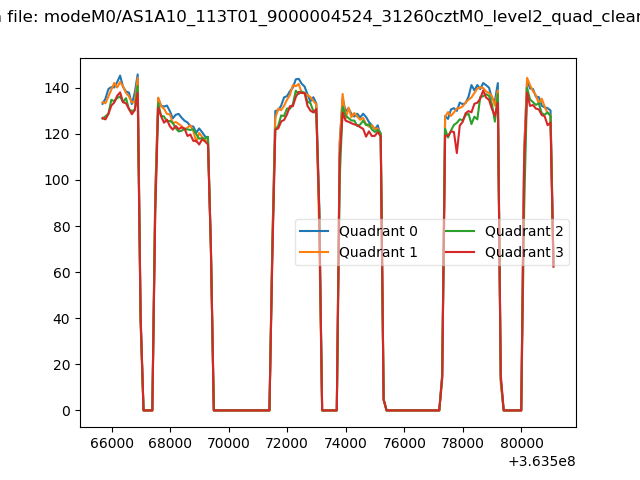 |
|
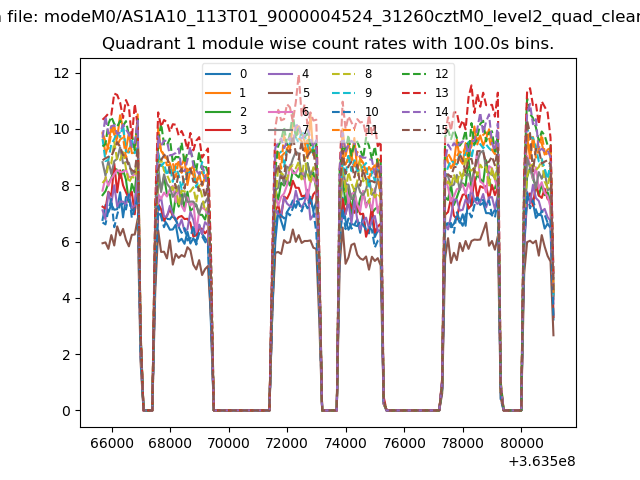
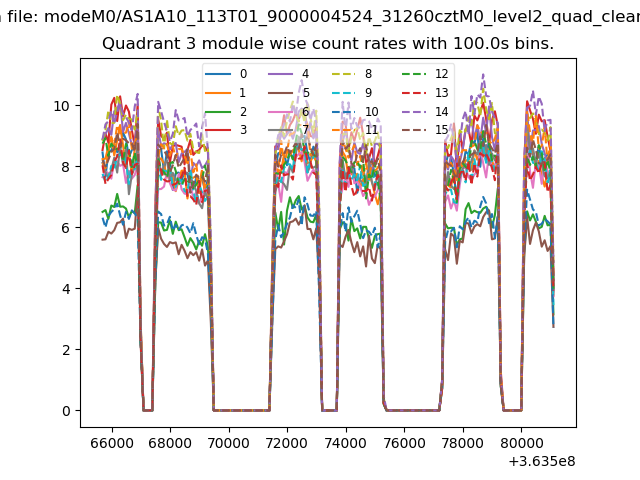
| Module-wise count rates for Quadrant A Data is divided into 100 sec bins |
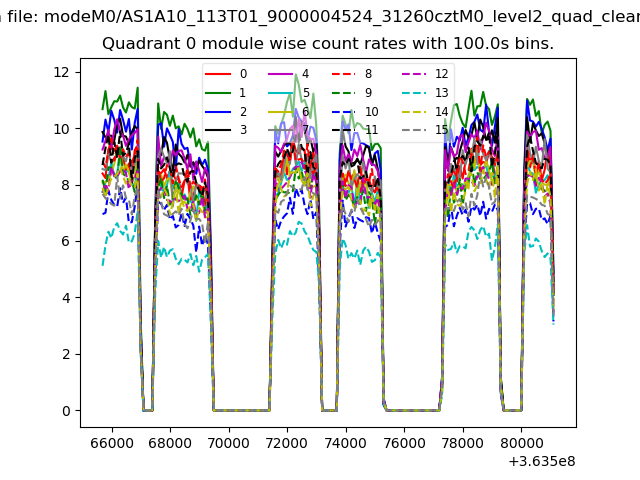 |
 |
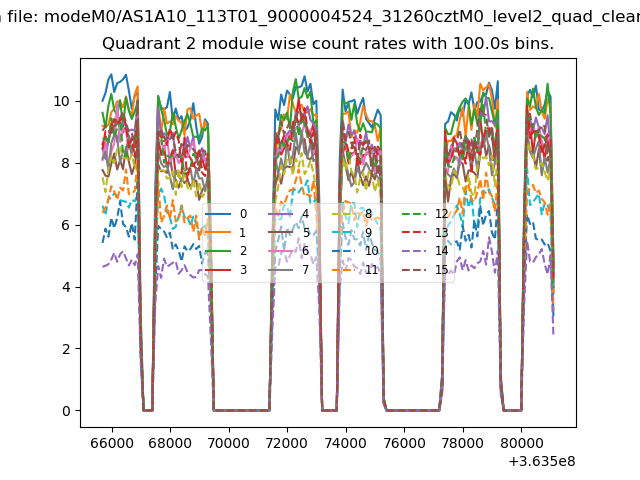
| Module-wise count rates for Quadrant B Data is divided into 100 sec bins |
 |
 |
| Module-wise count rates for Quadrant C Data is divided into 100 sec bins |
 |
 |
| Module-wise count rates for Quadrant D Data is divided into 100 sec bins |
 |
 |
| Parameter | Plot |
|---|---|
| CZT HV Monitor | 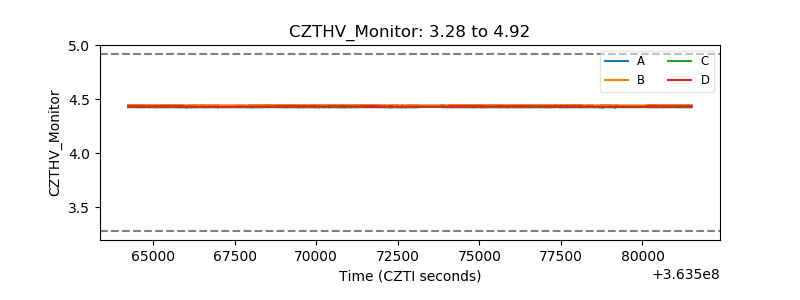 |
| D_VDD | 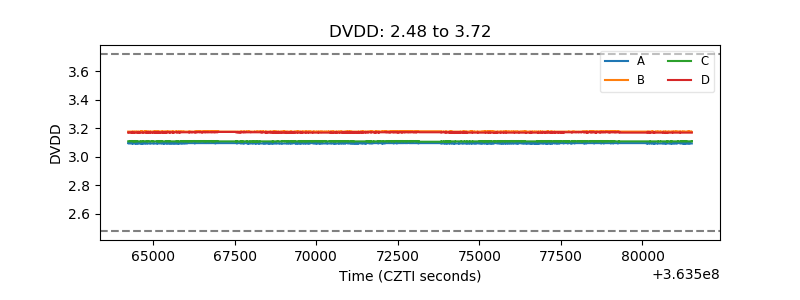 |
| Temperature 1 | 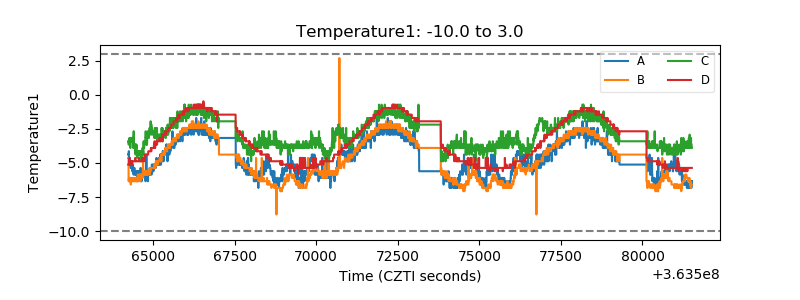 |
| Veto HV Monitor | 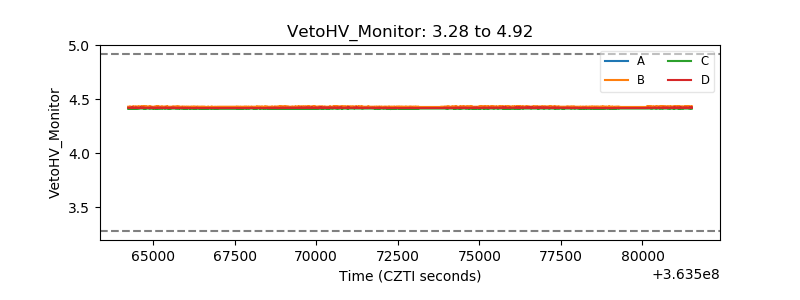 |
| Veto LLD | 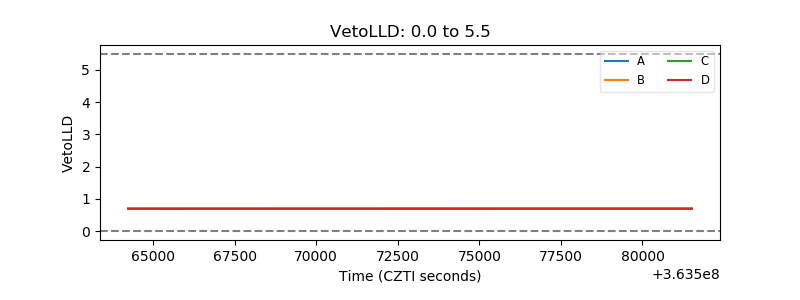 |
| Alpha Counter | 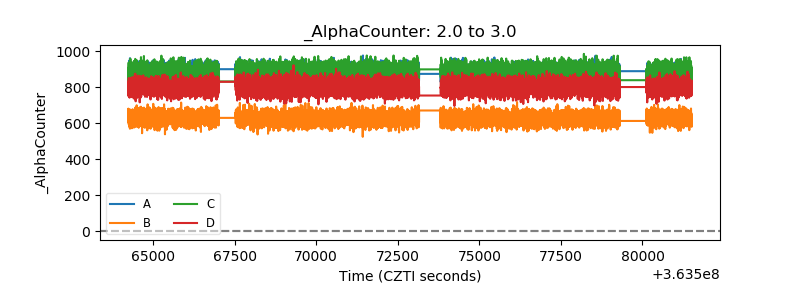 |
| _CPM_Rate | 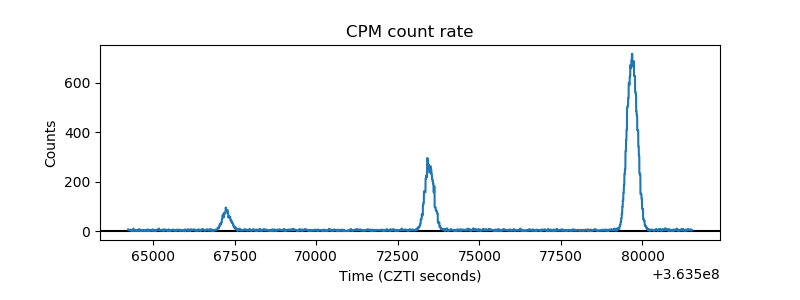 |
| CZT Counter | 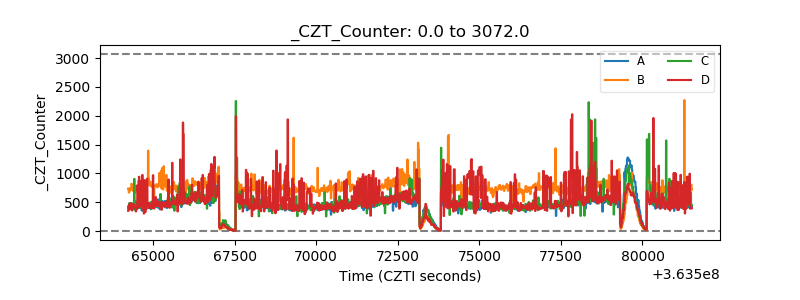 |
| +2.5 Volts monitor |  |
| +5 Volts monitor |  |
| _ROLL_ROT | 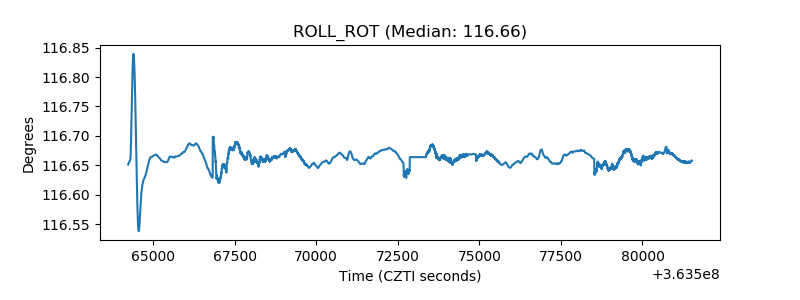 |
| _Roll_DEC | 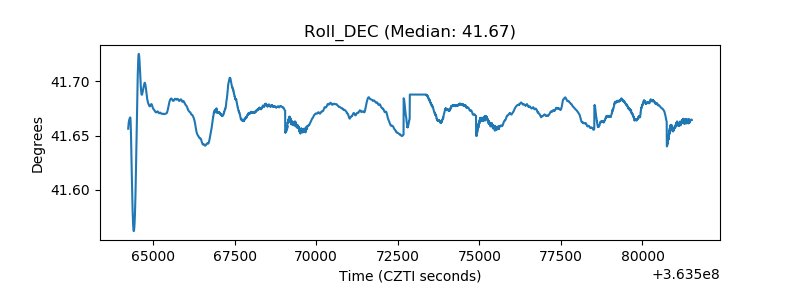 |
| _Roll_RA | 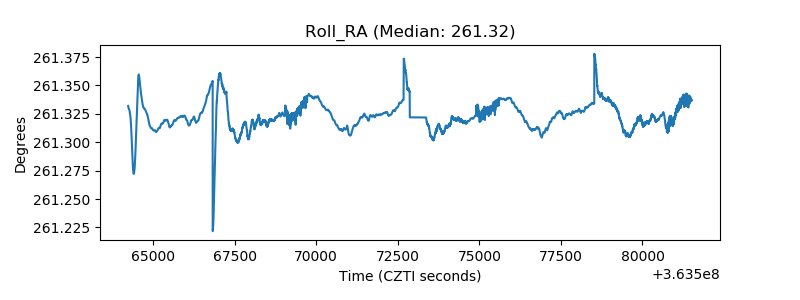 |
| Veto Counter | 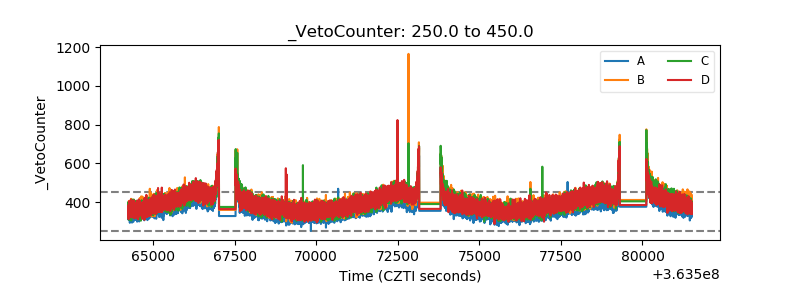 |