| Param | Original file | Final file |
|---|---|---|
| Filename | modeM0/AS1A10_113T01_9000004524_31261cztM0_level2.evt | modeM0/AS1A10_113T01_9000004524_31261cztM0_level2_quad_clean.evt |
| Size (bytes) | 578,888,640 | 91,578,240 |
| Size | 552.1 MB | 87.3 MB |
| Events in quadrant A | 3,451,901 | 586,253 |
| Events in quadrant B | 5,496,593 | 579,156 |
| Events in quadrant C | 3,859,915 | 554,569 |
| Events in quadrant D | 4,239,500 | 555,788 |
| Mode SS | |||
|---|---|---|---|
| Quadrant | BADHDUFLAG | Total packets | Discarded packets |
| A | 0 | 146 | 0 |
| B | 0 | 146 | 0 |
| C | 0 | 146 | 0 |
| D | 0 | 146 | 0 |
| Mode M0 | |||
|---|---|---|---|
| Quadrant | BADHDUFLAG | Total packets | Discarded packets |
| A | 0 | 14650 | 2 |
| B | 0 | 21717 | 2 |
| C | 0 | 15836 | 2 |
| D | 0 | 17320 | 2 |
| Mode M9 | |||
|---|---|---|---|
| Quadrant | BADHDUFLAG | Total packets | Discarded packets |
| A | 0 | 18 | 0 |
| B | 0 | 18 | 0 |
| C | 0 | 18 | 0 |
| D | 0 | 18 | 0 |
| Quadrant | Total seconds | Saturated seconds | Saturation percentage |
|---|---|---|---|
| A | 7146 | 46 | 0.643717% |
| B | 7145 | 156 | 2.183345% |
| C | 7146 | 211 | 2.952701% |
| D | 7146 | 88 | 1.231458% |
Noise dominated data is calculated using 1-second bins in cleaned event files. If a bin has >2000 counts, and if more than 50% of those come from <1% of pixels, then it is considered to be noise-dominated and hence unusable.
| Quadrant | # 1 sec bins | Bins with >0 counts | Bins with >2000 counts | High rate bins dominated by noise | Noise dominated (total time) | Noise dominated (detector-on time) | Marked lightcurve |
|---|---|---|---|---|---|---|---|
| A | 8931 | 7148 | 0 | 0 | 0.00% | 0.00% | 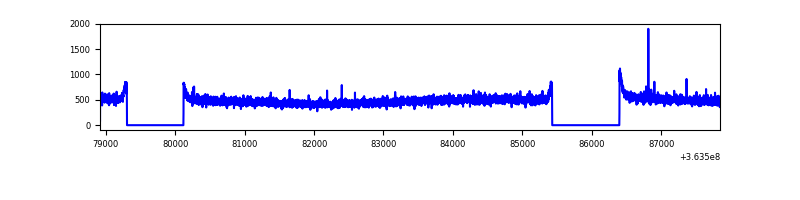 |
| B | 8930 | 7147 | 9 | 9 | 0.10% | 0.13% |  |
| C | 8931 | 7148 | 43 | 43 | 0.48% | 0.60% | 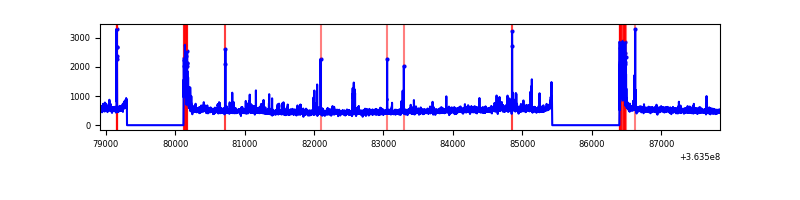 |
| D | 8931 | 7148 | 40 | 40 | 0.45% | 0.56% | 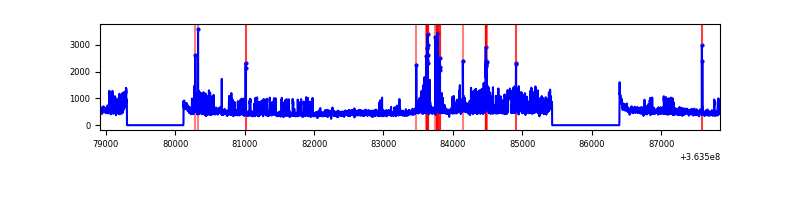 |
Top three noisy pixels from each quadrant. If the there are fewer than three noisy pixels in the level2.evt file, extra rows are filled as -1
| Pixel properties | Quadrant properties | ||||||
|---|---|---|---|---|---|---|---|
| Quadrant | DetID | PixID | Counts | Sigma | Mean | Median | Sigma |
| A | 13 | 254 | 13462 | 69.6 | 892 | 873 | 180.9 |
| A | 3 | 137 | 9179 | 45.92 | 892 | 873 | 180.9 |
| A | 0 | 226 | 7641 | 37.42 | 892 | 873 | 180.9 |
| B | 6 | 159 | 1920171 | 11365.02 | 878 | 855 | 168.9 |
| B | 4 | 80 | 61382 | 358.4 | 878 | 855 | 168.9 |
| B | 0 | 230 | 44023 | 255.61 | 878 | 855 | 168.9 |
| C | 0 | 10 | 334477 | 1679.82 | 847 | 853 | 198.6 |
| C | 14 | 238 | 138860 | 694.87 | 847 | 853 | 198.6 |
| C | 3 | 233 | 54797 | 271.61 | 847 | 853 | 198.6 |
| D | 8 | 195 | 691383 | 3136.14 | 856 | 838 | 220.2 |
| D | 12 | 233 | 172621 | 780.16 | 856 | 838 | 220.2 |
| D | 2 | 250 | 116074 | 523.35 | 856 | 838 | 220.2 |
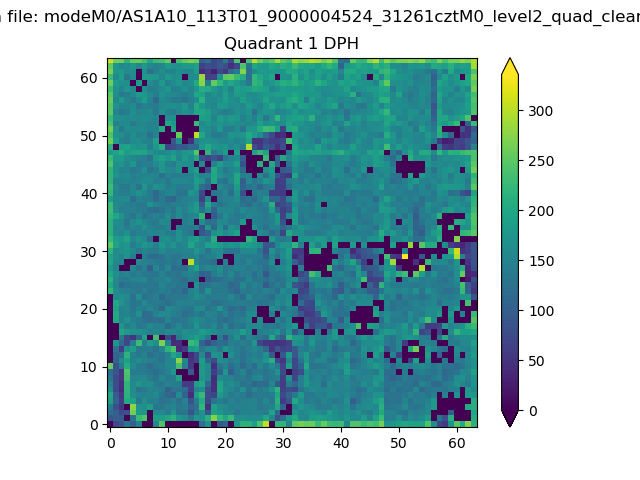
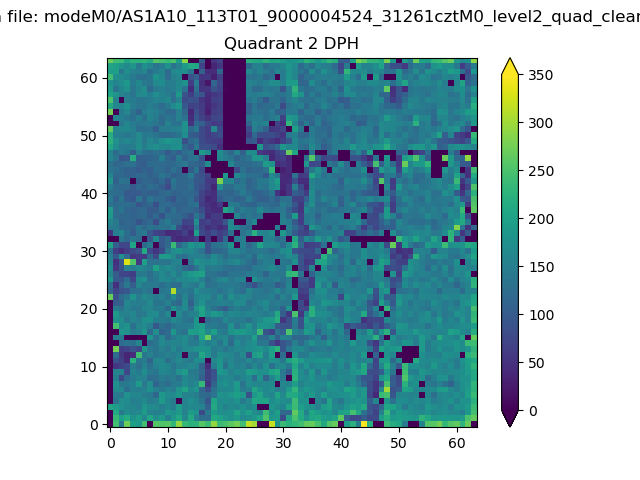
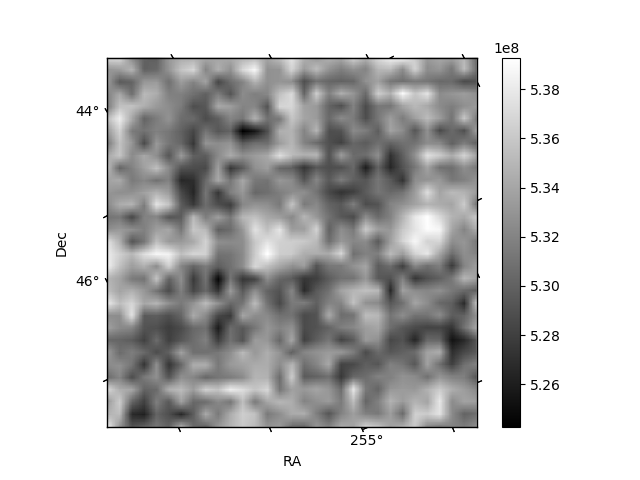
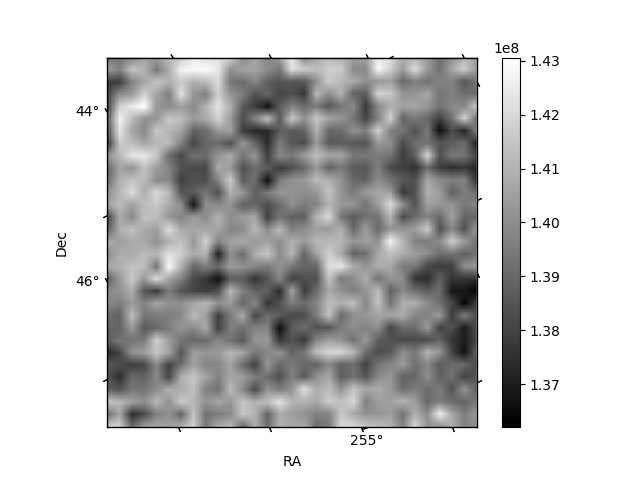
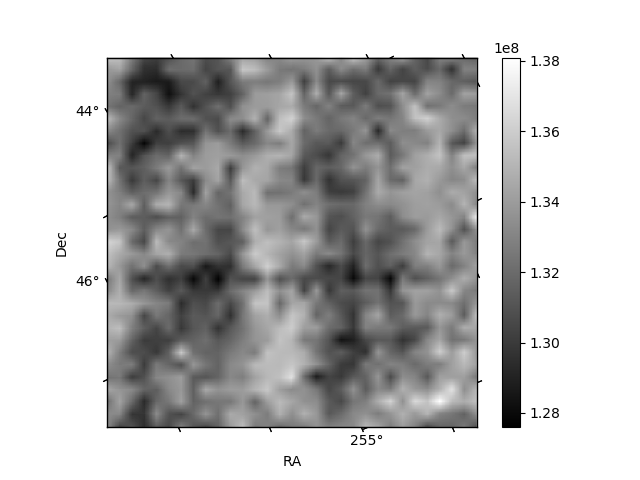
Histogram calculated using DETX and DETY for each event in the final _common_clean file
| Quadrant A | 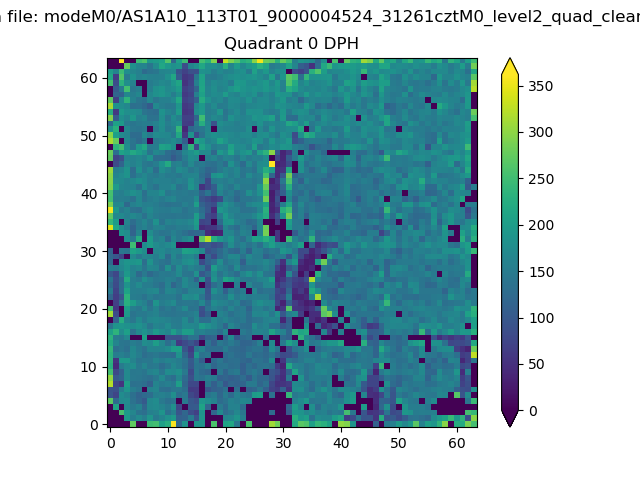 |
 |
Quadrant B |
|---|---|---|---|
| Quadrant D | 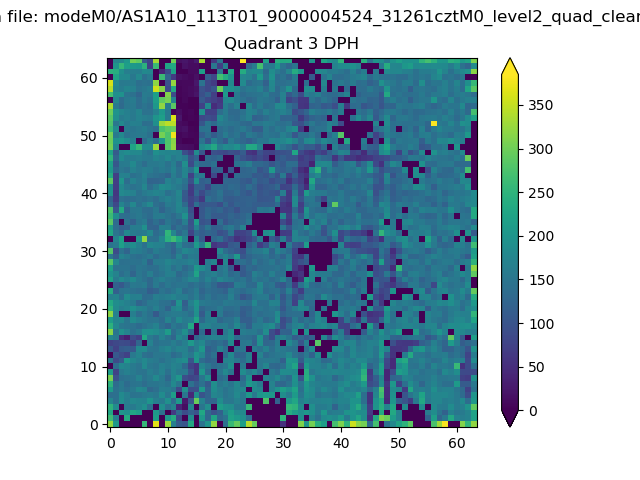 |
 |
Quadrant C |
| Plot type | Count rate plots | Images |
|---|---|---|
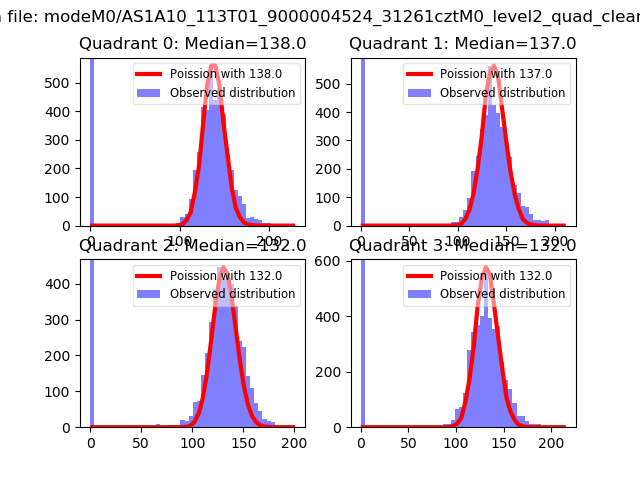
| Comparison with Poisson distribution Blue bars denote a histogram of data divided into 1 sec bins. Red curve is a Poisson curve with rate = median count rate of data. |
 |
 |
| Quadrant-wise count rates Data is divided into 100 sec bins |
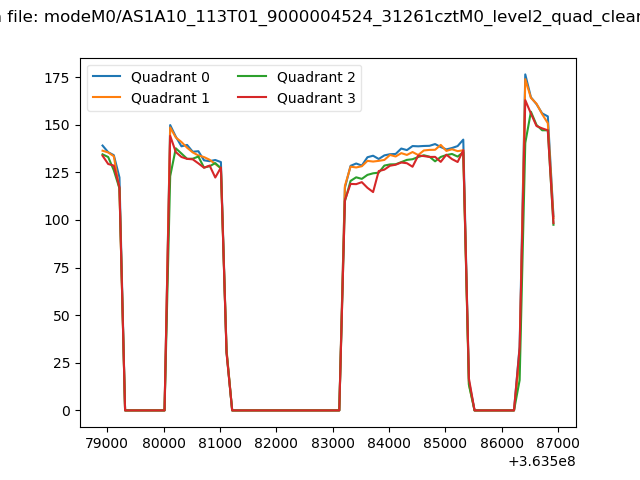 |
|
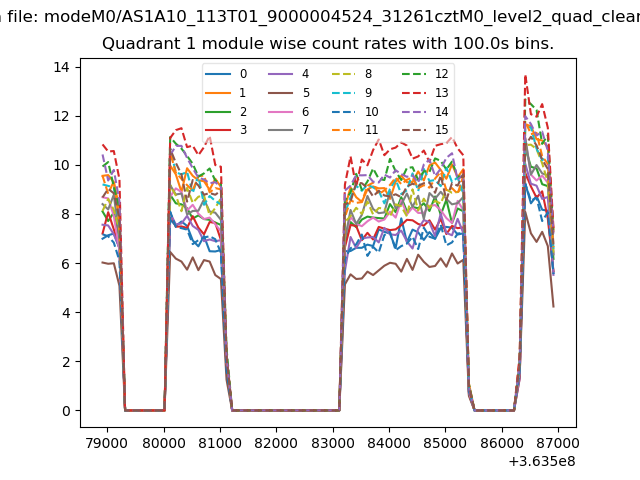
| Module-wise count rates for Quadrant A Data is divided into 100 sec bins |
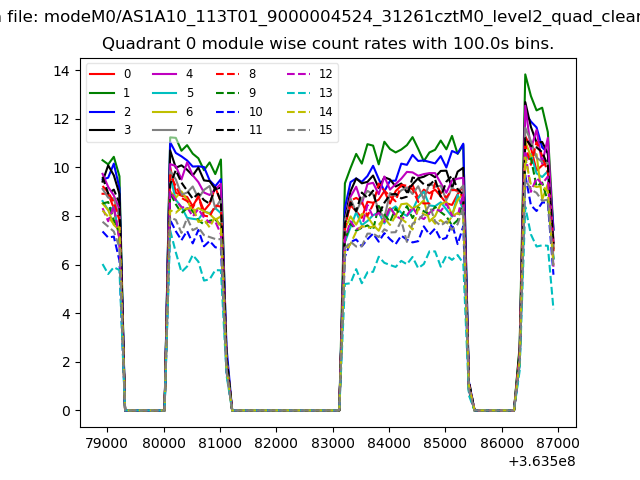 |
 |
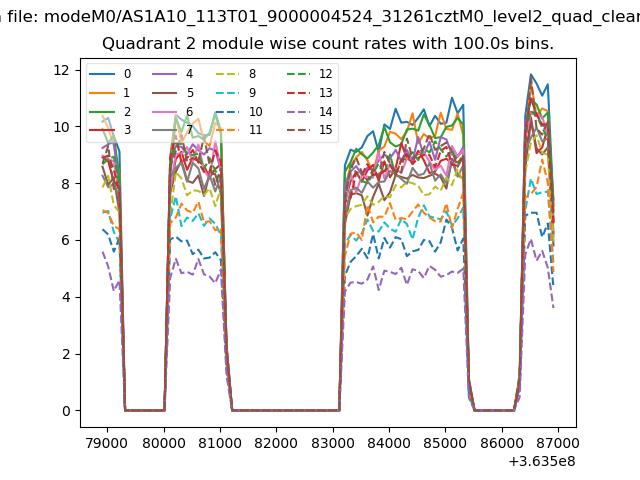
| Module-wise count rates for Quadrant B Data is divided into 100 sec bins |
 |
 |
| Module-wise count rates for Quadrant C Data is divided into 100 sec bins |
 |
 |
| Module-wise count rates for Quadrant D Data is divided into 100 sec bins |
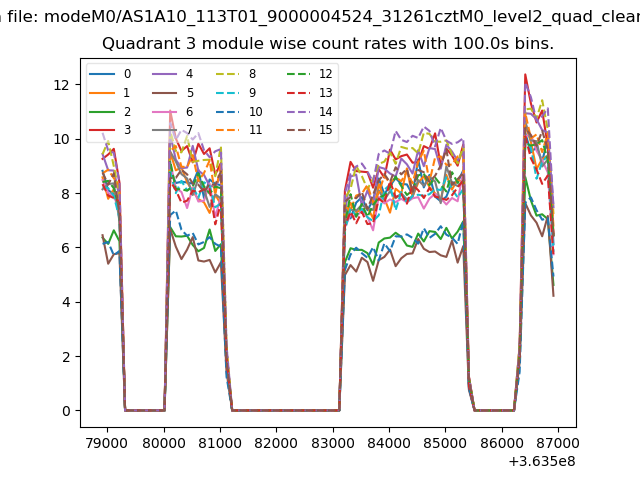 |
 |
| Parameter | Plot |
|---|---|
| CZT HV Monitor | 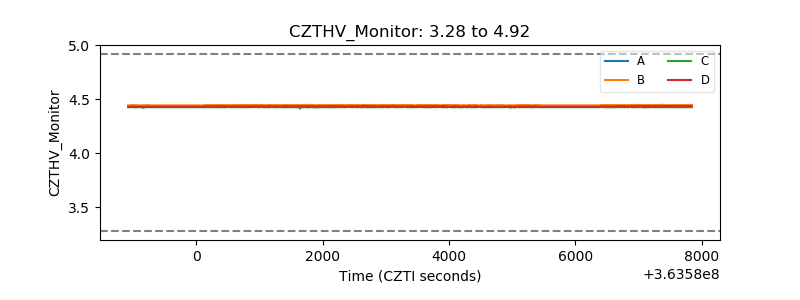 |
| D_VDD | 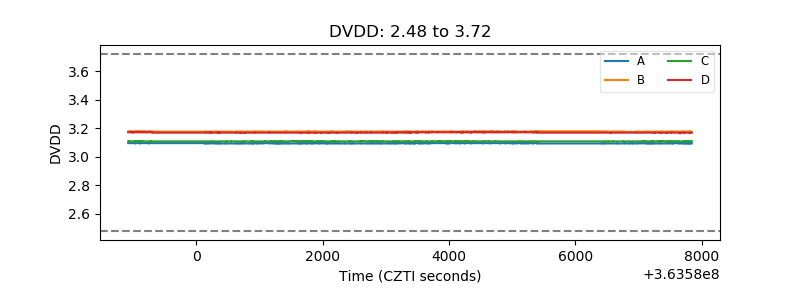 |
| Temperature 1 | 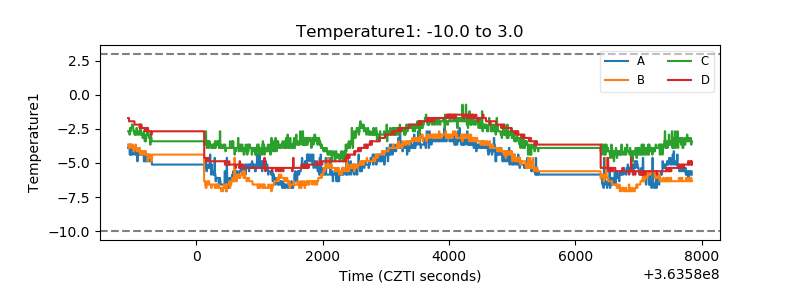 |
| Veto HV Monitor | 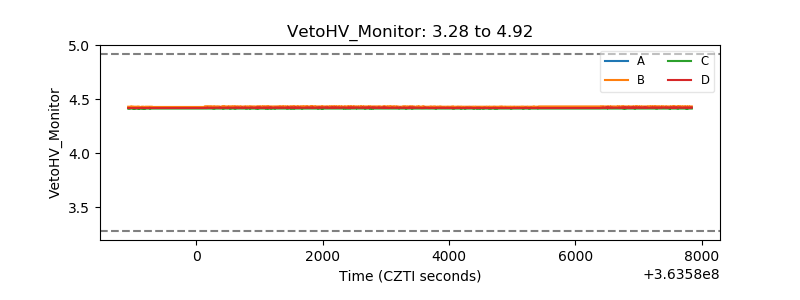 |
| Veto LLD | 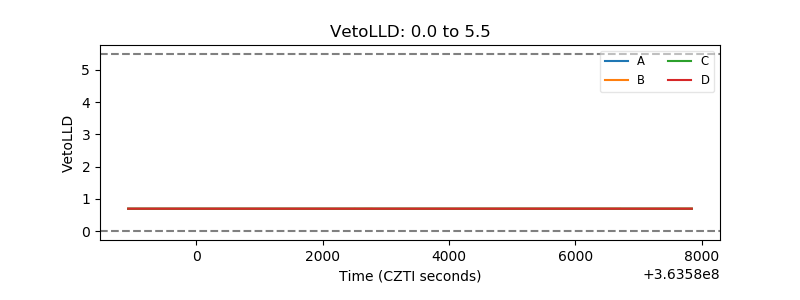 |
| Alpha Counter | 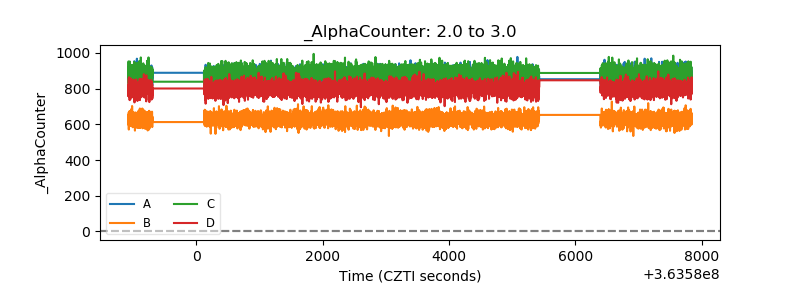 |
| _CPM_Rate | 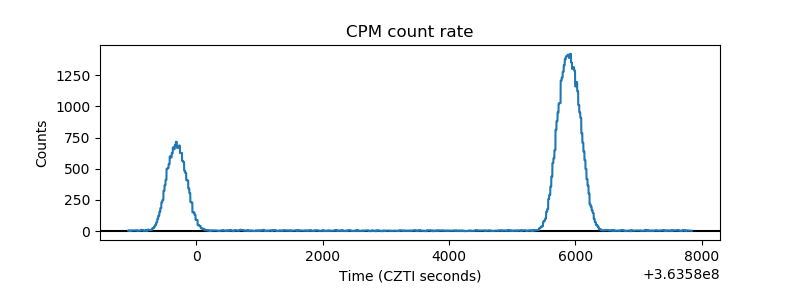 |
| CZT Counter | 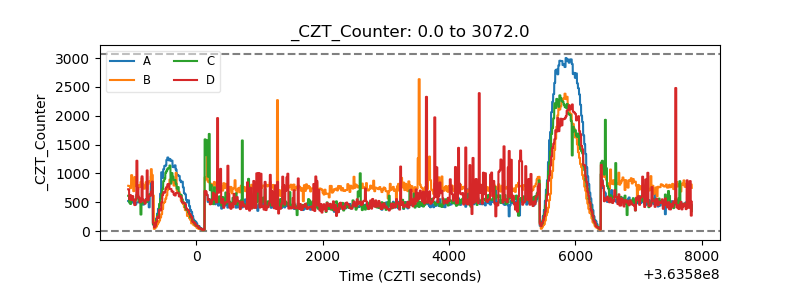 |
| +2.5 Volts monitor |  |
| +5 Volts monitor |  |
| _ROLL_ROT | 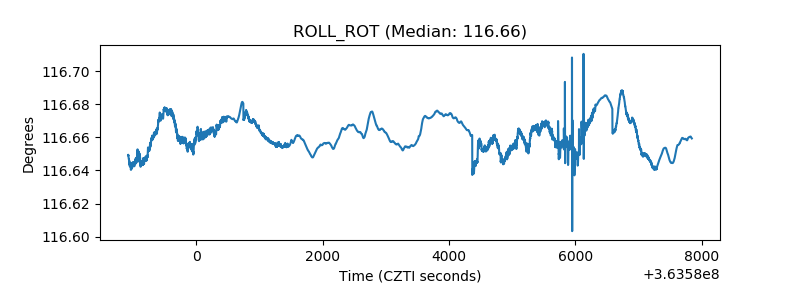 |
| _Roll_DEC | 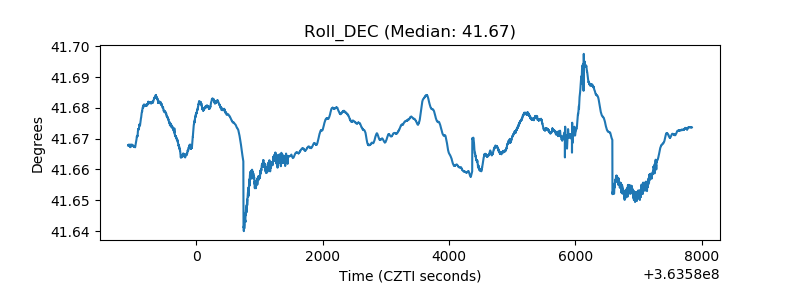 |
| _Roll_RA | 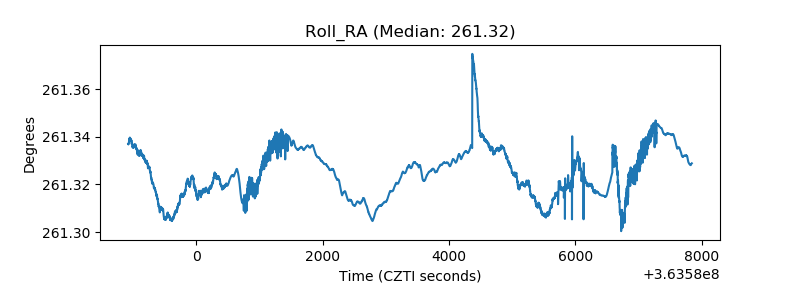 |
| Veto Counter | 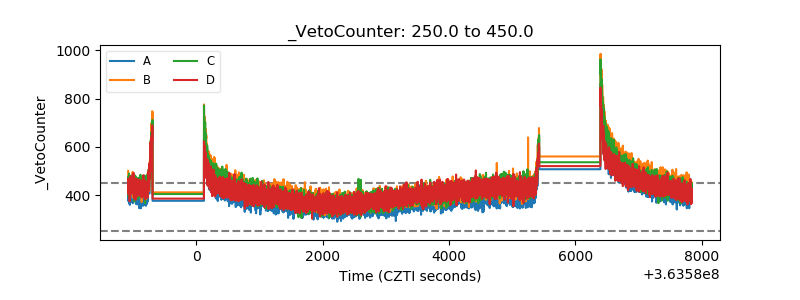 |