| Param | Original file | Final file |
|---|---|---|
| Filename | modeM0/AS1A10_058T08_9000004528cztM0_level2.fits | modeM0/AS1A10_058T08_9000004528cztM0_level2_quad_clean.evt |
| Size (bytes) | 227,177,280 | 222,350,400 |
| Size | 216.7 MB | 212.0 MB |
| Events in quadrant A | 1,404,812 | 1,341,133 |
| Events in quadrant B | 1,305,940 | 1,313,338 |
| Events in quadrant C | 1,331,212 | 1,254,689 |
| Events in quadrant D | 1,187,572 | 1,173,654 |
| Mode M9 | |||
|---|---|---|---|
| Quadrant | BADHDUFLAG | Total packets | Discarded packets |
| A | 0 | 20 | 0 |
| B | 0 | 20 | 0 |
| C | 0 | 20 | 0 |
| D | 0 | 20 | 0 |
| Mode M0 | |||
|---|---|---|---|
| Quadrant | BADHDUFLAG | Total packets | Discarded packets |
| A | 0 | 49269 | 0 |
| B | 0 | 73119 | 0 |
| C | 0 | 52741 | 0 |
| D | 0 | 59934 | 0 |
| Mode SS | |||
|---|---|---|---|
| Quadrant | BADHDUFLAG | Total packets | Discarded packets |
| A | 0 | 488 | 0 |
| B | 0 | 488 | 0 |
| C | 0 | 488 | 0 |
| D | 0 | 488 | 0 |
| Quadrant | Total seconds | Saturated seconds | Saturation percentage |
|---|---|---|---|
| A | 23989 | 127 | 0.529409% |
| B | 23989 | 459 | 1.913377% |
| C | 23989 | 591 | 2.463629% |
| D | 23989 | 400 | 1.667431% |
Noise dominated data is calculated using 1-second bins in cleaned event files. If a bin has >2000 counts, and if more than 50% of those come from <1% of pixels, then it is considered to be noise-dominated and hence unusable.
| Quadrant | # 1 sec bins | Bins with >0 counts | Bins with >2000 counts | High rate bins dominated by noise | Noise dominated (total time) | Noise dominated (detector-on time) | Marked lightcurve |
|---|---|---|---|---|---|---|---|
| A | 26014 | 23990 | 0 | 0 | 0.00% | 0.00% |  |
| B | 26014 | 23989 | 0 | 0 | 0.00% | 0.00% |  |
| C | 26014 | 23984 | 0 | 0 | 0.00% | 0.00% |  |
| D | 26014 | 23989 | 0 | 0 | 0.00% | 0.00% |  |
Top three noisy pixels from each quadrant. If the there are fewer than three noisy pixels in the level2.evt file, extra rows are filled as -1
| Pixel properties | Quadrant properties | ||||||
|---|---|---|---|---|---|---|---|
| Quadrant | DetID | PixID | Counts | Sigma | Mean | Median | Sigma |
| A | 0 | 29 | 1354 | 10.83 | 366 | 343 | 93.4 |
| A | 7 | 110 | 1109 | 8.21 | 366 | 343 | 93.4 |
| A | 0 | 30 | 1060 | 7.68 | 366 | 343 | 93.4 |
| B | 2 | 9 | 1092 | 10.83 | 345 | 328 | 70.5 |
| B | 2 | 8 | 926 | 8.48 | 345 | 328 | 70.5 |
| B | 5 | 128 | 912 | 8.28 | 345 | 328 | 70.5 |
| C | 12 | 241 | 969 | 7.12 | 352 | 330 | 89.8 |
| C | 2 | 191 | 912 | 6.48 | 352 | 330 | 89.8 |
| C | 3 | 126 | 895 | 6.29 | 352 | 330 | 89.8 |
| D | 6 | 231 | 852 | 5.93 | 339 | 309 | 91.6 |
| D | 7 | 3 | 844 | 5.84 | 339 | 309 | 91.6 |
| D | 6 | 67 | 812 | 5.49 | 339 | 309 | 91.6 |
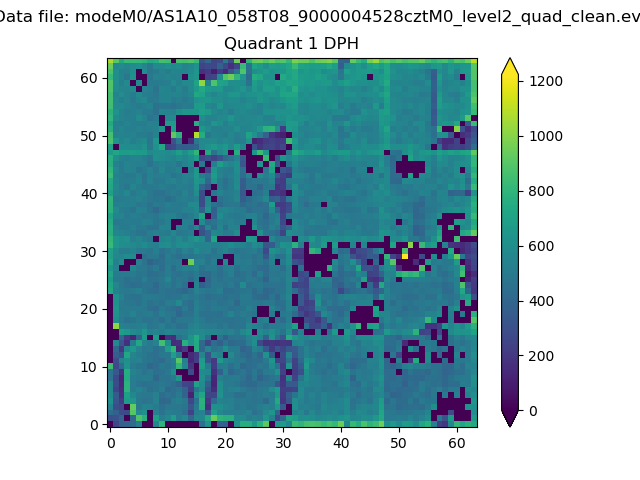
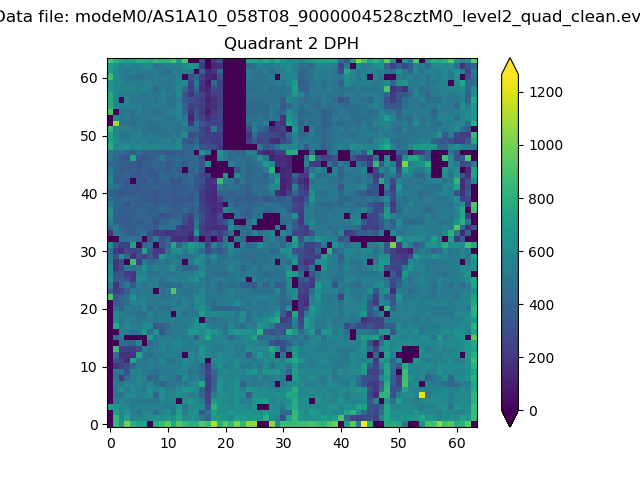
Histogram calculated using DETX and DETY for each event in the final _common_clean file
| Quadrant A |  |
 |
Quadrant B |
|---|---|---|---|
| Quadrant D | 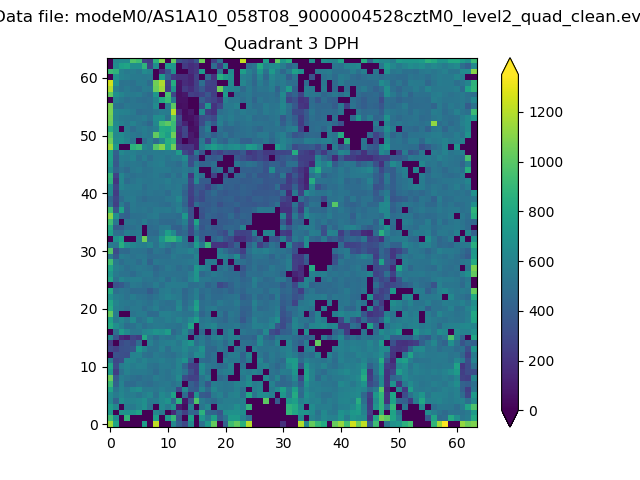 |
 |
Quadrant C |
| Plot type | Count rate plots | Images |
|---|---|---|
| Comparison with Poisson distribution Blue bars denote a histogram of data divided into 1 sec bins. Red curve is a Poisson curve with rate = median count rate of data. |
 |
 |
| Quadrant-wise count rates Data is divided into 100 sec bins |
 |
|
| Module-wise count rates for Quadrant A Data is divided into 100 sec bins |
 |
 |
| Module-wise count rates for Quadrant B Data is divided into 100 sec bins |
 |
 |
| Module-wise count rates for Quadrant C Data is divided into 100 sec bins |
 |
 |
| Module-wise count rates for Quadrant D Data is divided into 100 sec bins |
 |
 |
| Parameter | Plot |
|---|---|
| CZT HV Monitor |  |
| D_VDD | 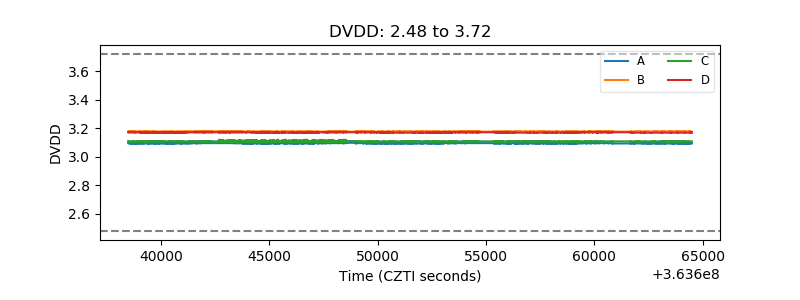 |
| Temperature 1 |  |
| Veto HV Monitor |  |
| Veto LLD |  |
| Alpha Counter |  |
| _CPM_Rate |  |
| CZT Counter |  |
| +2.5 Volts monitor |  |
| +5 Volts monitor |  |
| _ROLL_ROT |  |
| _Roll_DEC |  |
| _Roll_RA |  |
| Veto Counter |  |