| Param | Original file | Final file |
|---|---|---|
| Filename | modeM0/AS1A10_058T08_9000004528_31271cztM0_level2.evt | modeM0/AS1A10_058T08_9000004528_31271cztM0_level2_quad_clean.evt |
| Size (bytes) | 449,703,360 | 69,094,080 |
| Size | 428.9 MB | 65.9 MB |
| Events in quadrant A | 2,591,863 | 441,588 |
| Events in quadrant B | 4,317,590 | 434,564 |
| Events in quadrant C | 2,814,571 | 421,852 |
| Events in quadrant D | 3,529,236 | 416,581 |
| Mode M9 | |||
|---|---|---|---|
| Quadrant | BADHDUFLAG | Total packets | Discarded packets |
| A | 0 | 2 | 0 |
| B | 0 | 2 | 0 |
| C | 0 | 2 | 0 |
| D | 0 | 2 | 0 |
| Mode M0 | |||
|---|---|---|---|
| Quadrant | BADHDUFLAG | Total packets | Discarded packets |
| A | 0 | 11149 | 1 |
| B | 0 | 16650 | 3 |
| C | 0 | 11694 | 1 |
| D | 0 | 14102 | 1 |
| Mode SS | |||
|---|---|---|---|
| Quadrant | BADHDUFLAG | Total packets | Discarded packets |
| A | 0 | 110 | 0 |
| B | 0 | 110 | 0 |
| C | 0 | 110 | 0 |
| D | 0 | 110 | 0 |
| Quadrant | Total seconds | Saturated seconds | Saturation percentage |
|---|---|---|---|
| A | 5392 | 40 | 0.741840% |
| B | 5391 | 151 | 2.800965% |
| C | 5391 | 115 | 2.133185% |
| D | 5391 | 121 | 2.244482% |
Noise dominated data is calculated using 1-second bins in cleaned event files. If a bin has >2000 counts, and if more than 50% of those come from <1% of pixels, then it is considered to be noise-dominated and hence unusable.
| Quadrant | # 1 sec bins | Bins with >0 counts | Bins with >2000 counts | High rate bins dominated by noise | Noise dominated (total time) | Noise dominated (detector-on time) | Marked lightcurve |
|---|---|---|---|---|---|---|---|
| A | 5662 | 5393 | 0 | 0 | 0.00% | 0.00% | 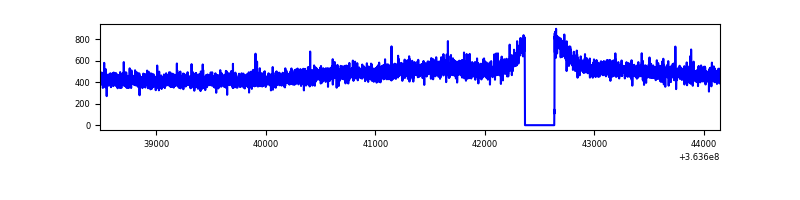 |
| B | 5661 | 5392 | 7 | 7 | 0.12% | 0.13% | 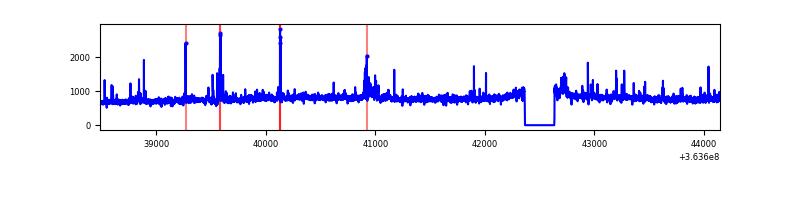 |
| C | 5661 | 5392 | 2 | 2 | 0.04% | 0.04% | 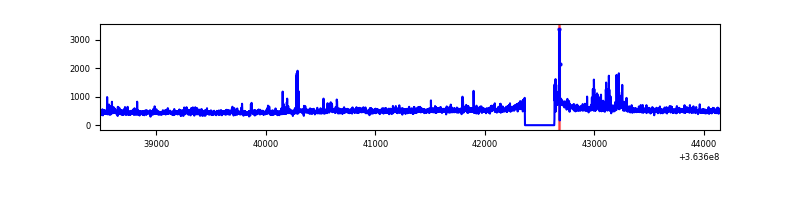 |
| D | 5661 | 5392 | 69 | 69 | 1.22% | 1.28% | 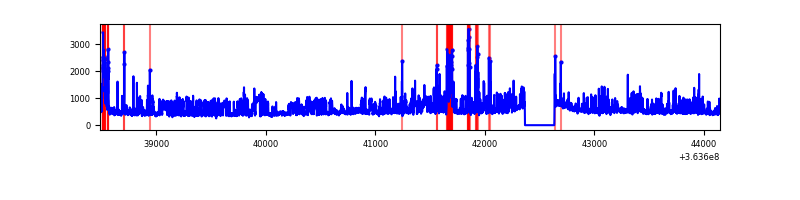 |
Top three noisy pixels from each quadrant. If the there are fewer than three noisy pixels in the level2.evt file, extra rows are filled as -1
| Pixel properties | Quadrant properties | ||||||
|---|---|---|---|---|---|---|---|
| Quadrant | DetID | PixID | Counts | Sigma | Mean | Median | Sigma |
| A | 13 | 254 | 10274 | 70.42 | 671 | 656 | 136.6 |
| A | 3 | 137 | 6844 | 45.31 | 671 | 656 | 136.6 |
| A | 0 | 226 | 5592 | 36.14 | 671 | 656 | 136.6 |
| B | 6 | 159 | 1515292 | 11798.4 | 657 | 641 | 128.4 |
| B | 10 | 247 | 88039 | 680.79 | 657 | 641 | 128.4 |
| B | 0 | 190 | 50545 | 388.73 | 657 | 641 | 128.4 |
| C | 3 | 233 | 147785 | 974.51 | 635 | 639 | 151.0 |
| C | 14 | 238 | 103194 | 679.19 | 635 | 639 | 151.0 |
| C | 0 | 10 | 67457 | 442.52 | 635 | 639 | 151.0 |
| D | 8 | 195 | 697595 | 4495.88 | 644 | 625 | 155.0 |
| D | 12 | 233 | 131599 | 844.86 | 644 | 625 | 155.0 |
| D | 2 | 250 | 125689 | 806.74 | 644 | 625 | 155.0 |
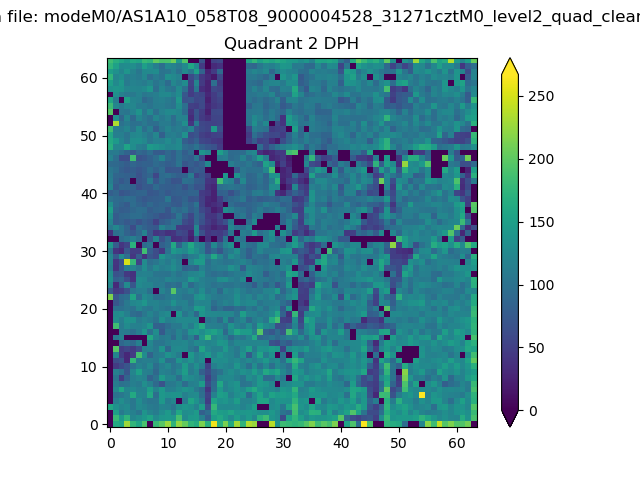
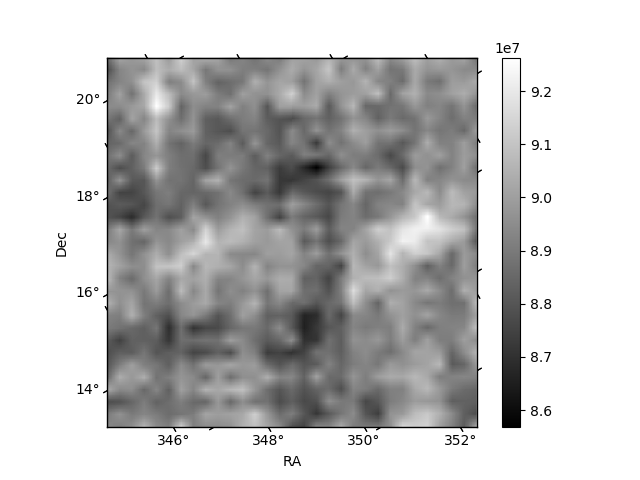
Histogram calculated using DETX and DETY for each event in the final _common_clean file
| Quadrant A | 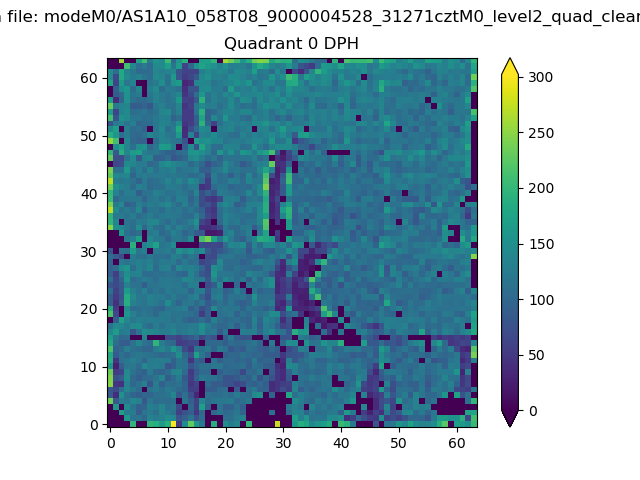 |
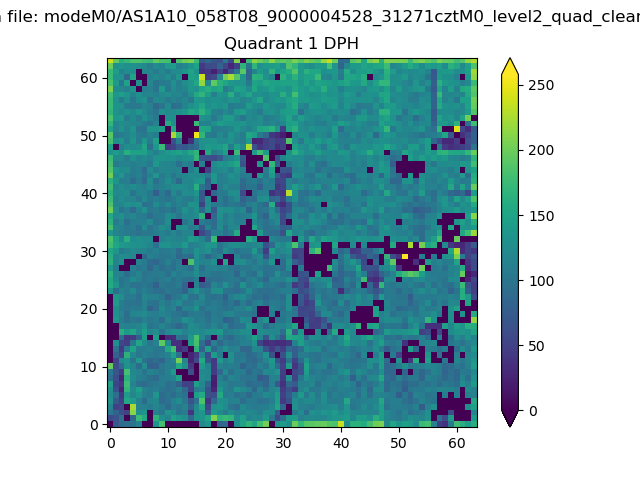 |
Quadrant B |
|---|---|---|---|
| Quadrant D | 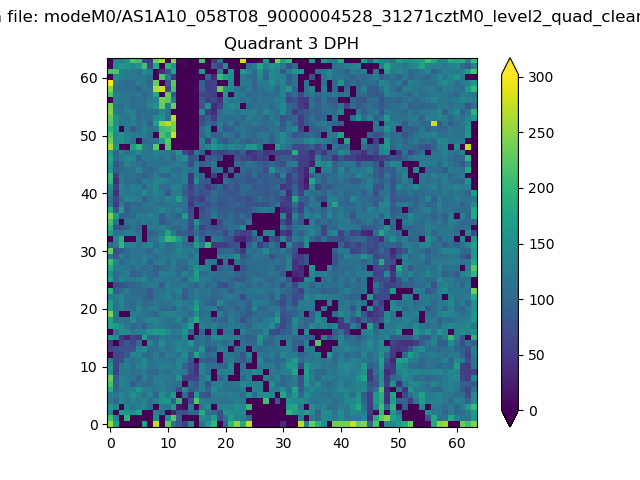 |
 |
Quadrant C |
| Plot type | Count rate plots | Images |
|---|---|---|
| Comparison with Poisson distribution Blue bars denote a histogram of data divided into 1 sec bins. Red curve is a Poisson curve with rate = median count rate of data. |
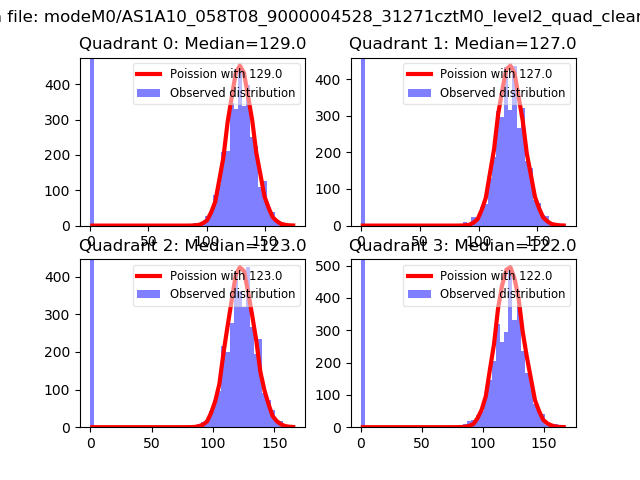 |
 |
| Quadrant-wise count rates Data is divided into 100 sec bins |
 |
|
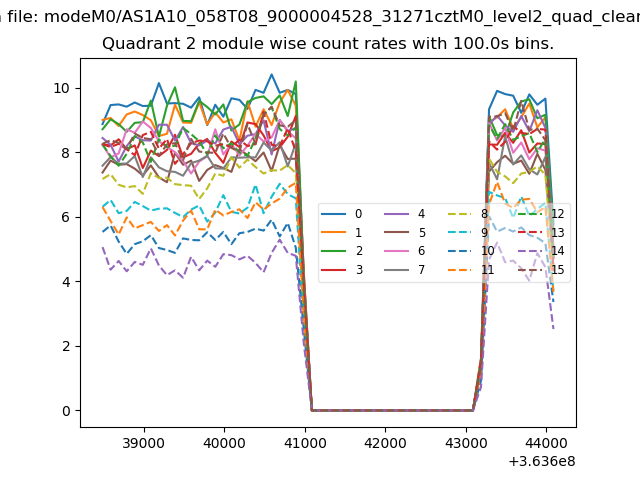
| Module-wise count rates for Quadrant A Data is divided into 100 sec bins |
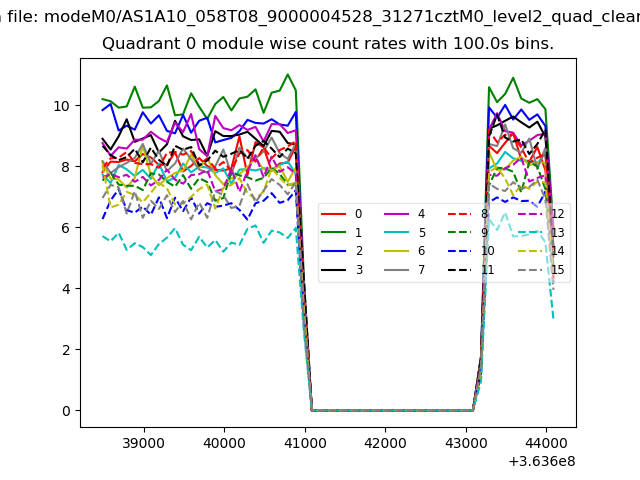 |
 |
| Module-wise count rates for Quadrant B Data is divided into 100 sec bins |
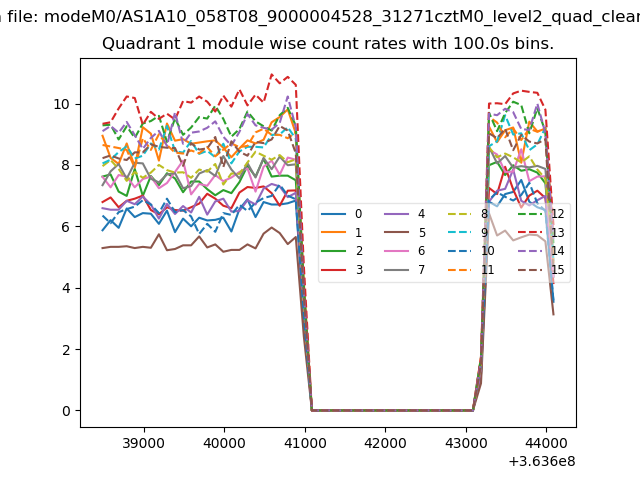 |
 |
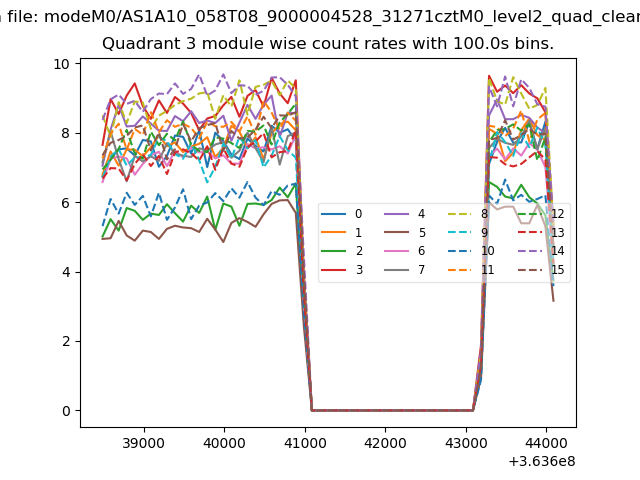
| Module-wise count rates for Quadrant C Data is divided into 100 sec bins |
 |
 |
| Module-wise count rates for Quadrant D Data is divided into 100 sec bins |
 |
 |
| Parameter | Plot |
|---|---|
| CZT HV Monitor | 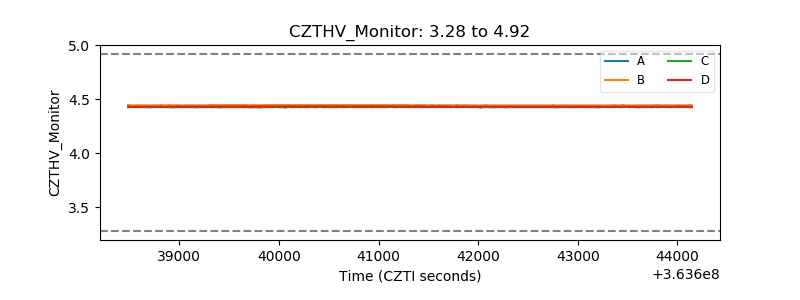 |
| D_VDD | 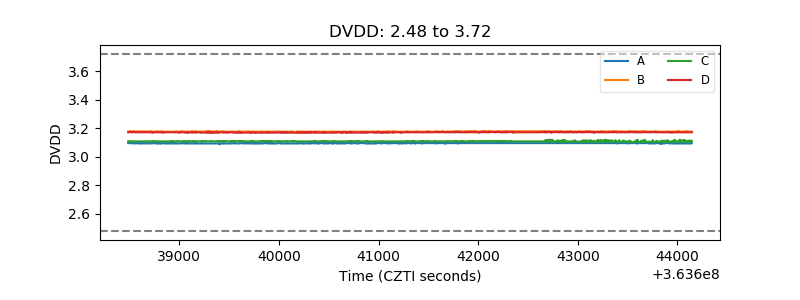 |
| Temperature 1 | 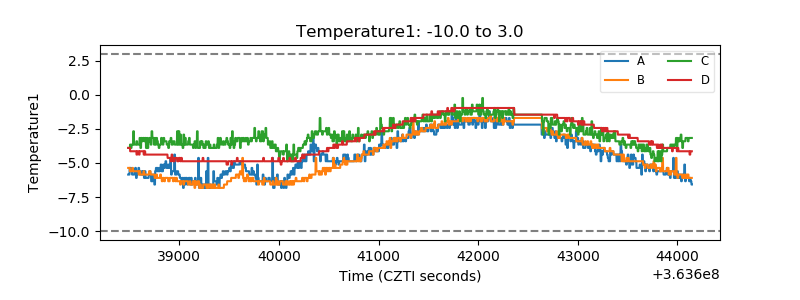 |
| Veto HV Monitor | 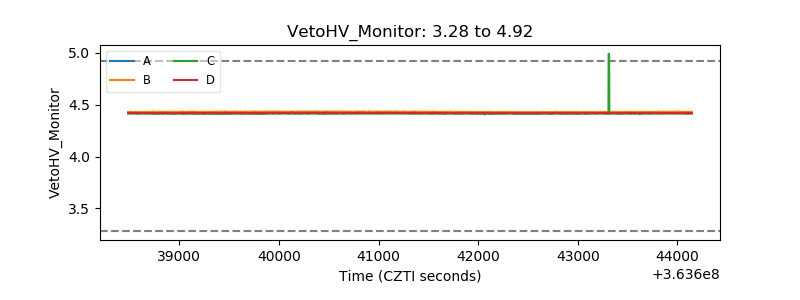 |
| Veto LLD | 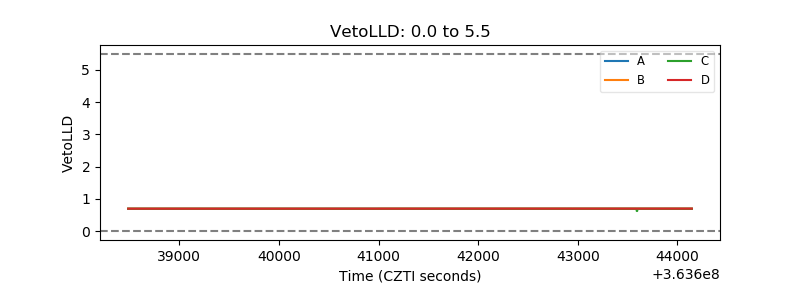 |
| Alpha Counter | 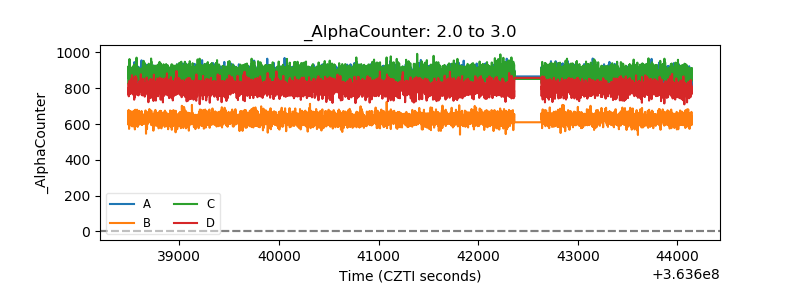 |
| _CPM_Rate | 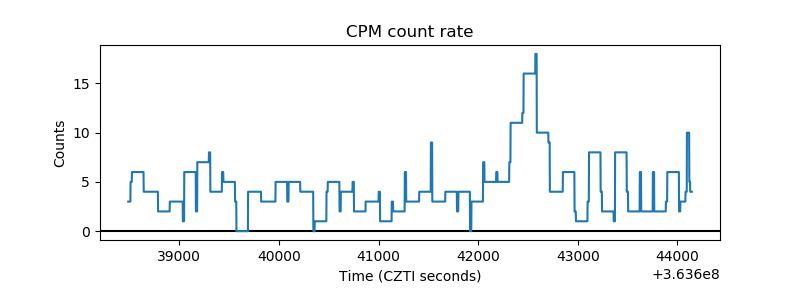 |
| CZT Counter | 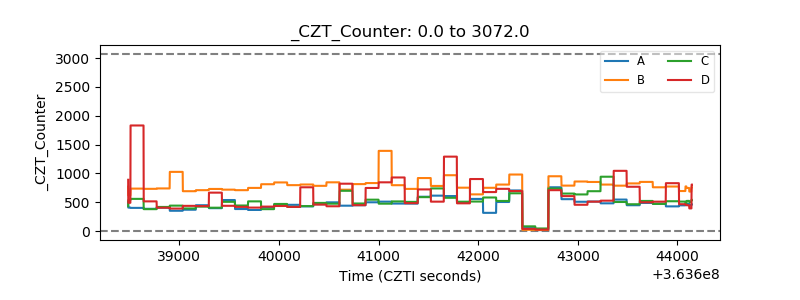 |
| +2.5 Volts monitor |  |
| +5 Volts monitor |  |
| _ROLL_ROT | 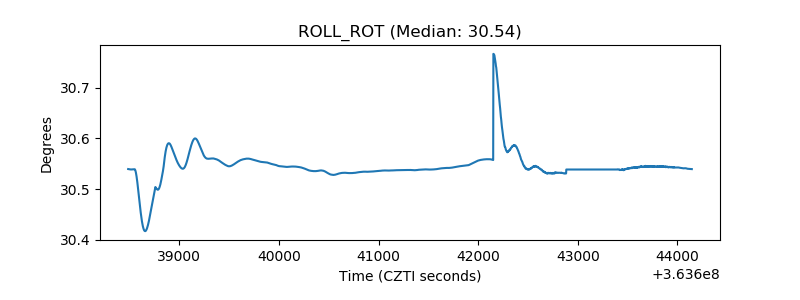 |
| _Roll_DEC | 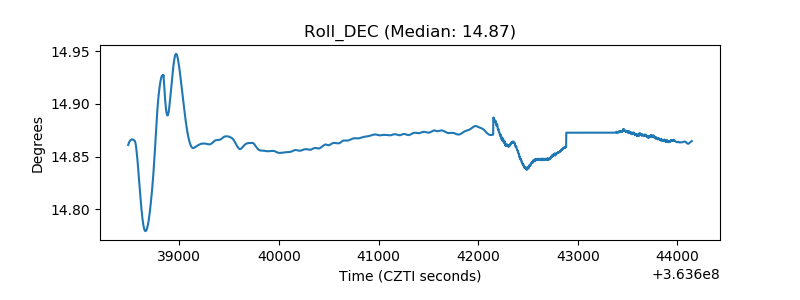 |
| _Roll_RA | 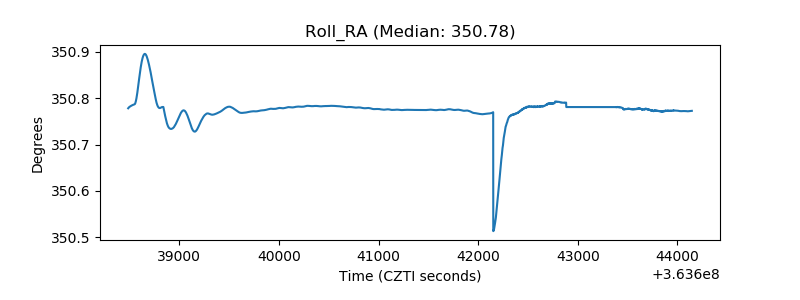 |
| Veto Counter | 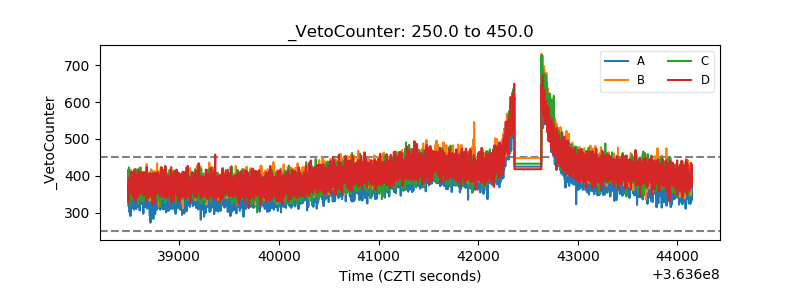 |