| Param | Original file | Final file |
|---|---|---|
| Filename | modeM0/AS1A10_058T08_9000004528_31272cztM0_level2.evt | modeM0/AS1A10_058T08_9000004528_31272cztM0_level2_quad_clean.evt |
| Size (bytes) | 618,626,880 | 101,427,840 |
| Size | 590.0 MB | 96.7 MB |
| Events in quadrant A | 3,531,064 | 659,189 |
| Events in quadrant B | 5,810,651 | 649,965 |
| Events in quadrant C | 4,193,951 | 623,003 |
| Events in quadrant D | 4,698,059 | 623,976 |
| Mode M9 | |||
|---|---|---|---|
| Quadrant | BADHDUFLAG | Total packets | Discarded packets |
| A | 0 | 4 | 0 |
| B | 0 | 4 | 0 |
| C | 0 | 4 | 0 |
| D | 0 | 4 | 0 |
| Mode M0 | |||
|---|---|---|---|
| Quadrant | BADHDUFLAG | Total packets | Discarded packets |
| A | 0 | 15228 | 1 |
| B | 0 | 22575 | 1 |
| C | 0 | 17004 | 1 |
| D | 0 | 18901 | 3 |
| Mode SS | |||
|---|---|---|---|
| Quadrant | BADHDUFLAG | Total packets | Discarded packets |
| A | 0 | 150 | 0 |
| B | 0 | 150 | 0 |
| C | 0 | 150 | 0 |
| D | 0 | 150 | 0 |
| Quadrant | Total seconds | Saturated seconds | Saturation percentage |
|---|---|---|---|
| A | 7409 | 37 | 0.499393% |
| B | 7410 | 130 | 1.754386% |
| C | 7410 | 287 | 3.873144% |
| D | 7409 | 175 | 2.361992% |
Noise dominated data is calculated using 1-second bins in cleaned event files. If a bin has >2000 counts, and if more than 50% of those come from <1% of pixels, then it is considered to be noise-dominated and hence unusable.
| Quadrant | # 1 sec bins | Bins with >0 counts | Bins with >2000 counts | High rate bins dominated by noise | Noise dominated (total time) | Noise dominated (detector-on time) | Marked lightcurve |
|---|---|---|---|---|---|---|---|
| A | 7799 | 7411 | 0 | 0 | 0.00% | 0.00% |  |
| B | 7800 | 7412 | 4 | 4 | 0.05% | 0.05% |  |
| C | 7800 | 7412 | 89 | 89 | 1.14% | 1.20% |  |
| D | 7799 | 7411 | 65 | 65 | 0.83% | 0.88% | 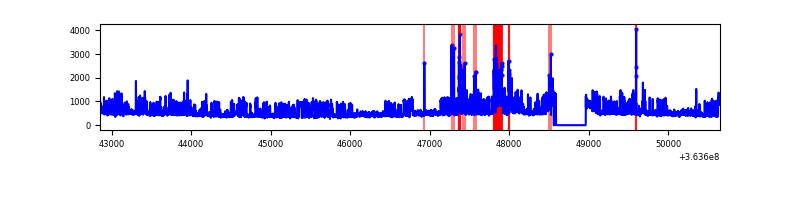 |
Top three noisy pixels from each quadrant. If the there are fewer than three noisy pixels in the level2.evt file, extra rows are filled as -1
| Pixel properties | Quadrant properties | ||||||
|---|---|---|---|---|---|---|---|
| Quadrant | DetID | PixID | Counts | Sigma | Mean | Median | Sigma |
| A | 5 | 16 | 13866 | 70.19 | 911 | 891 | 184.9 |
| A | 13 | 254 | 13400 | 67.67 | 911 | 891 | 184.9 |
| A | 3 | 137 | 9504 | 46.59 | 911 | 891 | 184.9 |
| B | 6 | 159 | 2135474 | 12235.44 | 900 | 878 | 174.5 |
| B | 4 | 80 | 58248 | 328.84 | 900 | 878 | 174.5 |
| B | 12 | 111 | 21920 | 120.61 | 900 | 878 | 174.5 |
| C | 0 | 10 | 442481 | 2189.59 | 858 | 862 | 201.7 |
| C | 3 | 233 | 210938 | 1041.58 | 858 | 862 | 201.7 |
| C | 14 | 238 | 147474 | 726.92 | 858 | 862 | 201.7 |
| D | 8 | 195 | 938656 | 4202.35 | 876 | 853 | 223.2 |
| D | 12 | 233 | 308331 | 1377.83 | 876 | 853 | 223.2 |
| D | 2 | 250 | 56737 | 250.42 | 876 | 853 | 223.2 |
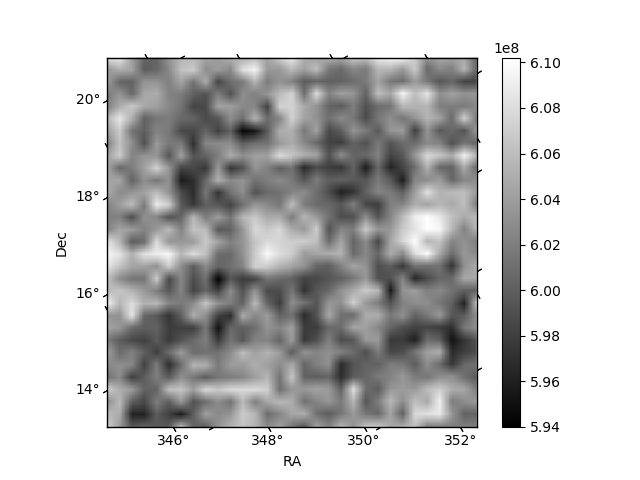
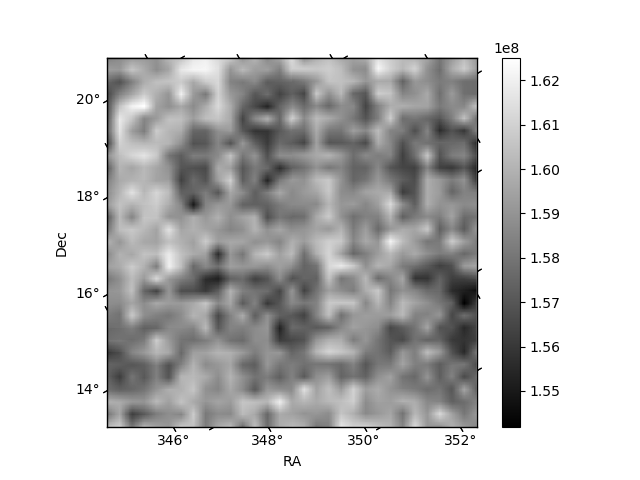
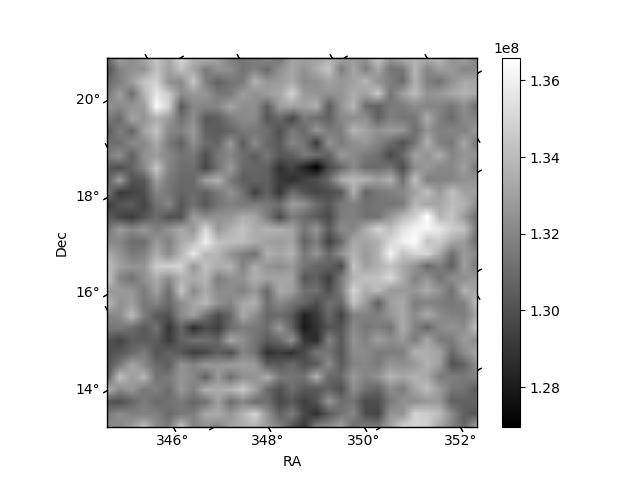
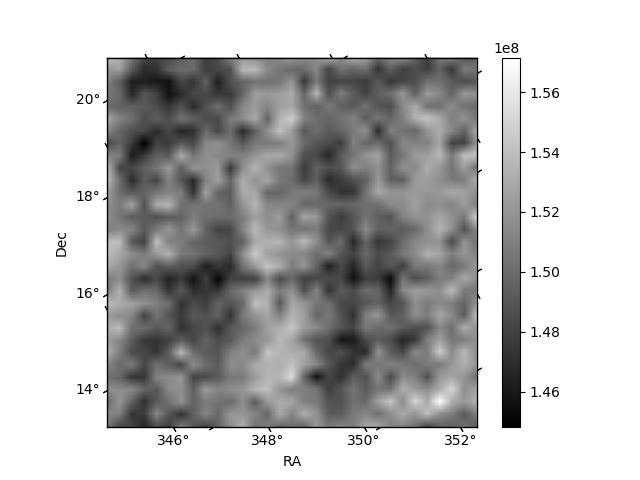
Histogram calculated using DETX and DETY for each event in the final _common_clean file
| Quadrant A | 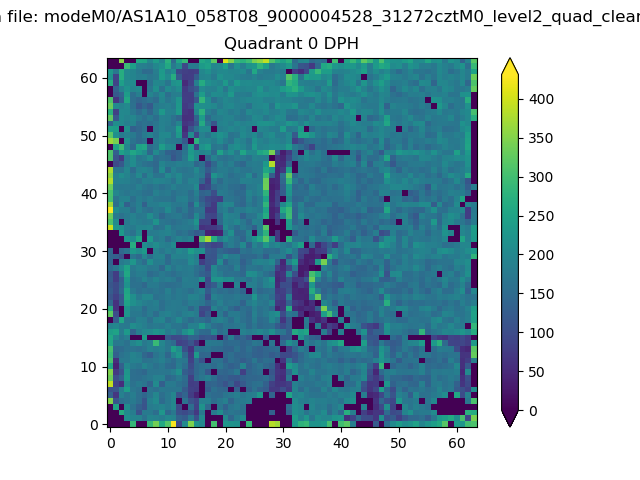 |
 |
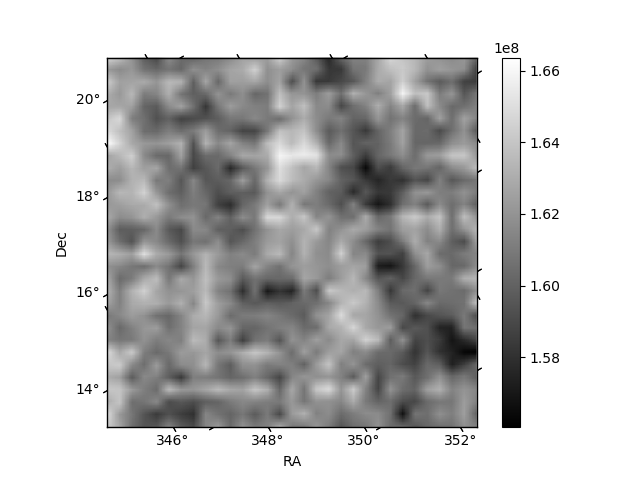
Quadrant B |
|---|---|---|---|
| Quadrant D | 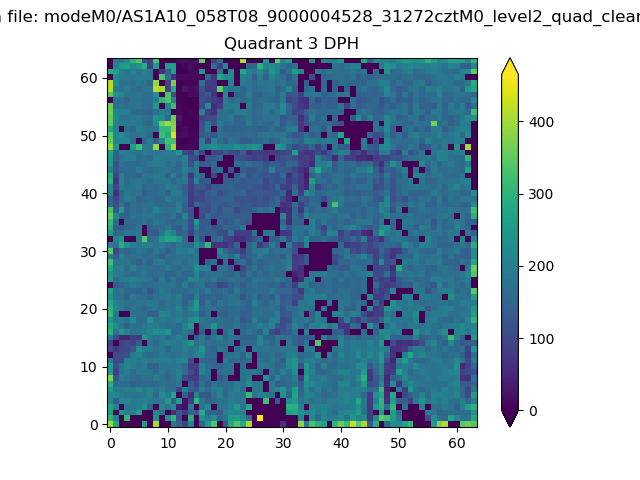 |
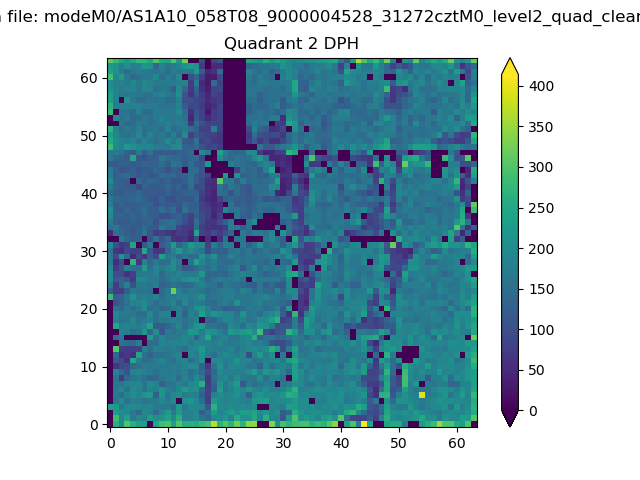 |
Quadrant C |
| Plot type | Count rate plots | Images |
|---|---|---|
| Comparison with Poisson distribution Blue bars denote a histogram of data divided into 1 sec bins. Red curve is a Poisson curve with rate = median count rate of data. |
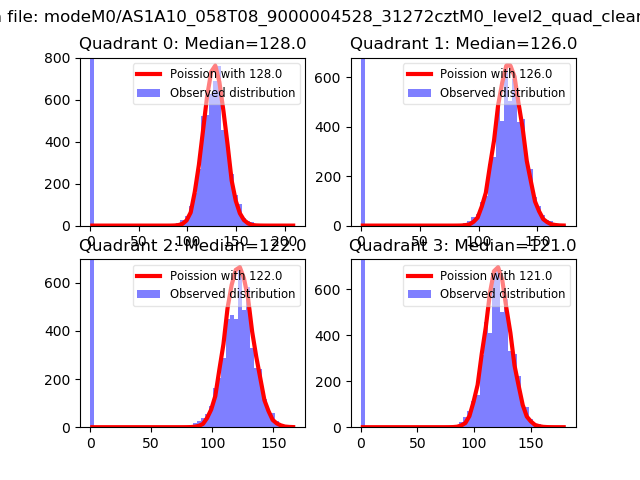 |
 |
| Quadrant-wise count rates Data is divided into 100 sec bins |
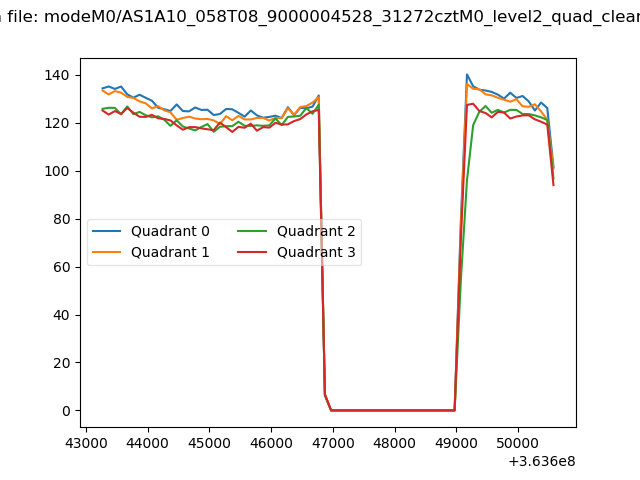 |
|
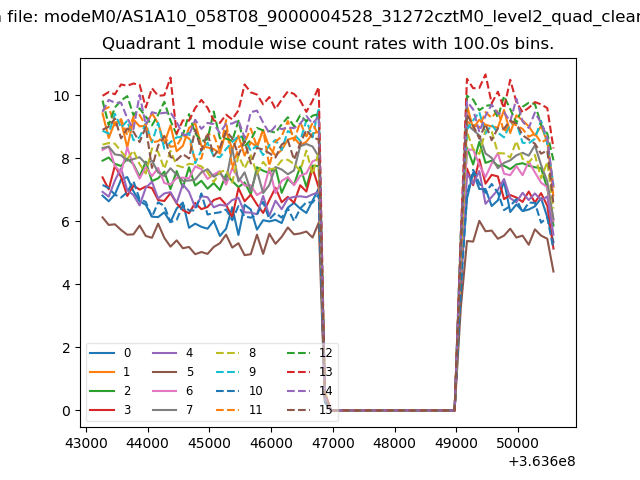
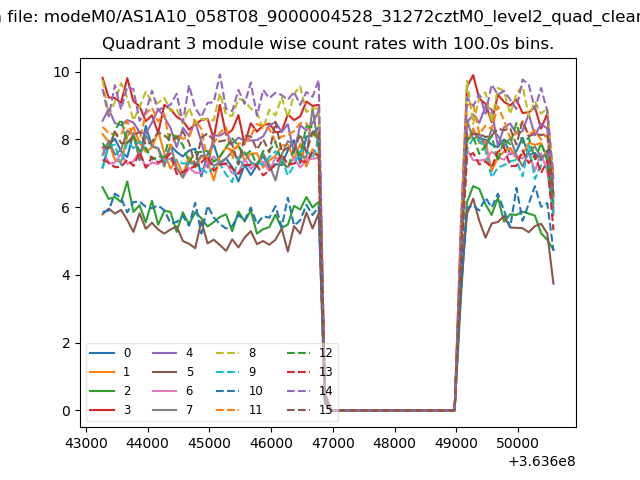
| Module-wise count rates for Quadrant A Data is divided into 100 sec bins |
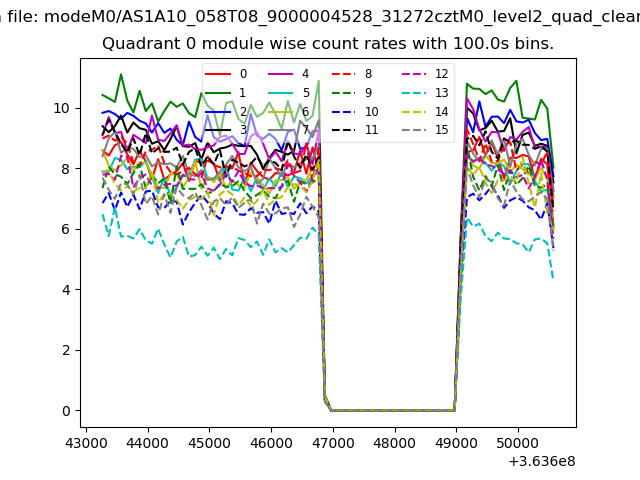 |
 |
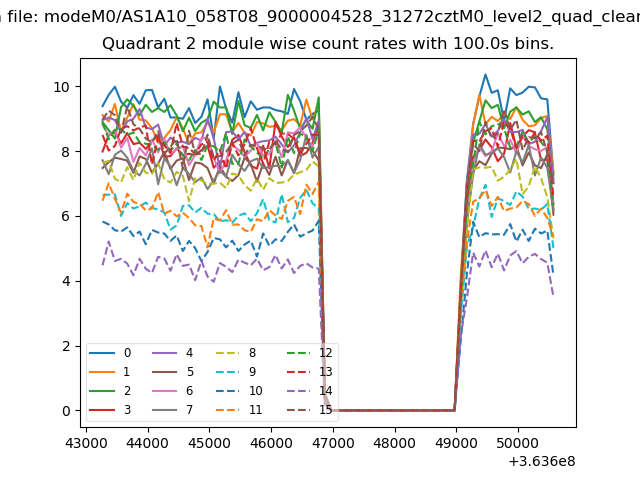
| Module-wise count rates for Quadrant B Data is divided into 100 sec bins |
 |
 |
| Module-wise count rates for Quadrant C Data is divided into 100 sec bins |
 |
 |
| Module-wise count rates for Quadrant D Data is divided into 100 sec bins |
 |
 |
| Parameter | Plot |
|---|---|
| CZT HV Monitor | 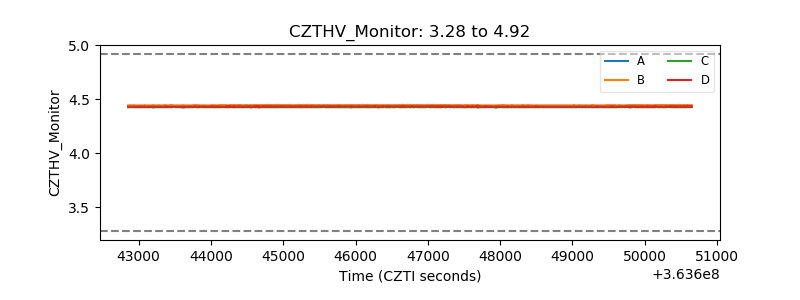 |
| D_VDD | 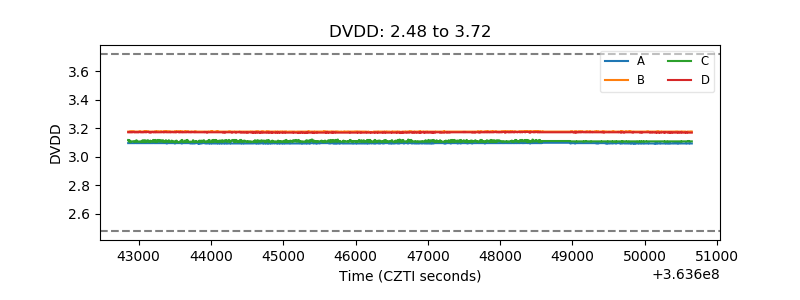 |
| Temperature 1 | 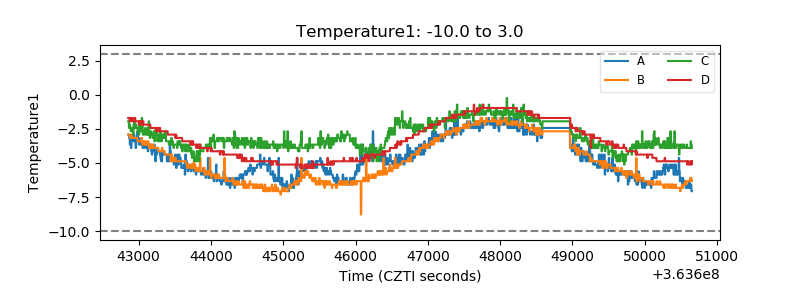 |
| Veto HV Monitor | 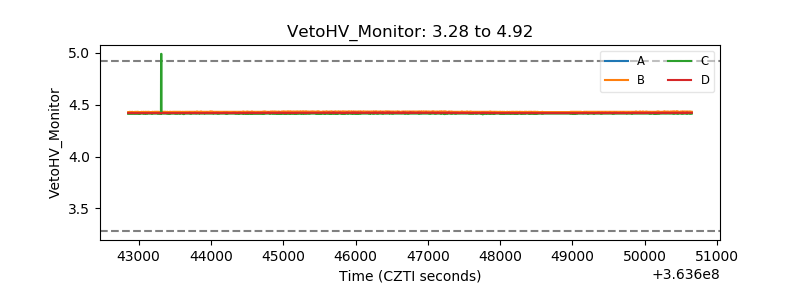 |
| Veto LLD | 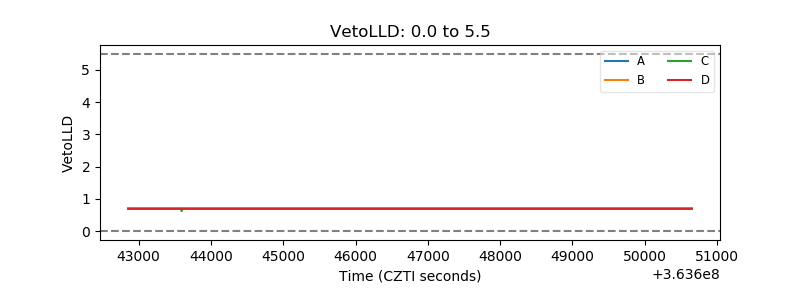 |
| Alpha Counter | 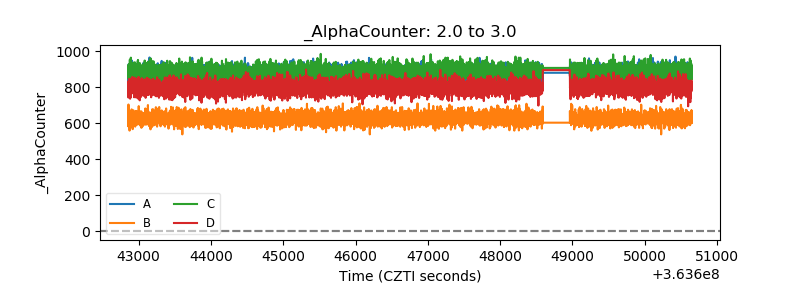 |
| _CPM_Rate | 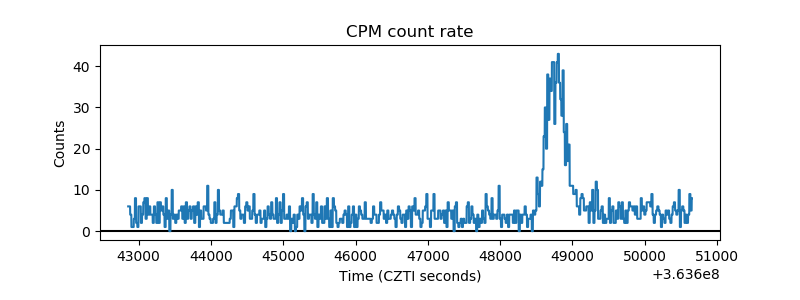 |
| CZT Counter | 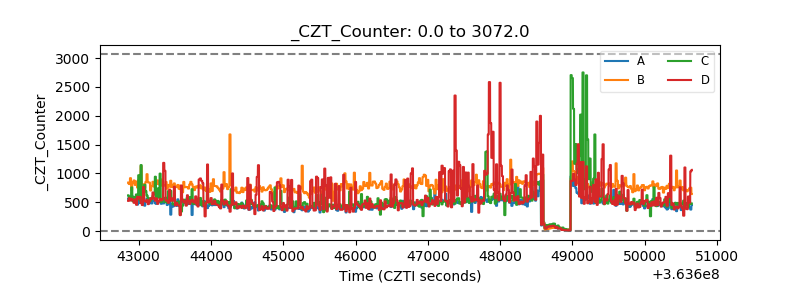 |
| +2.5 Volts monitor |  |
| +5 Volts monitor |  |
| _ROLL_ROT | 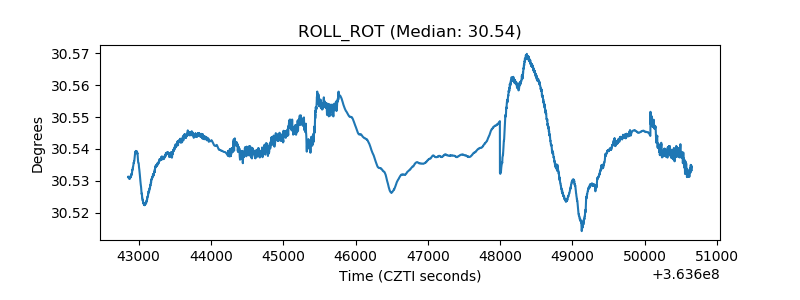 |
| _Roll_DEC | 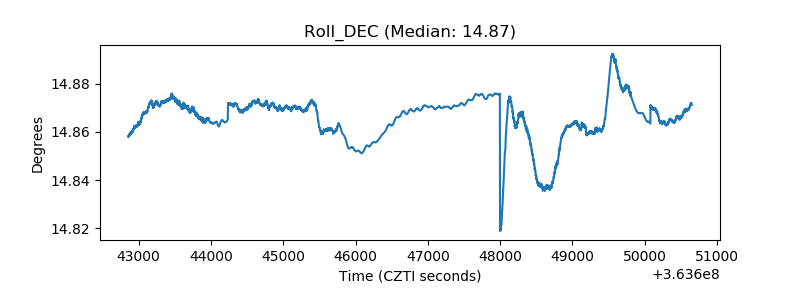 |
| _Roll_RA | 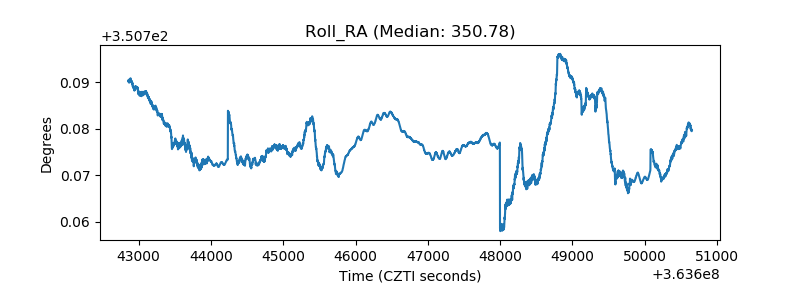 |
| Veto Counter | 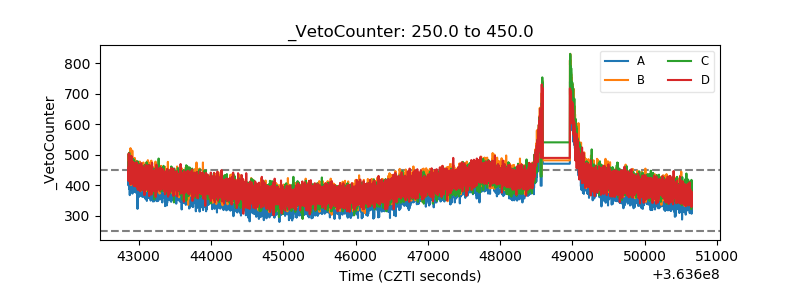 |