| Param | Original file | Final file |
|---|---|---|
| Filename | modeM0/AS1A10_058T08_9000004528_31274cztM0_level2.evt | modeM0/AS1A10_058T08_9000004528_31274cztM0_level2_quad_clean.evt |
| Size (bytes) | 1,040,201,280 | 167,699,520 |
| Size | 992.0 MB | 159.9 MB |
| Events in quadrant A | 6,046,412 | 1,075,494 |
| Events in quadrant B | 9,922,213 | 1,066,007 |
| Events in quadrant C | 7,061,012 | 1,022,697 |
| Events in quadrant D | 7,604,166 | 1,025,579 |
| Mode M9 | |||
|---|---|---|---|
| Quadrant | BADHDUFLAG | Total packets | Discarded packets |
| A | 0 | 16 | 0 |
| B | 0 | 17 | 0 |
| C | 0 | 17 | 0 |
| D | 0 | 17 | 0 |
| Mode M0 | |||
|---|---|---|---|
| Quadrant | BADHDUFLAG | Total packets | Discarded packets |
| A | 0 | 26476 | 3 |
| B | 0 | 39145 | 3 |
| C | 0 | 29008 | 3 |
| D | 0 | 31379 | 3 |
| Mode SS | |||
|---|---|---|---|
| Quadrant | BADHDUFLAG | Total packets | Discarded packets |
| A | 0 | 260 | 0 |
| B | 0 | 260 | 0 |
| C | 0 | 260 | 0 |
| D | 0 | 260 | 0 |
| Quadrant | Total seconds | Saturated seconds | Saturation percentage |
|---|---|---|---|
| A | 12874 | 72 | 0.559267% |
| B | 12874 | 239 | 1.856455% |
| C | 12873 | 402 | 3.122815% |
| D | 12873 | 129 | 1.002097% |
Noise dominated data is calculated using 1-second bins in cleaned event files. If a bin has >2000 counts, and if more than 50% of those come from <1% of pixels, then it is considered to be noise-dominated and hence unusable.
| Quadrant | # 1 sec bins | Bins with >0 counts | Bins with >2000 counts | High rate bins dominated by noise | Noise dominated (total time) | Noise dominated (detector-on time) | Marked lightcurve |
|---|---|---|---|---|---|---|---|
| A | 14239 | 12876 | 0 | 0 | 0.00% | 0.00% |  |
| B | 14239 | 12876 | 2 | 2 | 0.01% | 0.02% | 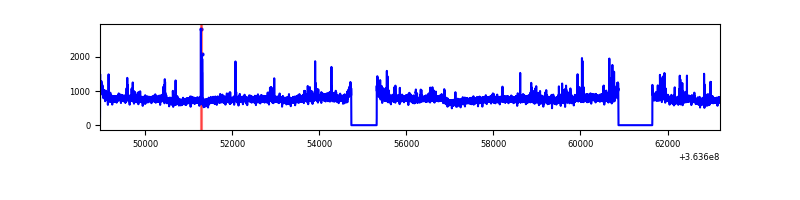 |
| C | 14238 | 12875 | 113 | 113 | 0.79% | 0.88% | 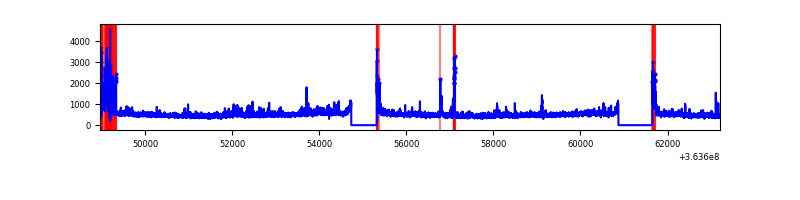 |
| D | 14238 | 12875 | 41 | 41 | 0.29% | 0.32% | 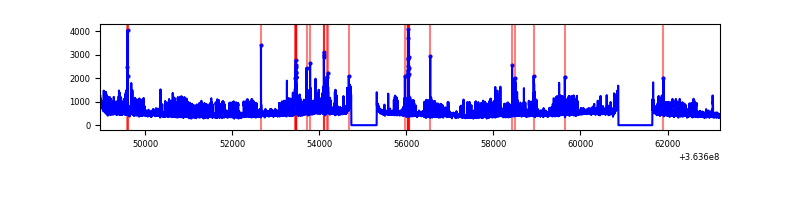 |
Top three noisy pixels from each quadrant. If the there are fewer than three noisy pixels in the level2.evt file, extra rows are filled as -1
| Pixel properties | Quadrant properties | ||||||
|---|---|---|---|---|---|---|---|
| Quadrant | DetID | PixID | Counts | Sigma | Mean | Median | Sigma |
| A | 13 | 254 | 23411 | 69.55 | 1567 | 1536 | 314.5 |
| A | 3 | 137 | 16337 | 47.06 | 1567 | 1536 | 314.5 |
| A | 0 | 226 | 13275 | 37.32 | 1567 | 1536 | 314.5 |
| B | 6 | 159 | 3630752 | 12006.56 | 1548 | 1502 | 302.3 |
| B | 4 | 80 | 123982 | 405.2 | 1548 | 1502 | 302.3 |
| B | 12 | 111 | 38139 | 121.2 | 1548 | 1502 | 302.3 |
| C | 0 | 10 | 593651 | 1701.41 | 1484 | 1492 | 348.0 |
| C | 3 | 233 | 392474 | 1123.38 | 1484 | 1492 | 348.0 |
| C | 14 | 238 | 243665 | 695.82 | 1484 | 1492 | 348.0 |
| D | 8 | 195 | 1468196 | 3773.23 | 1505 | 1469 | 388.7 |
| D | 12 | 233 | 202402 | 516.91 | 1505 | 1469 | 388.7 |
| D | 2 | 250 | 150975 | 384.61 | 1505 | 1469 | 388.7 |
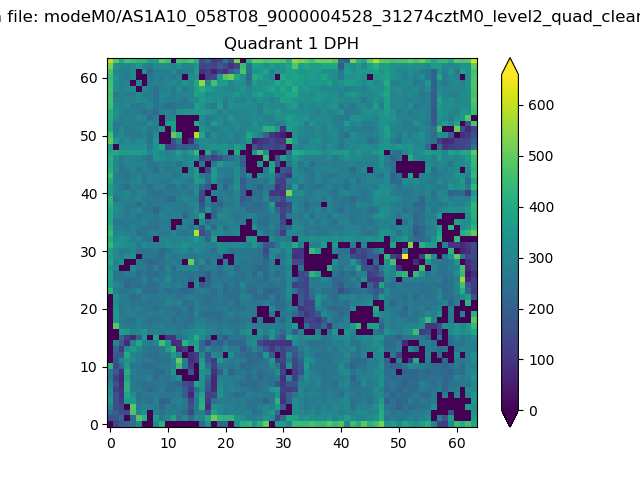
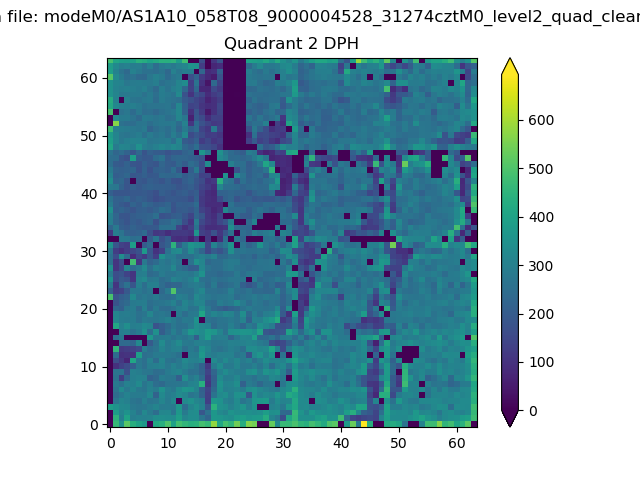
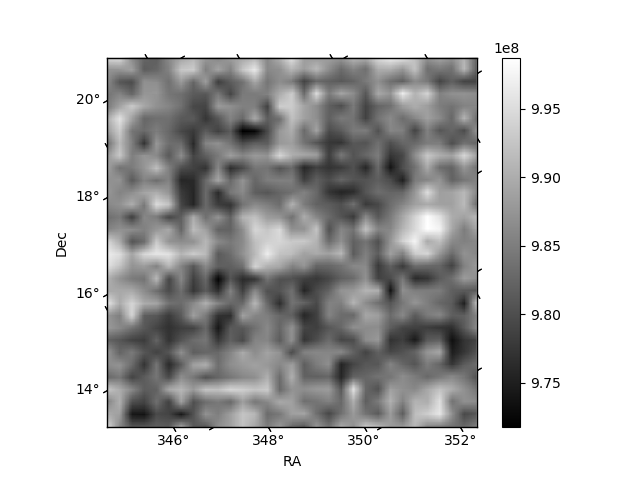
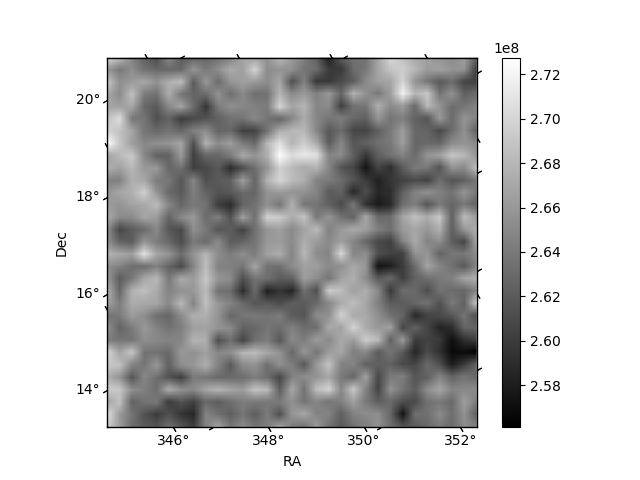
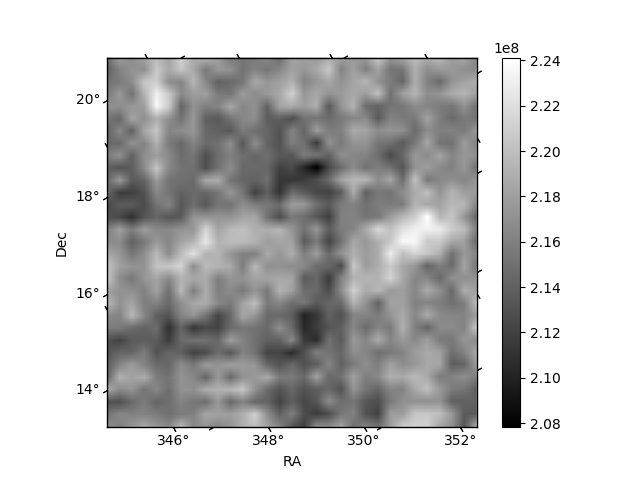
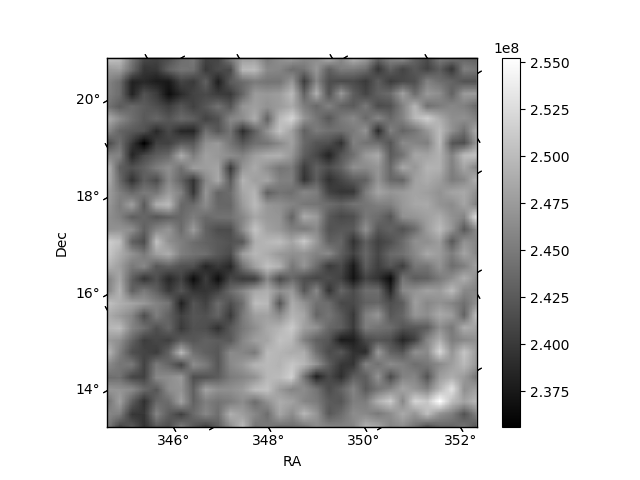
Histogram calculated using DETX and DETY for each event in the final _common_clean file
| Quadrant A | 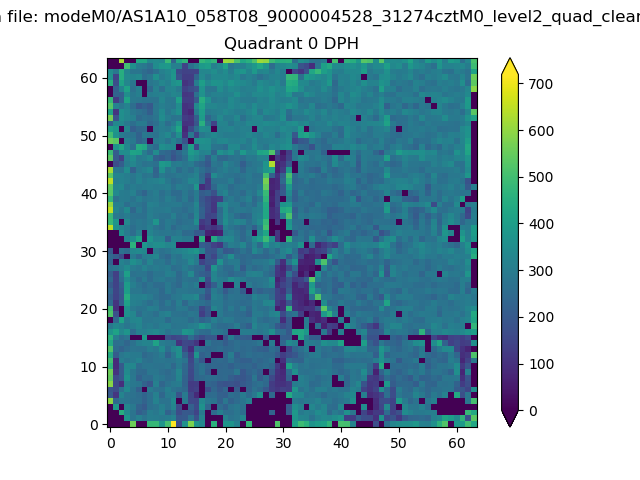 |
 |
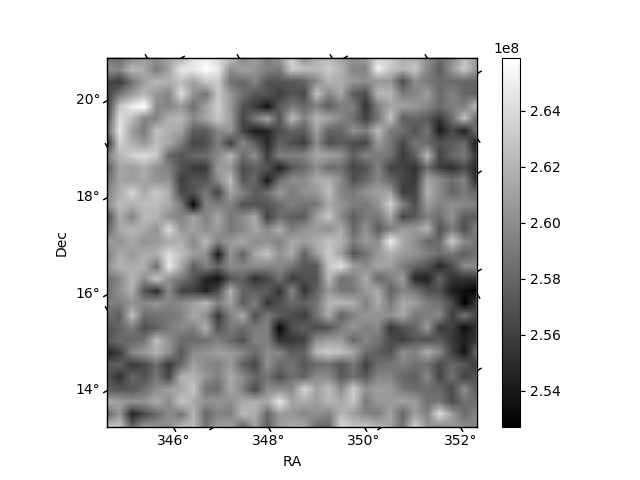
Quadrant B |
|---|---|---|---|
| Quadrant D | 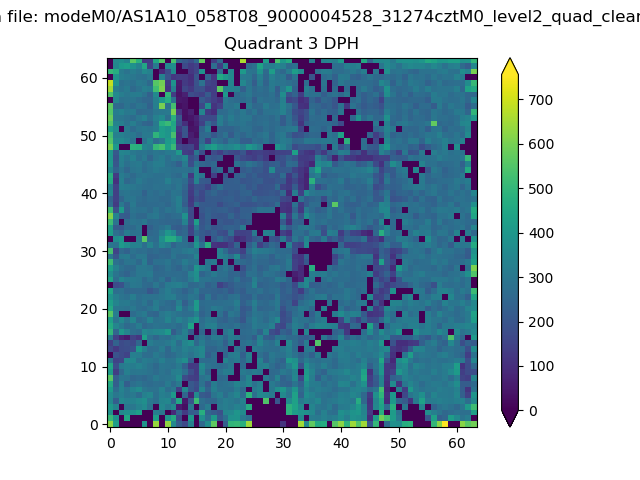 |
 |
Quadrant C |
| Plot type | Count rate plots | Images |
|---|---|---|
| Comparison with Poisson distribution Blue bars denote a histogram of data divided into 1 sec bins. Red curve is a Poisson curve with rate = median count rate of data. |
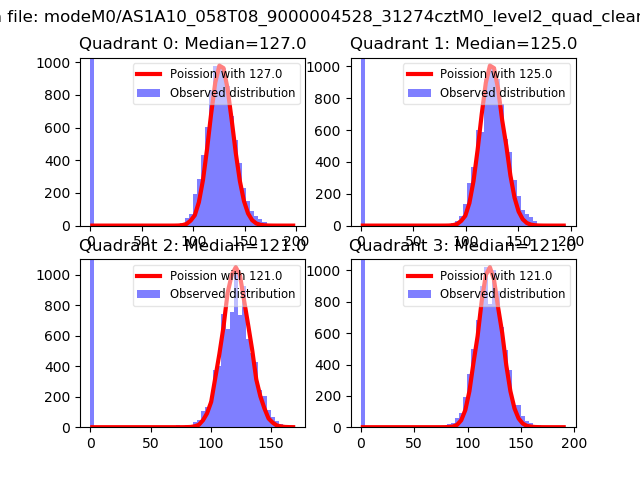 |
 |
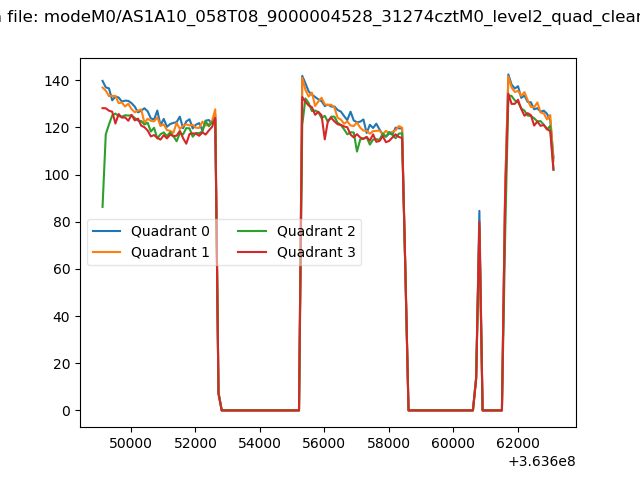
| Quadrant-wise count rates Data is divided into 100 sec bins |
 |
|
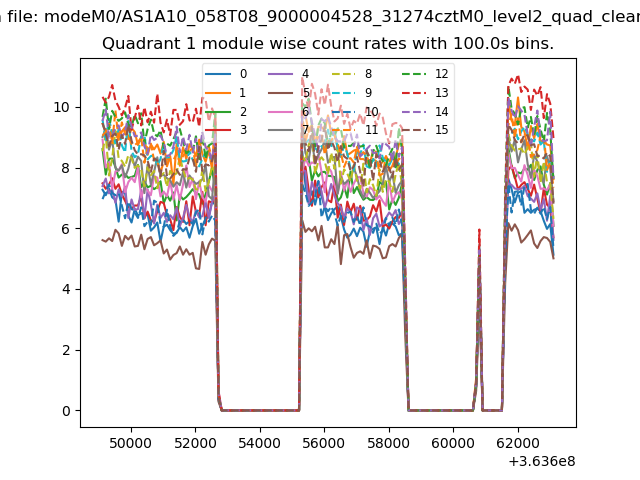
| Module-wise count rates for Quadrant A Data is divided into 100 sec bins |
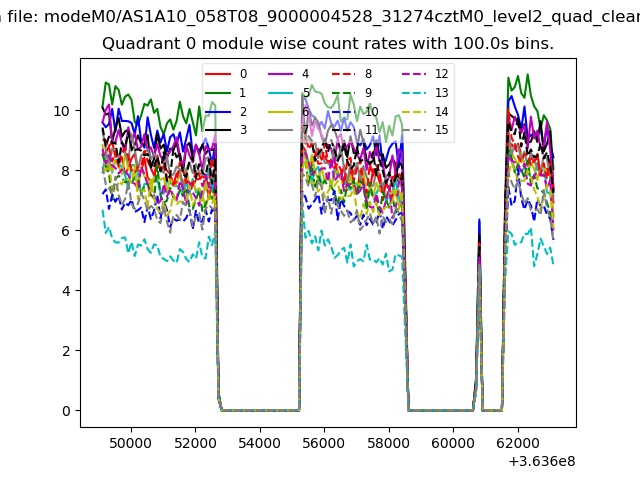 |
 |
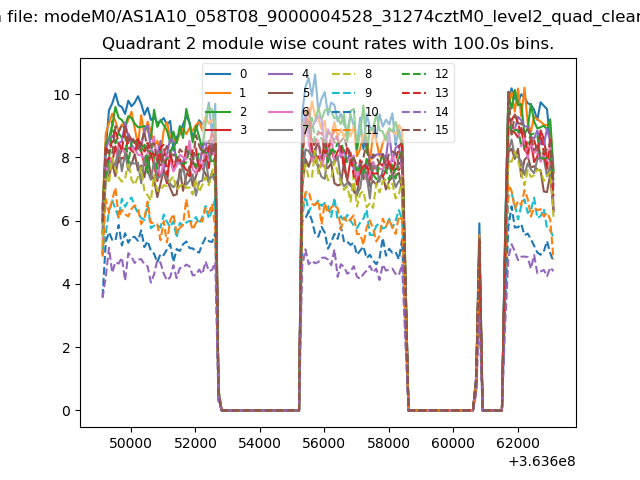
| Module-wise count rates for Quadrant B Data is divided into 100 sec bins |
 |
 |
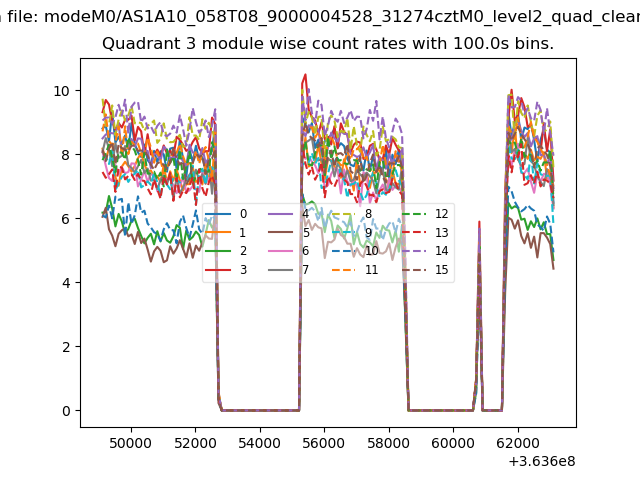
| Module-wise count rates for Quadrant C Data is divided into 100 sec bins |
 |
 |
| Module-wise count rates for Quadrant D Data is divided into 100 sec bins |
 |
 |
| Parameter | Plot |
|---|---|
| CZT HV Monitor | 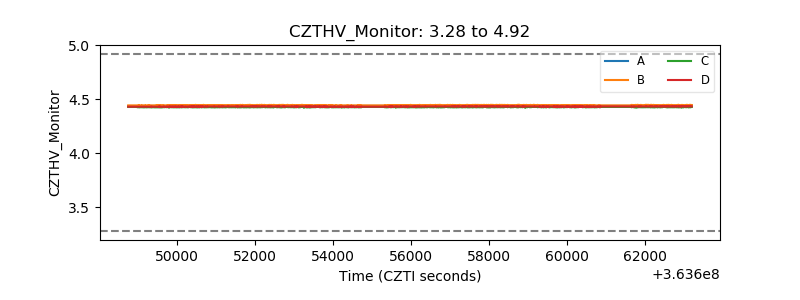 |
| D_VDD | 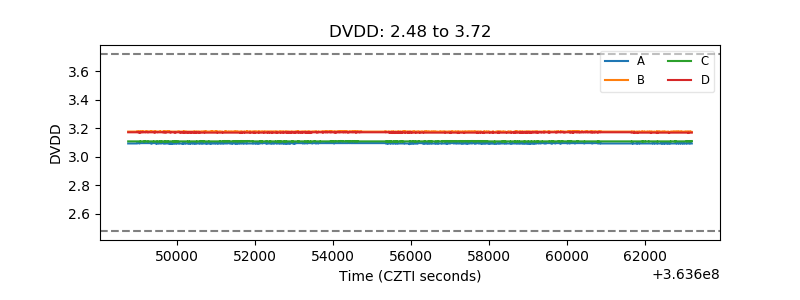 |
| Temperature 1 |  |
| Veto HV Monitor | 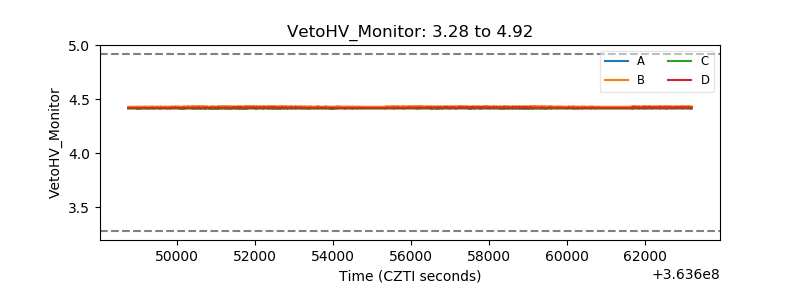 |
| Veto LLD | 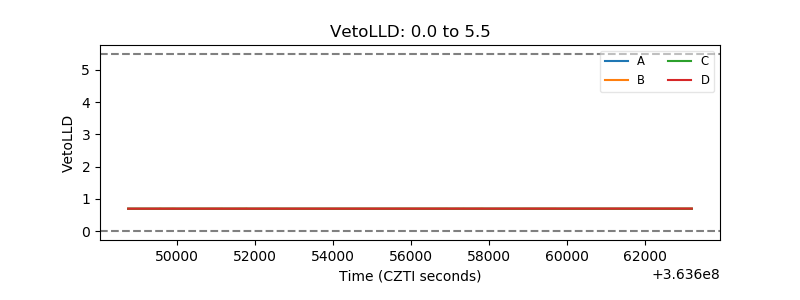 |
| Alpha Counter | 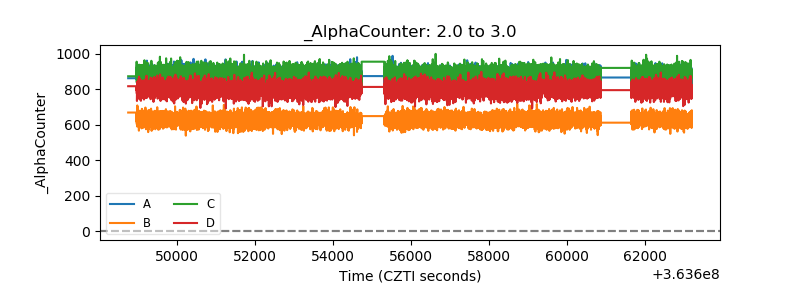 |
| _CPM_Rate | 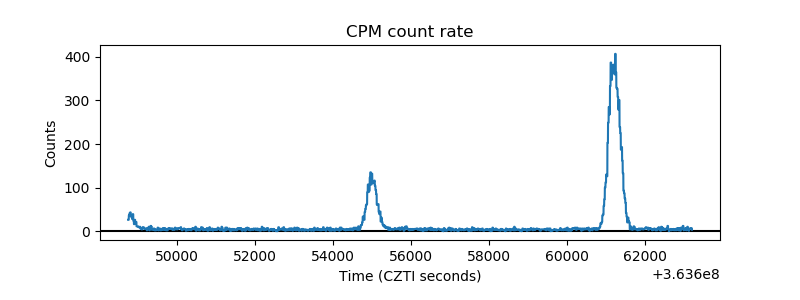 |
| CZT Counter | 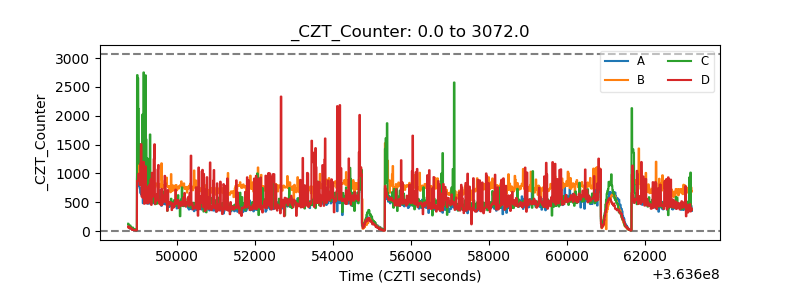 |
| +2.5 Volts monitor |  |
| +5 Volts monitor |  |
| _ROLL_ROT | 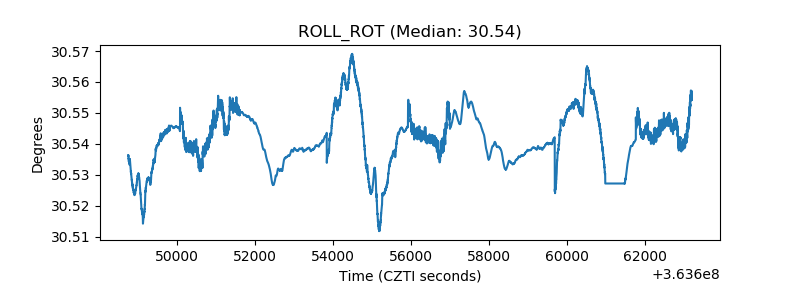 |
| _Roll_DEC | 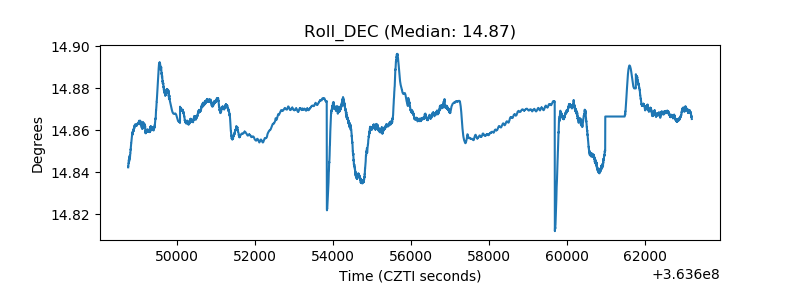 |
| _Roll_RA | 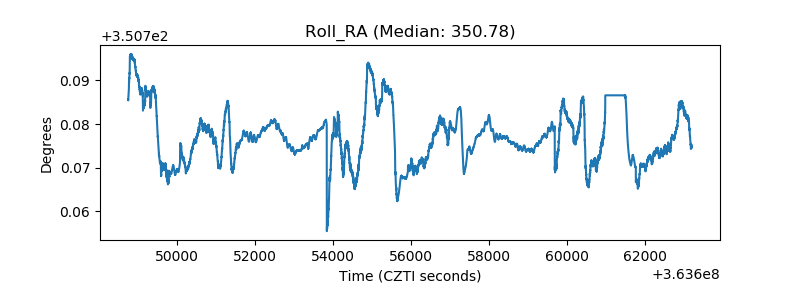 |
| Veto Counter |  |